Trade Expectancy Explained: The One Number That Decides If a System Makes Money
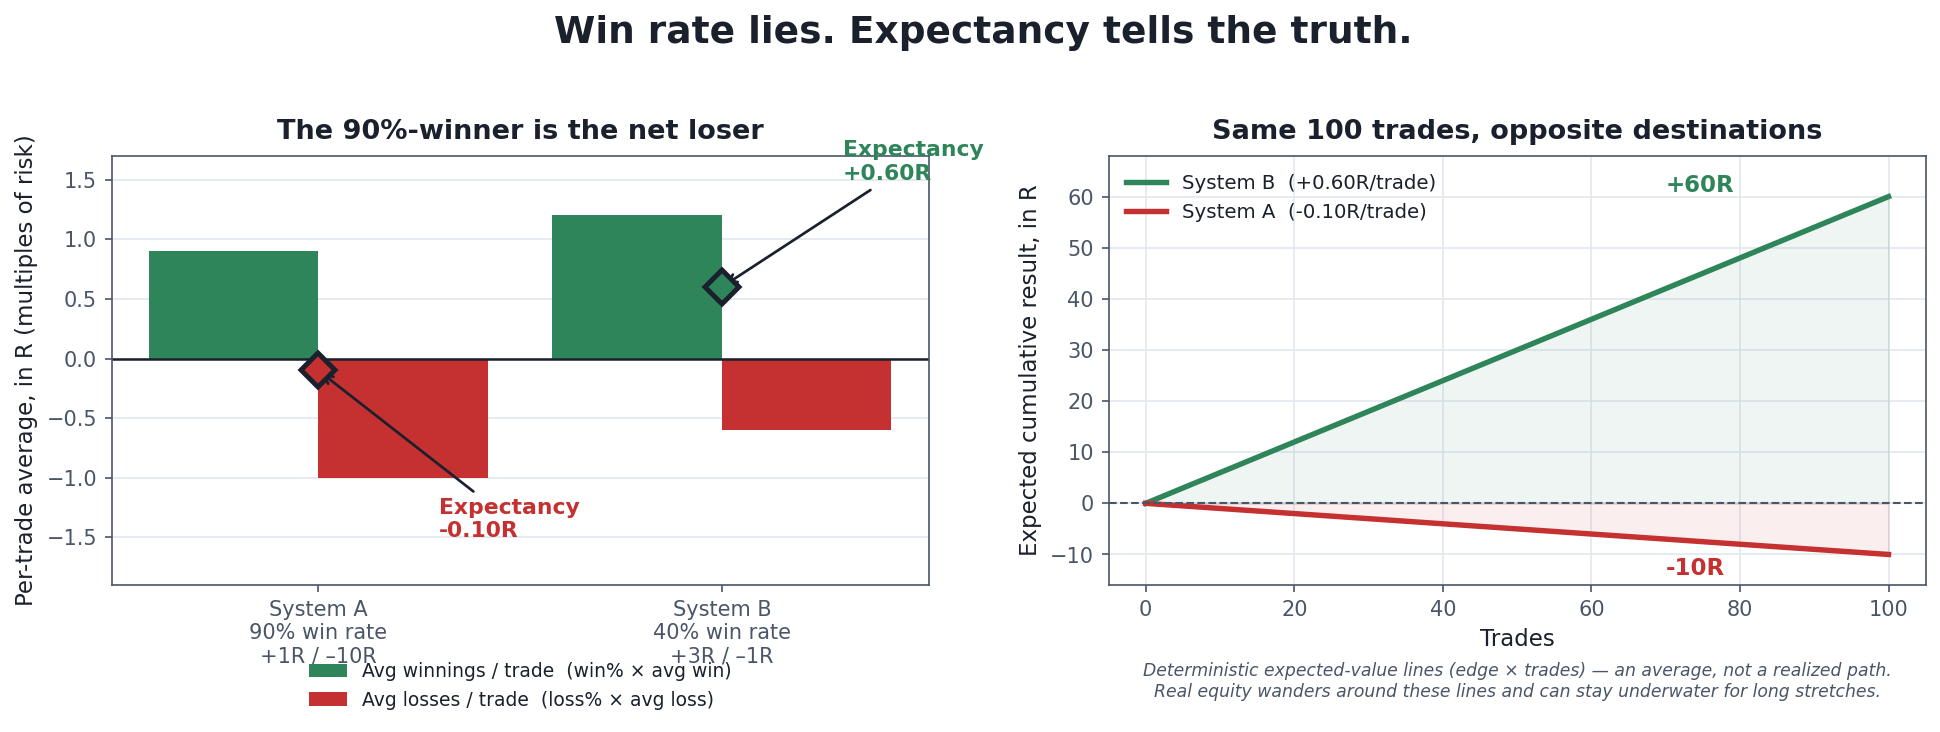
Everything this article argues, in one picture. A system that wins 90% of the time can bleed money, and a system that loses 60% of the time can compound beautifully — because how often you win says almost nothing until you also know how much you win versus how much you lose. Expectancy is the number that combines both.
Ask a new trader what makes a strategy good and the answer is almost always some version of “it’s right a lot.” Win rate is intuitive, it feels like skill, and it is the number brokers, gurus, and backtests love to put in big font. It is also, on its own, close to meaningless. A system that wins 90% of its trades can lose money hand over fist, and a system that loses 60% of its trades can be a quiet machine — and the single number that tells the two apart is expectancy: the average amount you can expect a system to win or lose per trade, once win rate and the size of your wins and losses are all accounted for together.
This is a trading-systems article, so the silo’s non-negotiable rule governs every line: past backtest performance does not predict future results. An expectancy figure is a historical average computed over one specific set of trades — it describes what a track record did, not what the next hundred trades will do. A gorgeous backtested expectancy is exactly as much a lucky-sample statistic as a gorgeous backtested return, and, as the second half of this article shows, it is unusually easy to inflate by accident.
What Expectancy Actually Measures
Expectancy answers one question: on average, across many trades, how much does this system make or lose each time I take a trade? It is a per-trade average, and its sign is the whole ballgame. A positive expectancy means that if you take the trade enough times under the same conditions, the wins outweigh the losses and the account grinds upward. A negative expectancy means the reverse — the system is a slow (or fast) leak, no matter how good it feels in the moment or how often it wins. Everything else about a system — how exciting it is, how often it’s right, how clever the indicator is — is subordinate to that sign.
The reason win rate alone can’t answer this is that it throws away half the information. Winning 70% of the time is wonderful if your wins and losses are the same size, and a disaster if your average loss is five times your average win. Expectancy refuses to look at win rate in isolation: it weighs how often you win against how much you win versus lose, and collapses both into one honest number.
The Formula, Precisely
Getting the formula exactly right matters, because a wrong version is a checkable error, not a stylistic quibble. Expectancy is:
Expectancy = (Win rate × Average win) − (Loss rate × Average loss)
where win rate is the fraction of trades that win, loss rate is the fraction that lose (if some trades scratch at breakeven, loss rate = 1 − win rate − breakeven rate), average win is the mean size of a winning trade, and average loss is the mean size of a losing trade (entered as a positive number that the formula subtracts) [source: standard definition of trade expectancy; the framework was popularized for traders by Van K. Tharp in Trade Your Way to Financial Freedom (1998), which recast per-trade results as “R-multiples” and the system’s edge as expectancy — see also the plain-English summaries at P&L Ledger and JournalPlus].
A worked example makes it concrete. Suppose a system wins 40% of the time, its average winner is $600, and its average loser is $200:
Expectancy = (0.40 × $600) − (0.60 × $200) = $240 − $120 = +$120 per trade
Positive — so over many trades this system is expected to make about $120 each time you pull the trigger, on average. Contrast a system that wins 70% of the time but whose average winner is $150 and average loser is $400:
Expectancy = (0.70 × $150) − (0.30 × $400) = $105 − $120 = −$15 per trade
Negative — a net loser that wins more than two out of three times. Same person could trade both, “feel like a winner” far more often on the second, and go broke on it. That inversion — high win rate, negative expectancy — is the single most important thing this article has to teach, and it is exactly what the featured chart above dramatizes with its extreme case: a 90%-win system that still loses money because its rare losers are catastrophic.
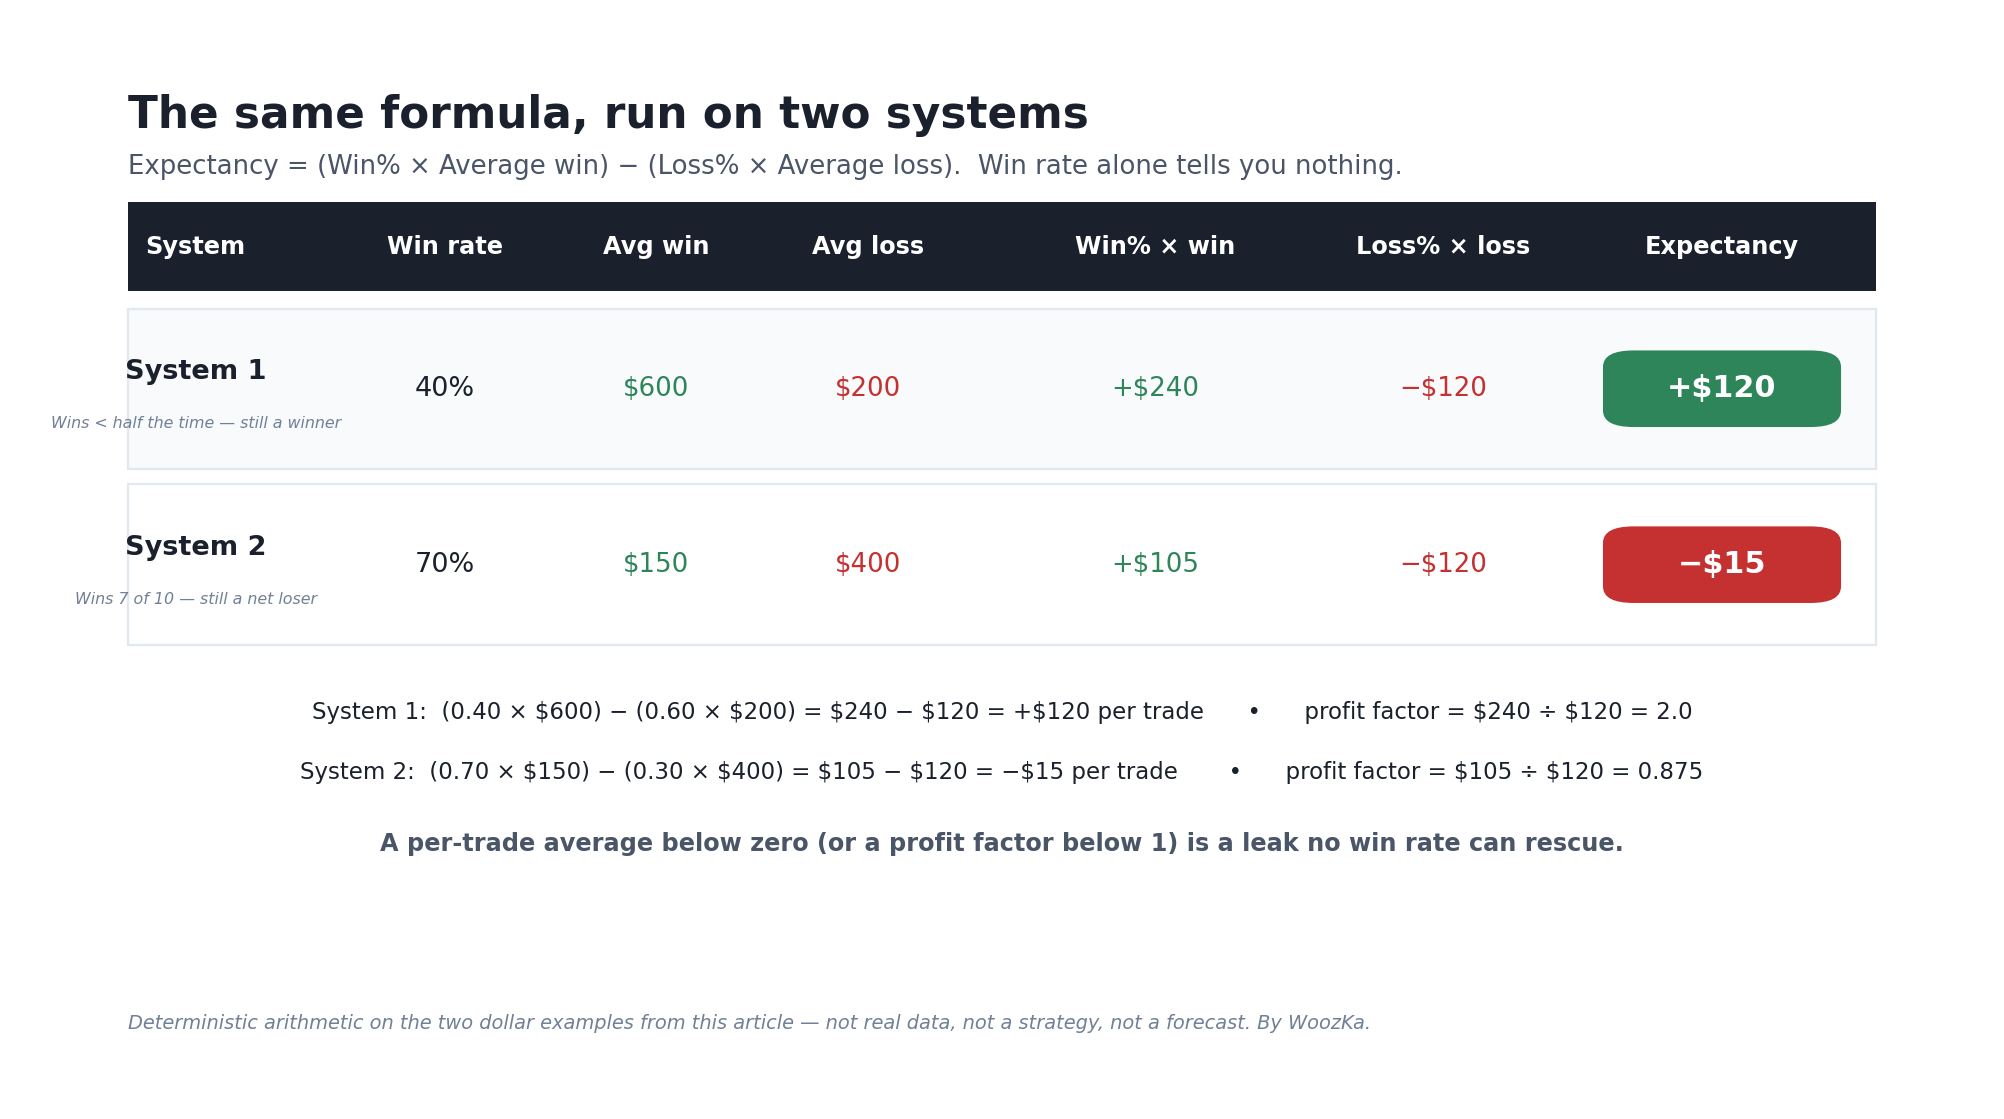
The same expectancy formula, worked line by line on both dollar systems from the text: win rate sets neither the sign nor the size of the edge — the average win and average loss do.
The same formula, run on two systems. The 70%-win system is the net loser.
| System 1 | System 2 | |
|---|---|---|
| Win rate | 40% | 70% |
| Average win | $600 | $150 |
| Average loss | $200 | $400 |
| Expectancy | (0.40 × $600) − (0.60 × $200) = $240 − $120 = +$120 per trade | (0.70 × $150) − (0.30 × $400) = $105 − $120 = −$15 per trade |
| Profit factor | 2.0 | 0.875 |
Thinking in R: The Trader’s Unit
There’s a cleaner way to carry expectancy around in your head, and it’s worth adopting: express everything as a multiple of the amount you risked on the trade. That unit is called R, and it’s the single most useful idea in this whole area. R is your initial risk — the distance from your entry to your stop-loss, times your position size, i.e. the dollar amount you’d lose if the trade hit its stop [source: R-multiple definition per Van K. Tharp; “R” is the initial risk, usually entry minus stop-loss — summarized at P&L Ledger, Trademetria, and SpreadsheetsHub]. A trade that makes twice what you risked is a +2R trade; one that loses exactly what you risked is a −1R trade; a trade you cut early for half the planned loss is −0.5R.
The payoff of thinking in R is enormous. It standardizes every trade onto one scale, so a scalp in a futures contract and a swing trade in a stock become directly comparable — both are just numbers of R. And it makes expectancy dimensionless and portable:
Expectancy (in R) = (Win rate × Average win in R) − (Loss rate × Average loss in R)
A system that wins 40% of the time with an average +3R winner and an average −1R loser has an expectancy of (0.40 × 3) − (0.60 × 1) = +0.60R per trade — meaning that, on average, each trade is expected to return six-tenths of what you risked. That is a genuinely strong system, and it wins fewer than half its trades. As a rough sense of scale, a per-trade expectancy in the neighborhood of a few tenths of an R is already a real, tradeable edge; systems built and traded by disciplined professionals often live in a modest positive-R band rather than some fantasy number, and anything you can only reach with a suspiciously huge R is usually a sign of a curve-fit backtest rather than a durable edge [source: R-multiple expectancy benchmarks discussed in trader education material, e.g. Traders’ Second Brain and JournalPlus; treat specific benchmark bands as rules of thumb, not guarantees].
Win Rate Is a Trap
Here is the trap laid bare. Look again at the two systems in the featured chart:
- System A wins 90% of the time. Its winners average +1R and its rare losers average −10R. Expectancy = (0.90 × 1) − (0.10 × 10) = 0.90 − 1.00 = −0.10R. A net loser that is right nine times out of ten.
- System B wins 40% of the time. Its winners average +3R and its losers average −1R. Expectancy = (0.40 × 3) − (0.60 × 1) = 1.20 − 0.60 = +0.60R. A strong winner that is wrong more often than it’s right.
System A is the emotional profile that ruins accounts: a strategy that wins constantly, feels infallible, and is quietly setting fire to money because on the occasions it loses, it loses enormously. Selling far-out-of-the-money options, “adding to losers” until they turn, martingale-style averaging down, and holding losses while snatching small gains all produce this shape — a tall stack of small green wins and a hidden −10R waiting in the tail. High win rate is often purchased by accepting a horrible reward-to-risk ratio, and expectancy is what strips away the disguise. The right panel of the chart follows the two systems out to 100 trades: System B compounds toward +60R while System A drifts to −10R. Same number of trades, opposite fates, and the win rate pointed you at exactly the wrong one.
The Two Companion Numbers: Profit Factor and Breakeven Win Rate
Expectancy has two close relatives that appear on the same reports, and understanding all three together is what real system evaluation looks like.
Profit factor is the ratio of everything you won to everything you lost: gross profit divided by gross loss. In per-trade terms it’s:
Profit factor = (Win rate × Average win) ÷ (Loss rate × Average loss)
For System B above that’s 1.20 ÷ 0.60 = 2.0 — the system made two dollars for every dollar it lost. A profit factor above 1 means positive expectancy; below 1 means negative; and profit factor is a nice complement because it expresses the edge as a ratio (how efficiently the system converts risk to reward) while expectancy expresses it as an amount (how much per trade). A system can have a high profit factor but a tiny expectancy if it trades rarely, and vice versa.
Breakeven win rate flips the question around: given your reward-to-risk ratio, what win rate do you need just to break even?
Breakeven win rate = Average loss ÷ (Average win + Average loss)
If your winners are 3R and your losers are 1R, your breakeven win rate is 1 ÷ (3 + 1) = 25% — you can be wrong three times out of four and still not lose money. This is the mathematical backbone of the trend-follower’s creed that you can win rarely and prosper: a high reward-to-risk ratio drags the bar you have to clear way down. Conversely, a 1:2 reward-to-risk system (winners half the size of losers) has a breakeven win rate of 2 ÷ (1 + 2) = 67%, so it has to be right two times out of three just to tread water — a brutal standard that most such systems fail to meet in live trading once costs arrive. (The reward-to-risk ratio itself gets the full treatment in the risk/reward ratio explainer and the calculator that pairs with it.)
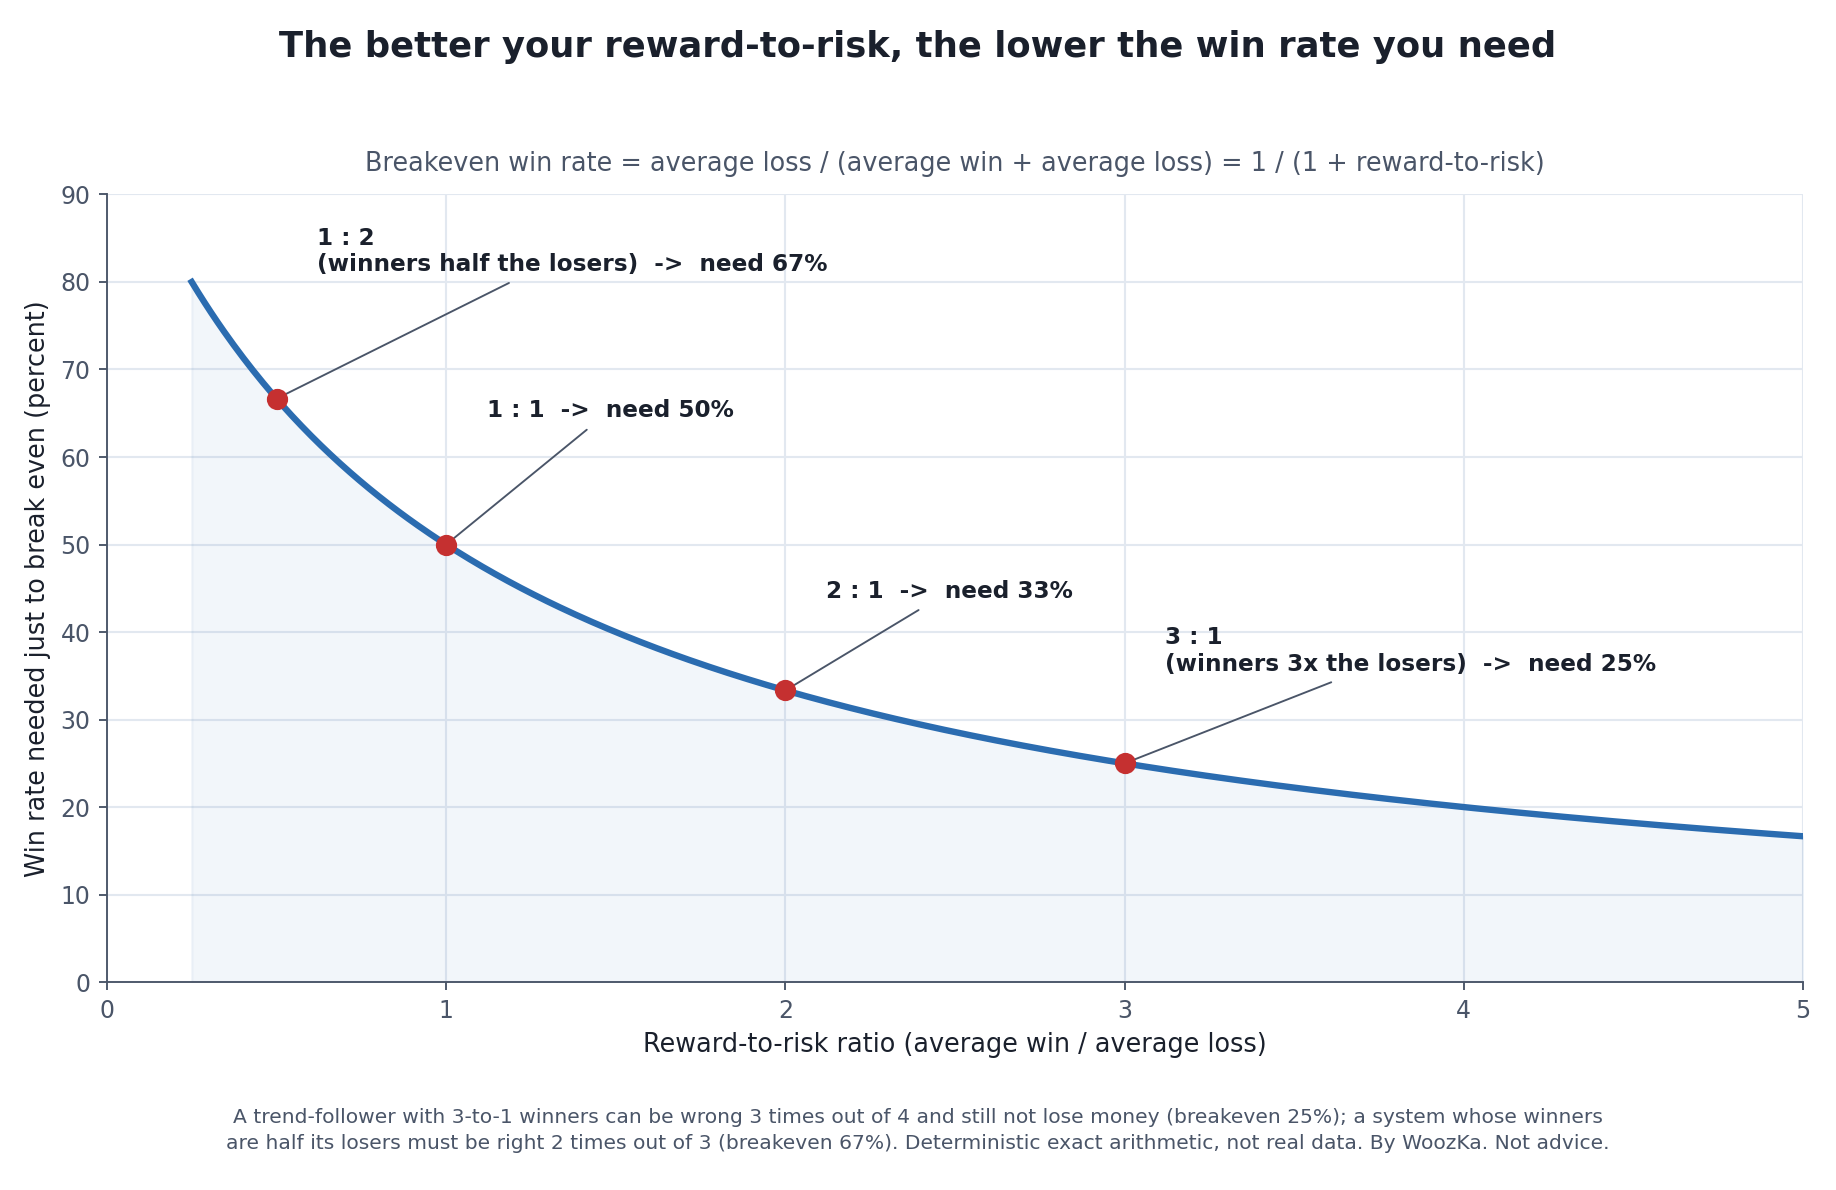
The breakeven win rate, drawn. The bar you must clear is set entirely by your reward-to-risk ratio: rich winners drag it down toward the floor, small winners shove it up past two-in-three. This is why “win rate” means nothing until you say it alongside the size of the wins and losses behind it.
Expectancy Is a Long-Run Average, Not a Promise
This is the caveat that keeps expectancy honest, and it’s the one most likely to hurt you if you forget it. A positive expectancy is a statement about the long-run average across many independent trades — it is emphatically not a promise about the next trade, the next ten, or even the next fifty. A +0.60R system will still string together losing trades, sometimes long strings, and will still put you through drawdowns that feel like the edge has vanished. The order in which wins and losses arrive — the sequence — is random, and a bad sequence early can dig a hole that a positive expectancy only slowly climbs out of.
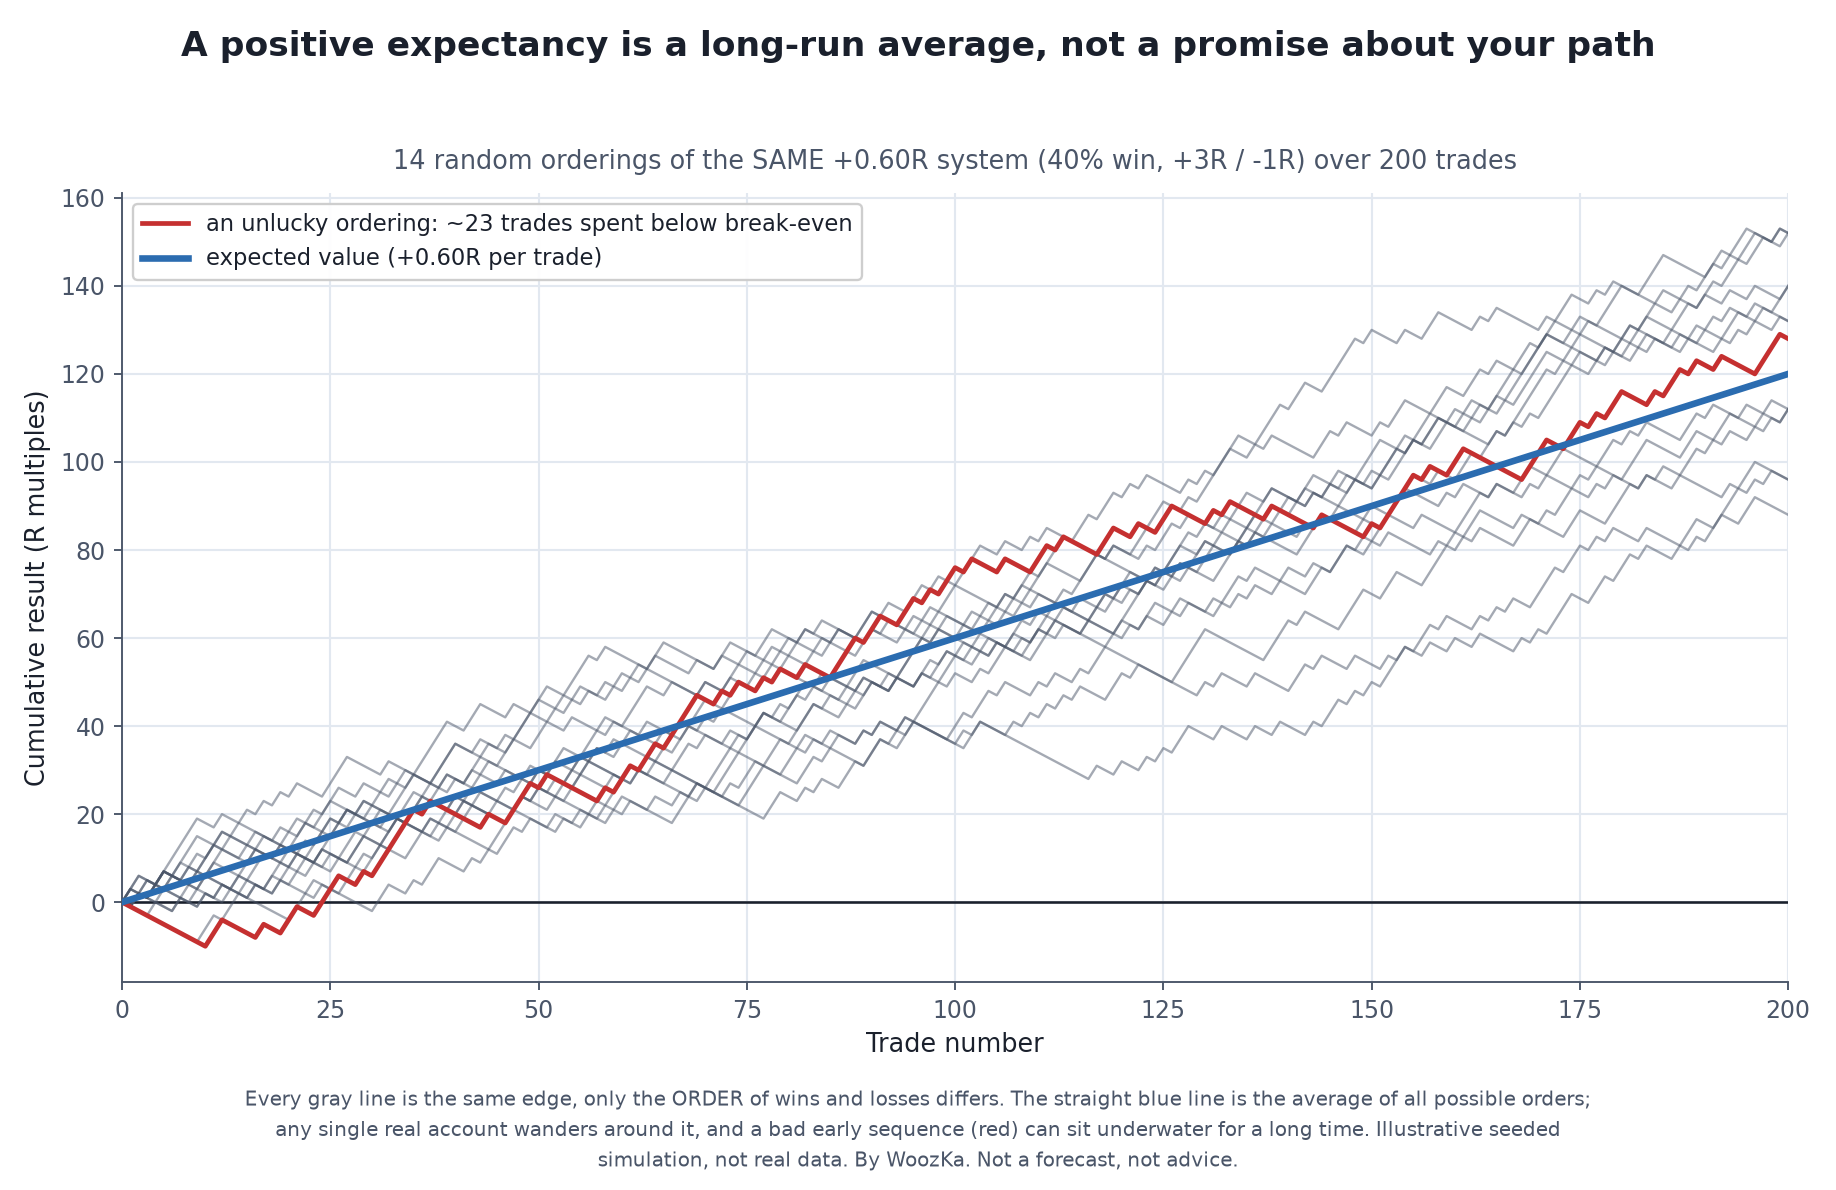
Same edge, fourteen fates. Only the order of the wins and losses differs between the gray lines, yet some spend dozens of trades underwater before turning up. The straight line is the average you’re entitled to over the long run — not the path you’ll actually walk, which is exactly why survival (position sizing) matters as much as the edge itself.
That’s why the right panel of the chart is drawn as a straight expected-value line rather than a realistic equity curve: the straight line is the average of many possible paths, and any single real path wanders above and below it, sometimes staying underwater for a discouragingly long time. Two things follow. First, a positive expectancy is necessary but not sufficient for survival — you also have to size your positions so that a normal-but-ugly losing streak doesn’t end you before the average asserts itself. That’s the entire subject of risk of ruin and position sizing, and it is the reason expectancy and sizing are two halves of one skill. Second, you cannot judge whether your live results have “broken” from your expectancy over a small number of trades — the noise swamps the signal until the sample gets large.
Where Expectancy Lies to You
Expectancy is only as trustworthy as the numbers you feed it, and there are four reliable ways the inputs get corrupted — each of which flatters a system that has no real edge.
A small or curated sample. Expectancy computed from 20 trades tells you almost nothing; the average win and average loss are still dominated by luck. Worse, if the sample was hand-picked — your “best setups,” a demo account, a favorable stretch of market — the expectancy describes that stretch and not the strategy. It takes a genuinely large, representative sample of trades before an expectancy figure is worth trusting, and even then only for the market regime that produced it.
An overfit backtest. This is the big one, and it is why this article lives in the same cluster as the overfitting explainer. If you try enough indicator combinations and parameter settings, one of them will show a spectacular backtested expectancy from pure chance — the luckiest configuration of many. That number is not an edge; it’s the fingerprint of the search that produced it, and it typically collapses (often to negative) the moment the system meets data it wasn’t tuned on. An expectancy from a backtest means little until you know how many variations were tried to find it and whether it survives out-of-sample and walk-forward testing.
Costs left outside the numbers. Expectancy is computed net of everything or it’s fiction. Commissions, the bid-ask spread, slippage, financing, and taxes all come straight out of the average win and add straight onto the average loss. A system with a slim positive expectancy on paper — say +0.1R — frequently crosses into negative territory once realistic costs are baked into every trade. If your average win and average loss don’t already have costs subtracted, your expectancy is an illusion. This is doubly true for high-frequency, small-edge systems, where costs can be larger than the entire edge.
A changed market. Expectancy is measured on the past; markets are non-stationary. A relationship that produced a positive expectancy for years can decay as conditions, participants, and volatility regimes shift. A stable historical expectancy is reassuring, but it is a description of a world that may no longer exist, which is why live monitoring — is the system still performing near its historical expectancy? — is part of trading it, not a one-time check.
Expectancy Per Unit of Time: Edge × Opportunity
One refinement separates a good system from a good business. A system’s edge is its expectancy per trade, but what actually grows your account is expectancy multiplied by how often you get to apply it. A +1R system that fires twice a year and a +0.2R system that fires ten times a week are not close — the second one applies its smaller edge so many more times that it compounds far faster. Van Tharp framed this as expectancy times opportunity (roughly, expectancy per trade × number of trades per period), and it’s the reason professional systematic traders will happily trade a small, reliable edge at high frequency over a large, rare one [source: the “expectancy × opportunity” framing per Van K. Tharp, Trade Your Way to Financial Freedom]. The catch, which closes the loop with the cost caveat above, is that frequency multiplies costs too — so a high-frequency edge has to clear a much higher cost bar before its many small R’s actually reach your account.
It took me too long to admit that for years I cared more about being right than about making money. When you’re winning, those feel like the same thing. They aren’t — and the gap between them is exactly where a high win rate does its quiet damage.
If you haven’t yet been burned by a win rate, it’s worth sitting with the shape of the experience, because it repeats endlessly. A system wins, and wins, and wins — a long, comforting run of green — and the win rate climbs to something that feels like mastery. Confidence grows, size creeps up, and the small, steady wins start to feel like income. Then one trade goes wrong in a way the winning streak never hinted at, and it gives back weeks of gains in an afternoon, because the whole time the system was quietly financing those frequent small wins by accepting one enormous hidden loss. The traders who avoid this aren’t the ones who win most often. They’re the ones who, before they ever size up, work out the average loss alongside the average win, compute the expectancy, and refuse to be flattered by a win rate until the math behind it checks out.
How Many Trades Before the Number Means Anything
Three times above, this article says a small sample cannot be trusted — “expectancy computed from 20 trades tells you almost nothing,” the noise “swamps the signal until the sample gets large,” you need “a genuinely large, representative sample.” It never says how large. That question has an exact answer, and this article already supplies everything needed to work it out.
Take System 1 from the worked example: wins 40% of the time, average winner $600, average loser $200. Since R is the initial risk, R is the average loss, so this is a system that pays +3R when it wins and −1R when it loses — which makes it exactly the 3R-winner case the breakeven section uses, with a bar of 25%. Its expectancy is +0.600R. The number nobody quotes alongside it is the spread of a single trade around that average: 1.9596R. The noise on one trade is 3.27 times the edge it is trying to reveal.
What a short sample can hide. True expectancy is +0.600R in every row. Only the number of trades changes. Middle 90% means the 5th to 95th percentile of the realized average, computed exactly from the binomial.
| Trades | Sample reads as losing | 5th pct | 95th pct | Range |
|---|---|---|---|---|
| 10 | 16.73% | −0.200R | +1.800R | 2.000R |
| 20 | 12.56% | −0.200R | +1.400R | 1.600R |
| 50 | 1.33% | +0.120R | +1.080R | 0.960R |
| 100 | 0.12% | +0.280R | +0.920R | 0.640R |
| 250 | 0.00% | +0.392R | +0.808R | 0.416R |
| 500 | 0.00% | +0.456R | +0.744R | 0.288R |
| 1,000 | 0.00% | +0.500R | +0.704R | 0.204R |
At 20 trades the middle 90% of honest outcomes runs from −0.200R to +1.400R. The same system, traded faithfully, with no curation and no bad luck beyond the ordinary, can hand you a losing average or one more than twice its true edge — and you cannot tell from the sample which you are holding. The chance of a losing-looking sample does not fall below 5% until trade 27. Even at 1,000 trades the range is still 0.204R wide, roughly a third of the edge being measured. “Large” here means hundreds, not dozens.
The System That Hides Is Not the One You Were Worried About
All of that describes the winner. The article’s real warning is about System 2 — the 70% winner that loses money — and that system behaves completely differently under sampling, for a reason visible in one comparison. System 1’s true win rate sits 15.000 points above its 25% breakeven. System 2’s sits 2.727 points below its own breakeven of 72.727%. Signal to noise: 0.3062 against 0.0595, a factor of 5.14.
How long each system stays disguised. The winner is confirmed quickly; the loser goes on looking like a winner for hundreds of trades.
| Trades | System 1 reads as losing | System 2 reads as profitable |
|---|---|---|
| 10 | 16.73% | 38.28% |
| 20 | 12.56% | 41.64% |
| 50 | 1.33% | 32.79% |
| 100 | 0.12% | 29.64% |
| 250 | 0.00% | 18.53% |
| 500 | 0.00% | 9.30% |
| 1,000 | 0.00% | 2.80% |
System 1 stops looking like a loser by trade 27. System 2 still looks profitable 29.64% of the time at 100 trades, and does not drop below 5% until trade 726 — 26.9 times longer. That is the danger stated properly. The high-win-rate loser is not merely wrong; it is camouflaged, and the camouflage holds for hundreds of trades because the system sits so close to its own breakeven bar that ordinary variation carries it across in either direction. A trader running System 2 for a year and reviewing a hundred trades has better than a one-in-four chance of concluding the thing works.
One honest wrinkle in that second column: it rises from 38.28% at ten trades to 41.64% at twenty before it starts falling. That is not a trend, it is arithmetic on whole numbers — at twenty trades a profitable-looking sample needs 15 wins out of 20, and where the threshold happens to land between two integers moves in the system’s favor at that particular count. The direction of travel is clear from fifty trades onward.
Edge × Opportunity, Actually Multiplied
The section above names two systems — “a +1R system that fires twice a year and a +0.2R system that fires ten times a week” — says they “are not close,” and leaves the multiplication to the reader. It is worth doing, because the gap is larger than the wording suggests.
The article’s own two systems, multiplied out. Both figures are gross, before the costs the same section warns about.
| System | Per trade | Trades a year | Per year |
|---|---|---|---|
| Rare and large | +1.00R | 2 | +2.00R |
| Small and frequent | +0.20R | 520 | +104.00R |
Fifty-two times as much a year, from the system with a fifth of the per-trade edge. Then comes the catch the section raises and does not price: frequency multiplies costs too. Costs land per trade, so the frequent system pays them 260 times as often. Set the two annual figures equal and the round-trip cost at which the rare system finally catches up is 0.196911R per trade.
That number is the point. It is 98.456% of the frequent system’s entire per-trade edge, which is gone altogether at 0.200R. The rare system only wins inside a band 0.0031R wide — and by the time costs are that high, the system it just beat has essentially stopped working anyway. So the cost objection is real but it does not rescue the rare, large edge: the crossover sits almost exactly on top of the point where the frequent system dies of its own accord. What kills a high-frequency edge is costs eating the edge outright, not costs handing the win to a slower system.
Method and limits, so this can be checked rather than taken on trust. The two systems, their win rates, their average wins and losses, and the “+1R twice a year against +0.2R ten times a week” pairing are all this article’s own, used exactly as it states them; ten trades a week is read as 520 a year. Every expectancy, payoff ratio, profit factor and breakeven win rate was produced by computeExpectancy, the shipped function behind this site’s Trade Expectancy Calculator, called directly and transcribed — including the 72.727% figure the second half turns on. Separate code re-derives every cell and checks this article’s published figures before it reports anything: +$120, −$15, profit factors 2.0 and 0.875, the 25% and 66.667% breakevens, and System 1 as a +0.60R system with 3R winners. All of them recomputed correct. The sampling columns are exact binomial arithmetic — no simulation, no normal approximation, no market data — and they assume what any expectancy figure assumes: independent trades drawn from a distribution that is not changing. Real trades are not perfectly independent and real markets do change, both of which make a short sample less informative than the table shows, not more. Nothing here is a backtest, and none of it is a forecast of any system’s results.
Compute It on Your Own Numbers
Reading about expectancy and internalizing it are different things, which is exactly what the Trade Expectancy Calculator is for. Enter your win rate and your average win and average loss — in dollars or in R — and it returns the expectancy per trade, the profit factor, the breakeven win rate you’d need, and a projected total over however many trades you specify, plus a bar that decomposes each trade’s expectancy into its average winnings and average losses so you can see which side of the ledger dominates. Feed it the two systems from the chart and watch the 90%-winner come back red. The tool carries its own methodology and the same limits described here; like everything on the site it is an educational model, not a forecast, and its output is only as honest as the (cost-inclusive, large-sample) numbers you put in.
Where to Go Next
Expectancy tells you whether a system has an edge. The rest of the Trading Systems cluster tells you where that edge comes from, whether it’s real, and whether you’ll survive long enough to collect it:
- How to Backtest a Trading Strategy the Right Way — the pillar. Where the win rate, average win, and average loss that feed an expectancy come from, and how to measure them without fooling yourself.
- Risk of Ruin: Why a Winning System Can Still Blow Up — a positive expectancy is necessary but not sufficient; this is the math of surviving the losing streaks long enough for the edge to show up.
- Position Sizing Rules for Systematic Traders — expectancy decides if you make money; sizing decides how much and whether a normal drawdown ends you first.
- What Is Overfitting in Backtesting (And How to Avoid It) — the single biggest reason a beautiful backtested expectancy evaporates in live trading.
- Sharpe Ratio Explained — expectancy grades the average trade; Sharpe grades the smoothness of the ride to get there. Two different questions about the same system.
- What Makes a Trading System Robust? A Checklist — where expectancy, drawdown, out-of-sample results, and cost realism all come together into one judgment.
If you want the plain-English, rigor-first read on building and judging trading systems — the honest version, where every metric comes with what it can’t tell you attached — that’s what the newsletter is for. Subscribe below to get the system-builder’s checklist.
Disclaimer: This article is educational content, not financial advice. I am not a licensed financial advisor, and nothing here is a recommendation to buy or sell any security or asset. Investing and trading involve risk, including the possible loss of the money you invest. Do your own research and consider consulting a licensed financial professional before making investment decisions. Read the full Disclaimer.
Historical and backtested results are hypothetical, carry inherent limitations, and do not guarantee future results. Figures were accurate to the best of my knowledge as of this article’s last-updated date and may have changed.
