What Makes a Trading System Robust? A Checklist
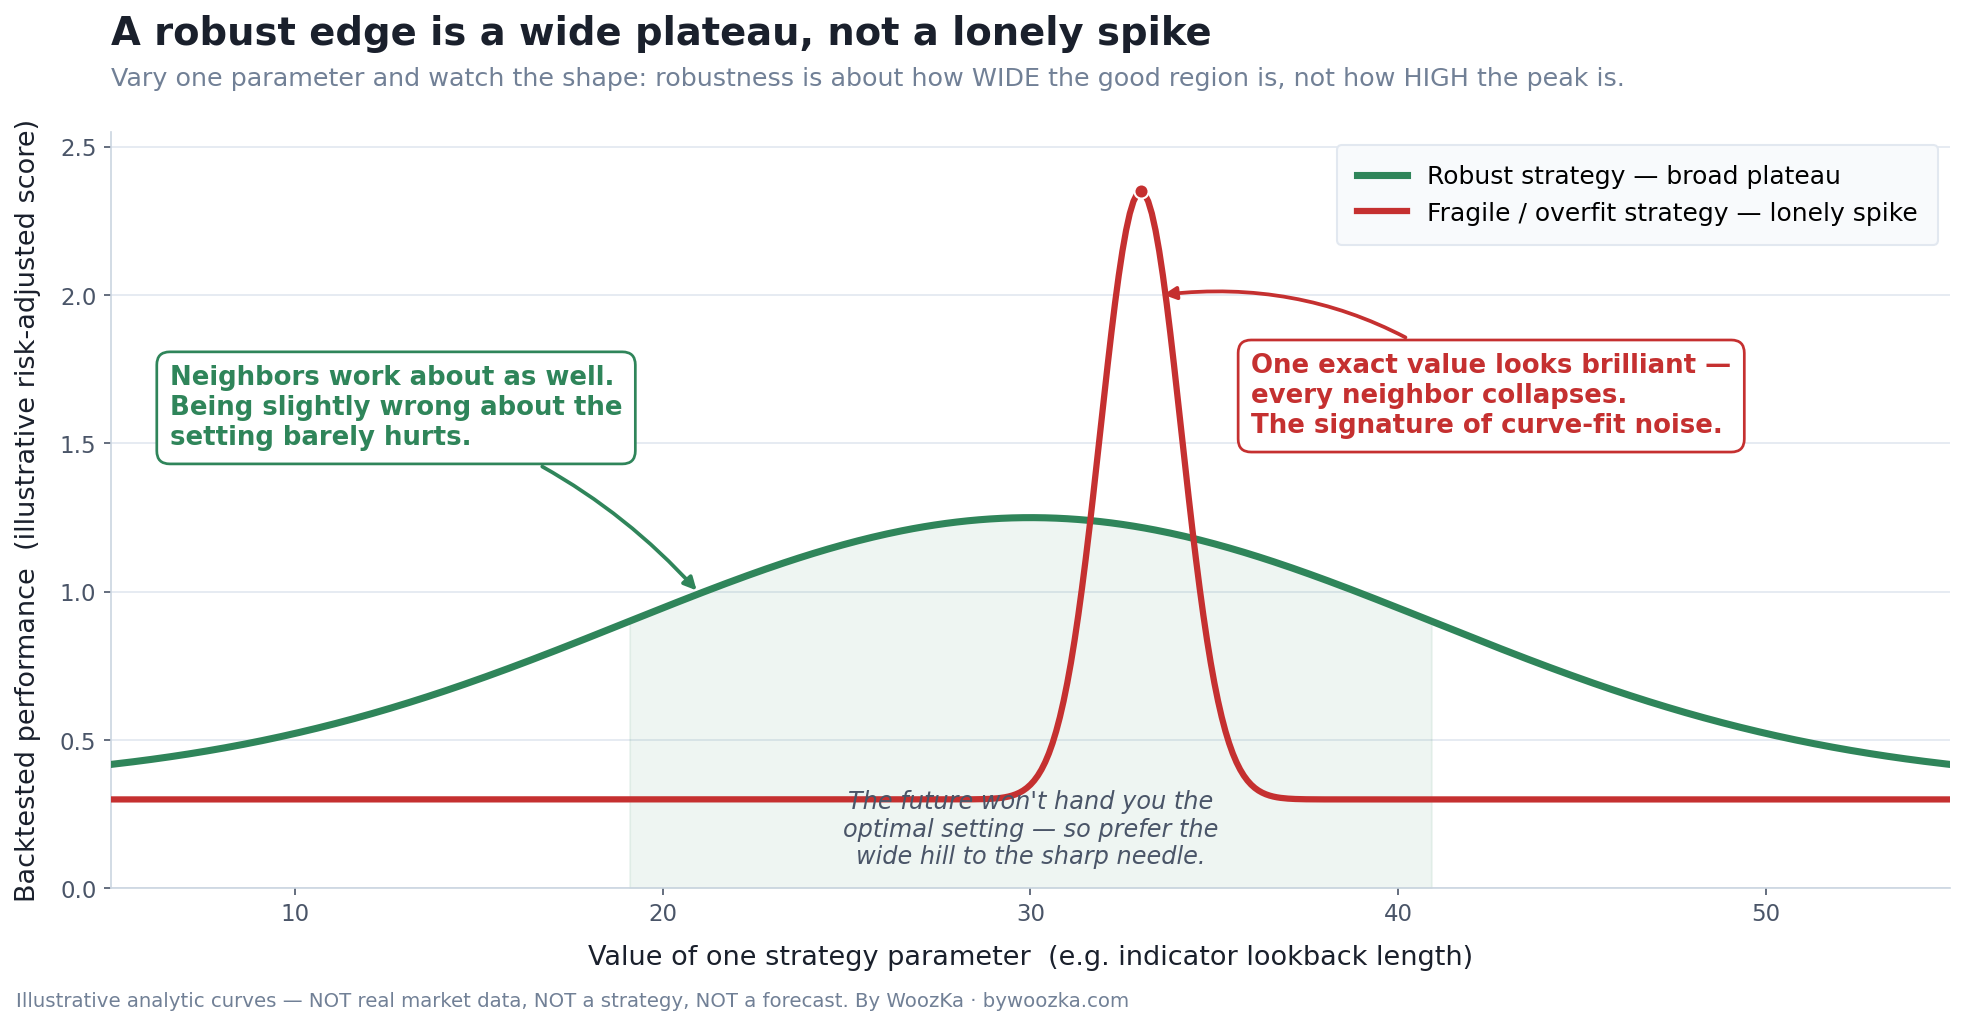
The single most useful robustness picture. Ask not “how high is the peak?” but “how wide is the good region around it?” The green strategy’s edge is spread across a broad band of settings, so a small error in choosing the parameter barely matters. The red strategy’s headline number is a needle balanced on noise — pick a value one notch to either side and it falls apart. A tall lonely spike is not a strong strategy; it is a warning.
Every piece of trading content that wants your attention leads with the same two things: a beautiful upward-sloping equity curve and a big win rate. Both are close to worthless as evidence. An equity curve can be manufactured, and a win rate tells you almost nothing about whether a system is any good. The real question — the one that separates a system you can risk money on from a backtest that will disappoint you the moment real money is behind it — is not “how good did it look?” It is “how likely is that good-looking result to survive conditions it was never tuned on?” That property has a name: robustness. This article is a checklist for interrogating it.
This is a trading-systems article, so the silo’s non-negotiable rule governs every line: past backtest performance does not predict future results. Nothing on this checklist can promise you a strategy will make money. The most a robustness review can ever do is lower the odds that you are fooling yourself — it filters out the strategies that are obviously fragile, curve-fit, or lucky. Passing every item below does not certify a system. It only means the system has failed to disqualify itself, which is a much weaker and much more honest thing.
Robustness Is a Question, Not a Score
Before the checklist, the single most important idea in it. It is tempting to imagine robustness as a number — add up the checks, and a system that scores 8 out of 8 is “validated.” Resist that completely. There is no scoring formula here, and building one would recreate the exact error the whole discipline exists to prevent. A checklist that outputs a pass/fail grade invites you to treat a passing system as proven to work, when the only honest interpretation is that it has not yet been caught failing.
The distinction is not pedantic. A robustness review is a series of filters, each one designed to reject a specific way a strategy can look good without being good — luck, overfitting, a single friendly market, unrealistic costs. Clearing a filter removes one explanation for the strategy’s performance; it never adds a guarantee. A system can clear all eight questions below and still lose money out of sample, because the future can serve up a regime none of your tests contained. So read the checklist the way a skeptical scientist reads their own experiment: not “how do I confirm this works?” but “what are all the ways this could be fooling me, and have I ruled each one out?” The questions are phrased as questions on purpose. They are prompts for suspicion, not boxes that, once ticked, hand you a working machine.
The Checklist
1. How many things did you try before you landed on this one?
This is the most important question on the list and the one almost nobody reports honestly — including to themselves. If you test enough variations, a spectacular backtest becomes a near-certainty from luck alone, with no real edge involved. This is not a hand-wave; it has been formalized. Bailey, Borwein, López de Prado, and Zhu showed in a widely cited 2014 paper that high simulated performance is easy to manufacture after testing only a relatively small number of alternative configurations, and that the more configurations you try, the higher the probability your winning backtest is overfit — under realistic conditions, an overfit strategy can even carry negative expected out-of-sample returns [source: Bailey, Borwein, López de Prado & Zhu, “Pseudo-Mathematics and Financial Charlatanism: The Effects of Backtest Overfitting on Out-of-Sample Performance,” Notices of the American Mathematical Society, 61(5): 458–471, May 2014]. Harvey and Liu make the same point from the statistics of multiple testing: a Sharpe ratio discovered after searching hundreds of candidates must be discounted — “haircut” — for the number of trials, and the marginal discoveries get penalized most heavily [source: Campbell R. Harvey & Yan Liu, “Backtesting,” Journal of Portfolio Management, 42(1), Fall 2015].
The practical trouble is that the number of trials is usually invisible. When someone shows you a backtest — or when you show yourself one — you rarely record how many indicators, thresholds, and holding periods were tried and discarded before the pretty one emerged. So the honest defense is to try fewer things, write down how many you tried, and be deeply suspicious of any result that only appeared after a long search. A strategy plucked from a thousand is a lottery winner, not a discovery.
2. Did it survive data it never saw?
A backtest run over the same history you used to design and tune the strategy is a memory test, not a prediction test — of course the strategy “works” on the data it was shaped to fit. The only performance that means anything is performance on data the strategy never touched while it was being built. The minimum bar is a clean out-of-sample holdout: reserve a slice of history, do all your designing and tuning on the rest, and look at the holdout exactly once, at the end. If the edge evaporates on the unseen slice, it was never an edge.
The stronger version is walk-forward analysis, popularized in systematic trading by Robert Pardo: optimize on one window of history, test on the next unseen window, then roll both windows forward and repeat, stitching the out-of-sample segments into a composite equity curve that reflects how the strategy would have adapted through changing conditions [source: Robert Pardo, The Evaluation and Optimization of Trading Strategies, 2nd ed., Wiley, 2008]. The question to ask of any system is simple and unforgiving: which numbers here come from data the strategy had already seen, and which come from data it hadn’t? Trust only the second kind. (This is developed in full in the backtesting pillar and in why most systems fail out-of-sample.)
3. Does it sit on a parameter plateau, not a spike?
Every strategy has knobs — a lookback length, a threshold, a stop distance. Take one of those knobs and vary it slightly in both directions, holding everything else fixed, and look at what happens to performance. There are two possible shapes, and they are the two curves in the chart at the top of this article.
A robust strategy sits on a plateau: the neighboring parameter values work about as well as the chosen one. Being slightly wrong about the setting costs you little, which is exactly what you want, because the future will not hand you the optimal setting. A fragile strategy sits on a spike: one exact value looks brilliant and every neighbor collapses. That lonely peak is the fingerprint of a parameter tuned to the noise of your specific sample rather than to any durable feature of the market — and noise does not repeat, so the spike does not survive contact with new data. Prefer the broad hill to the sharp needle, even when the needle’s headline number is higher. Pardo’s own first line of defense is blunt: the good region should be wide, and a result that lives or dies on one precise setting should be treated as overfit until proven otherwise.
4. Does it use as few parameters as possible?
Every additional parameter is another degree of freedom — another dial you can twist to make the past look better without making the future any more predictable. A strategy with a dozen conditions, filters, and exceptions has so many ways to contort itself around historical data that a gorgeous backtest tells you almost nothing; there were simply too many ways to fit the noise. Pardo’s guidance, echoed across the literature, is to keep the number of optimizable parameters to a minimum. A simple rule with two parameters that holds up out of sample is far more trustworthy than an elaborate one with fifteen that holds up in sample — because the simple one had far fewer opportunities to cheat. When two systems perform similarly, the one with fewer moving parts is the more robust, every time.
5. Does the edge show up across different markets and regimes?
A strategy that works only on one instrument, over one stretch of history, is a candidate for having been fit to that instrument and that stretch. Real edges tend to be at least somewhat general: a trend-following idea that captured trends in currencies should show some life in commodities and index futures too; a mean-reversion idea should behave sensibly across several range-bound markets, not just the one you developed it on. Just as important is testing across regimes — bull markets, bear markets, high-volatility panics, quiet drifts. A system that only ever saw a decade-long bull market has never been asked the one question that matters most: what does it do when conditions change? Mean reversion and trend following win in opposite regimes, so a system that “works” only because it was tested entirely inside its favorable regime is a fragile system wearing a robust costume. Ask: has this edge been shown anywhere other than the exact place it was born?
6. Did it survive realistic costs and slippage?
A backtest run at zero commissions, zero spread, zero slippage, and perfect fills is a work of fiction, and the faster a strategy trades the more damaging that fiction is. Every real trade pays the spread, pays commission, and gets filled at a slightly worse price than the one on the screen — and those frictions come out of the thinnest part of the return, the edge itself. A strategy that shows a comfortable profit before costs can be a net loser after them; this is one of the most common ways a “profitable” system quietly isn’t. The question is direct: does the edge still exist after subtracting realistic execution costs — and does it survive costs a bit worse than you assumed? Model costs pessimistically, not optimistically. A strategy whose entire edge is consumed by a slightly-wider-than-expected spread was never robust; it was borrowing from the execution assumptions to look good.
7. Is there enough sample — a real number of trades?
A backtest that produced its return from eight trades has told you essentially nothing, no matter how good those eight trades look. With a tiny sample, the outcome is dominated by luck — a couple of fortunate entries can create an equity curve indistinguishable from skill. Robustness needs statistical weight: enough independent trades, across enough different conditions, that the result is unlikely to be a fluke. Be especially wary of the strategy whose entire performance rests on catching one or two enormous historical moves; remove those two trades and the edge often vanishes, which means you weren’t testing a system, you were testing whether those two specific events recur. Ask: how many trades is this conclusion built on, and does the edge hold up if the biggest few are removed? A durable edge shows up as a pattern across many trades, not as a monument to a handful of them.
8. Is there a logical reason this should work?
This is the anchor that keeps all the others honest. Before trusting any edge, you should be able to state, in plain language, why it exists — what durable feature of markets or human behavior it exploits. Trend following has a behavioral and structural story (investors underreact then overreact; risk is transferred over time). Value and mean reversion have an overreaction story. If you cannot articulate a reason beyond “the backtest says so,” you should assume you have found a coincidence in historical data rather than a mechanism that will persist. Data-mined patterns with no economic rationale are exactly what an unconstrained search produces — statistically inevitable and practically worthless. The rationale requirement is what stops question 1’s search from handing you a beautiful accident: a robust edge has a reason, stated before the backtest is trusted, not invented afterward to explain a number you liked.
Reading the Whole Card Together
No single question on this list is sufficient, and none is meant to be scored. They are eight independent filters, each rejecting a different disguise that a bad strategy can wear — the lucky search (1), the memorized past (2), the tuned-to-noise spike (3), the over-jointed contraption (4), the one-regime wonder (5), the frictionless fantasy (6), the tiny sample (7), and the reasonless coincidence (8). The two headline risk metrics slot straight into this frame rather than sitting outside it: a system’s drawdown tells you whether you could actually survive holding it, and its Sharpe ratio tells you its return per unit of volatility — but both are themselves backtested statistics estimated on the past, so each must be run back through questions 1, 2, and 3. A dazzling Sharpe discovered after a thousand trials, measured only in sample, is precisely the mirage this checklist exists to catch. That is why the Sharpe ratio’s own inventors and successors built a “Deflated Sharpe Ratio” to discount it for the number of strategies tried [source: Bailey & López de Prado, “The Deflated Sharpe Ratio,” Journal of Portfolio Management, 40(5), 2014].
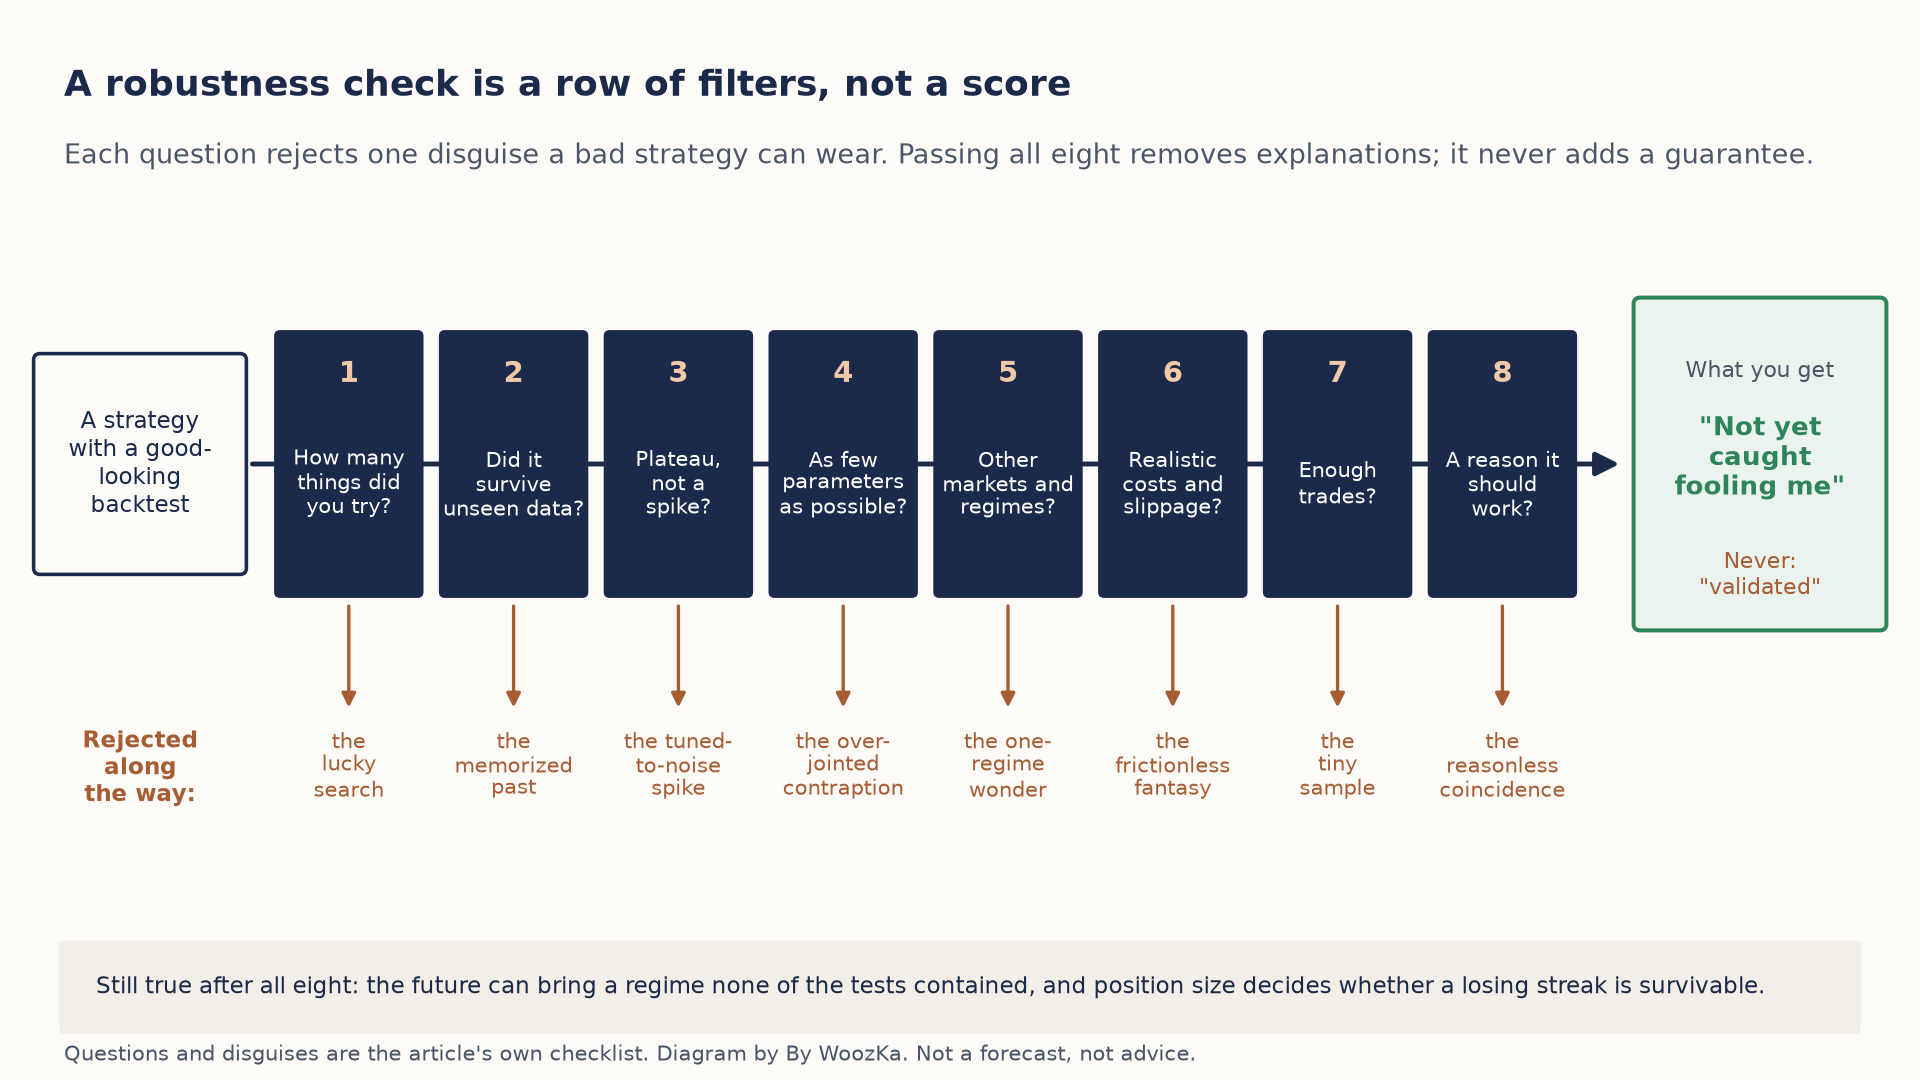
Each question removes one explanation for a good-looking backtest, and none of them adds a guarantee: a system that clears all eight has not been caught fooling you, which is not the same as being validated.
So the correct output of a full review is never “this system scores well, therefore it works.” It is: “this system has cleared each of the filters I know how to apply, so I have not caught it fooling me — and I will size it as though the real worst case is still worse than anything I have seen.” That posture — treating a clean review as the absence of disqualification rather than the presence of a guarantee — is the whole difference between a system builder and a backtest tourist.
What a “Passing” System Still Can’t Promise You
Even a strategy that clears all eight questions carries every one of the silo’s permanent caveats, and it is worth stating them plainly so the checklist is never mistaken for a certification. Its backtested edge is a description of the past, not a forecast of the future; markets change, edges decay as others discover them, and the regime that breaks your strategy may simply not exist yet in any data you could have tested. Its worst historical drawdown is a floor, not a ceiling — plan for a deeper one. Its win rate, however comforting, is still not its edge; expectancy — the average result per trade, folding in the size of wins and losses — is the quantity that matters, and a high hit rate can hide a fragile payoff profile. And the single most decided factor in whether you actually collect a real edge is not on this list at all: it is how much you risk per trade, which determines whether the inevitable losing streak is a survivable dip or the end of the account.
In other words, robustness testing is necessary and it is not sufficient. It is the discipline that keeps you from betting on mirages. What it can never do is turn a historical statistic into a promise — and any content that tells you a checklist “validates” a strategy is selling you the exact overconfidence this one is built to remove.
If you have never watched a “validated” system underperform its backtest live, the common shape of the experience is worth sitting with. A strategy clears your review — decent out-of-sample numbers, a plausible story, costs modeled in — and you fund it. For a while it tracks the backtest, and then it doesn’t: a stretch of conditions your history happened not to contain arrives, the edge thins, and you are left staring at the same account every day wondering whether the strategy broke or whether this is just the drawdown you were warned about. The builders who come through that intact are rarely the ones whose review was most thorough. They are the ones who treated even a clean review as provisional — who sized the position small enough that being wrong about the strategy was survivable, and who kept asking the eight questions of the live results, not just the backtest. Robustness is not a verdict you reach once. It is a suspicion you maintain.
The Articles This Checklist Draws On
This checklist is the synthesis piece of the Trading Systems cluster — it pulls the individual metrics and methods into one judgment. The articles it draws on:
- How to Backtest a Trading Strategy the Right Way — the pillar. How to produce the honest backtest this checklist then interrogates.
- Drawdown Explained: The Metric That Matters More Than Win Rate — the risk metric that decides whether you can actually hold a system through its bad years.
- Sharpe Ratio Explained — return per unit of volatility, and its own well-documented blind spots — itself a backtested statistic to be run back through questions 1–3.
- What Is Overfitting in Backtesting (And How to Avoid It) — the deep dive on question 1: why searching hard enough guarantees a great-looking backtest.
- Position Sizing Rules for Systematic Traders — the lever that decides whether a real edge survives its losing streaks; the thing no robustness check can substitute for.
- Mean Reversion vs Trend Following: Which Strategy Style Fits You? — why “works across regimes” (question 5) is so demanding: the two families of edge win in opposite conditions.
- Why Most Trading Systems Fail Out-of-Sample — the failure mode questions 1 through 3 are built to prevent.
If you want the plain-English, rigor-first read on building and judging trading systems — the honest version, where every check comes with what it still can’t tell you attached — that is what the newsletter is for. Subscribe below to get the system-builder’s checklist.
Disclaimer: This article is educational content, not financial advice. I am not a licensed financial advisor, and nothing here is a recommendation to buy or sell any security or asset. Investing and trading involve risk, including the possible loss of the money you invest. Do your own research and consider consulting a licensed financial professional before making investment decisions. Read the full Disclaimer.
Historical and backtested results are hypothetical, carry inherent limitations, and do not guarantee future results. Figures were accurate to the best of my knowledge as of this article’s last-updated date and may have changed.
