Why Interest Rates Move Markets: A Beginner’s Guide to the Fed
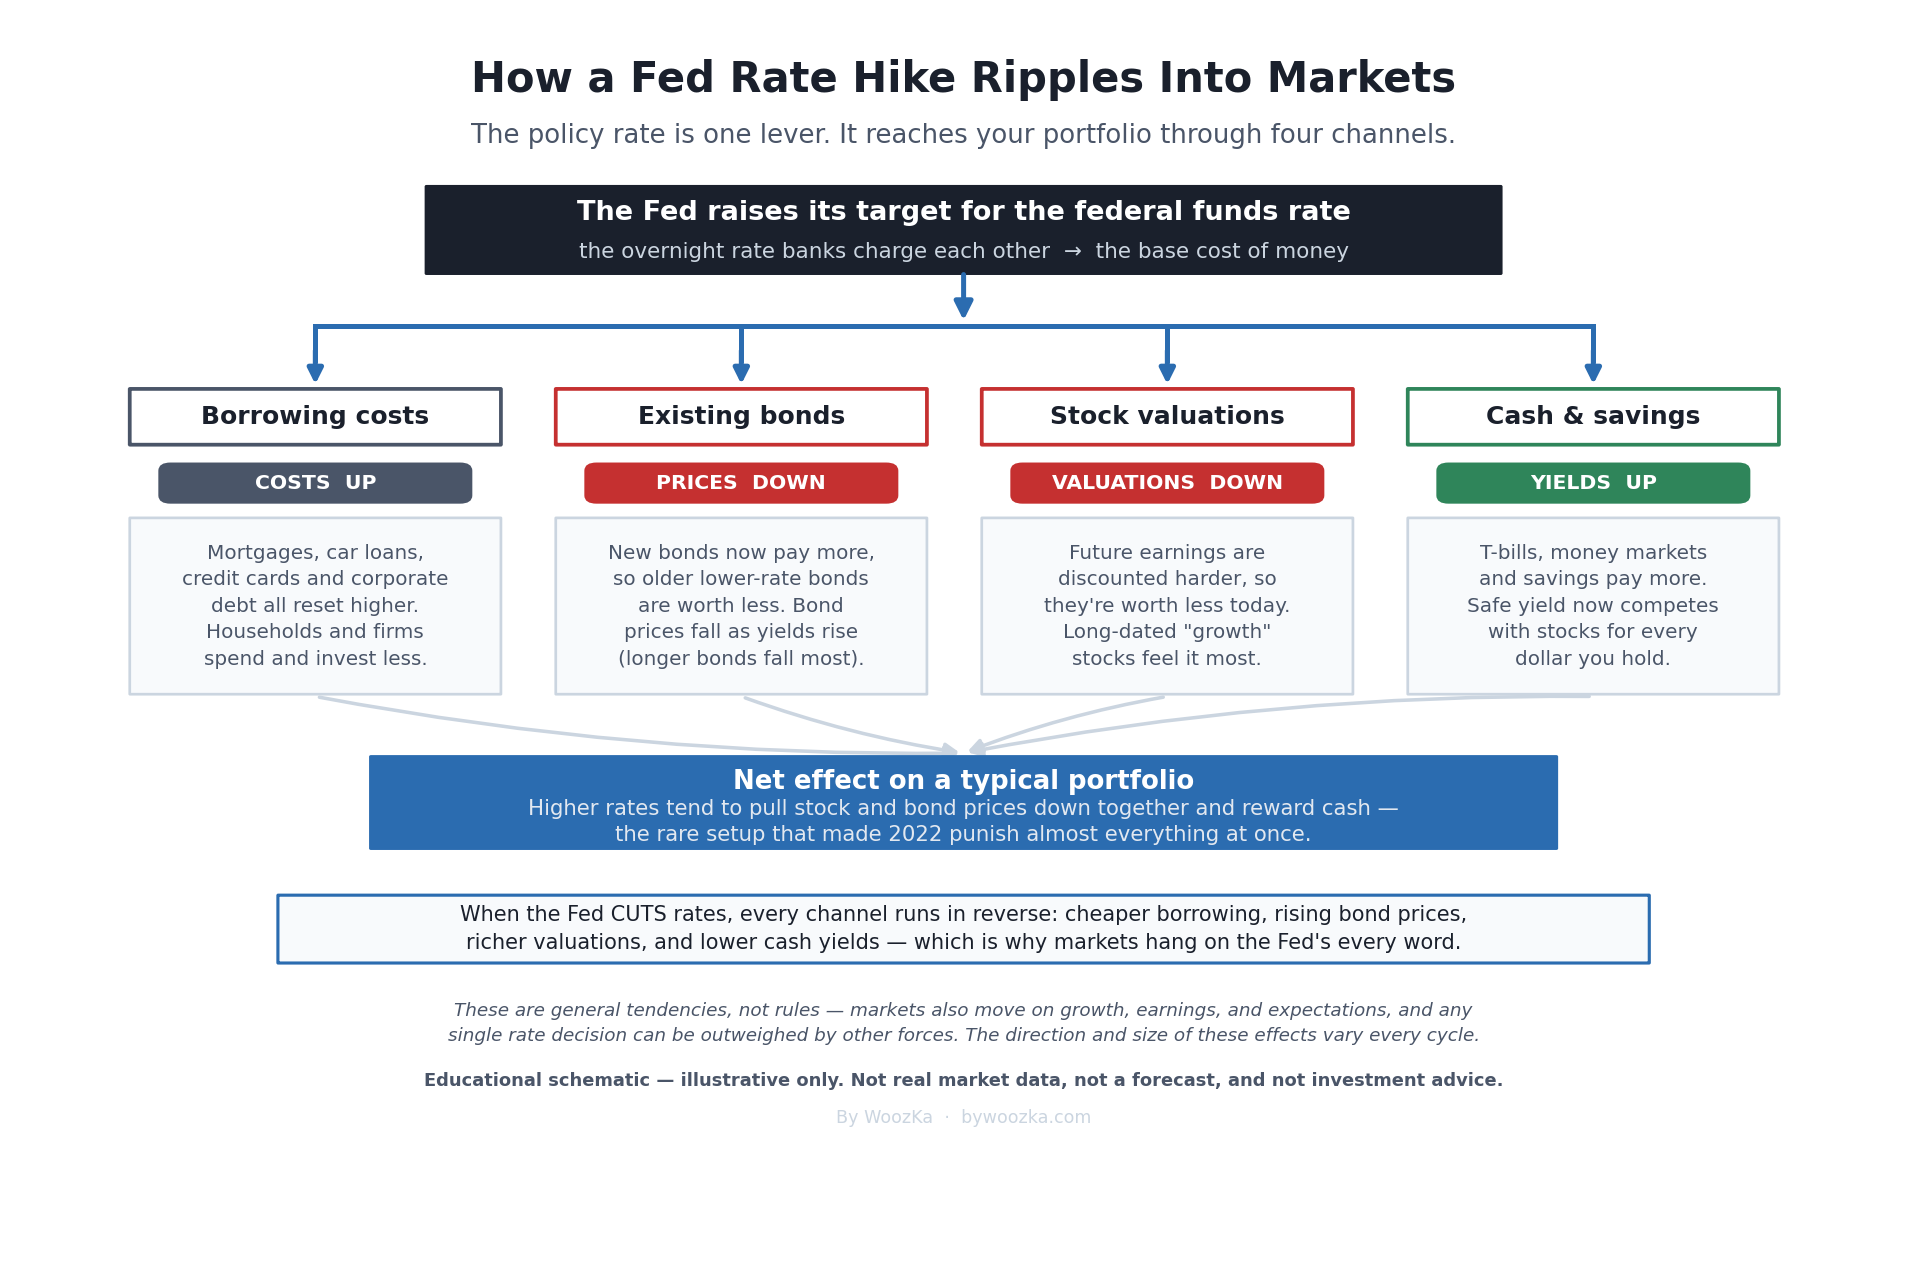 One rate, four channels. The Federal Reserve sets a single short-term interest rate, and it ripples out to almost everything you own. This is an educational schematic to make the mechanism concrete — not real market data, not a forecast, and not investment advice.
Every few weeks, a committee in Washington announces a decision about one interest rate, and within seconds stock and bond markets around the world lurch in response. To a beginner it can look like superstition — why should a quarter-point change to some obscure bank rate decide whether your retirement account is green or red today? But the link is real and, once you see the plumbing, surprisingly logical. This article walks through why interest rates move markets, in plain English, without pretending anyone can tell you what the Fed will do next or what markets will do about it.
The one-sentence version: interest rates are the price of money, and when the price of money changes, the value of nearly everything priced in money changes with it. The rest of this piece unpacks that sentence into the specific channels — and, just as important, marks where the honest explanation stops and guesswork would begin. If you want the bigger system these ideas sit inside, this is a companion to the section’s foundation, The Economic Machine Explained.
What the Fed Actually Controls
Start with a common misconception: the Federal Reserve does not “set” mortgage rates, credit-card rates, or the rate on your savings account directly. What it controls is one specific lever — the target range for the federal funds rate, which is the interest rate banks charge each other to borrow reserve balances overnight, on an unsecured basis [source: Federal Reserve, “Monetary Policy: What Are Its Goals? How Does It Work?”; Federal Reserve Bank of New York, “Monetary Policy Implementation”]. That’s it. The FOMC has stated that adjusting this target range is now its primary way of changing the stance of monetary policy [source: Federal Reserve, monetary-policy goals & tools].
The federal funds rate is set as a range, not a single number. As of its meeting on June 17, 2026, the Federal Open Market Committee held that target range at 3.50% to 3.75% [source: Federal Reserve, FOMC statement, June 17, 2026]. (Rates move — always confirm the current range at federalreserve.gov before relying on it; the mechanism in this article is what lasts, not the specific figure.)
Here’s why one overnight bank rate matters so much: it’s the foundation the entire structure of interest rates is built on. The rate banks pay to borrow from each other feeds into the rate they charge you for a car loan or mortgage, the yield a new bond has to offer to attract buyers, and the return you can earn just parking cash in a money-market fund. Move the base, and every rate stacked on top of it tends to shift. That’s the sense in which the federal funds rate is the “base cost of money” — the price against which every other financial decision is measured.
Why the Fed Moves Rates at All
The Fed doesn’t change rates to please or punish the stock market. Congress gave it a dual mandate: to pursue maximum employment and stable prices [source: Federal Reserve, “What economic goals does the Federal Reserve seek to achieve through its monetary policy?”]. For the price-stability half, the FOMC judges that 2% inflation over the longer run (measured by the PCE price index) is most consistent with its goal [source: Federal Reserve, monetary-policy goals].
The transmission from that mandate to your portfolio runs through spending. When the Fed raises rates, borrowing gets more expensive and saving gets more rewarding, so households and businesses tend to spend and invest a little less and save a little more; weaker demand puts downward pressure on prices, which is the point when inflation is running hot [source: Federal Reserve, monetary-policy goals]. When it cuts rates, the same machine runs in reverse — cheaper borrowing, more spending and investment, and upward pressure on prices and hiring. So a rate decision is really a decision about how hard to press the brake or the gas on the whole economy. Markets react because they are trying to price what that pressure will do to future profits, borrowing costs, and the appeal of safe alternatives.
The Four Channels: How One Rate Reaches Your Portfolio
The schematic at the top of this article lays out the four main paths from the Fed’s lever to the value of what you own. Walk through them one at a time.
1. Borrowing costs
This is the most intuitive channel. When the base rate rises, the interest on mortgages, car loans, credit cards, and — crucially for markets — corporate debt rises too. Companies fund expansion, buybacks, and day-to-day operations partly with borrowed money; when that money costs more, some projects that made sense at 3% no longer make sense at 6%. Higher financing costs shave expected profits and slow the pace of investment, which is a headwind for the businesses whose shares you own. The reverse is a tailwind: cheaper credit tends to loosen the purse strings across the economy.
2. Bond prices move opposite to rates
This is the channel that surprises beginners most, because it feels backwards. A bond pays a fixed coupon. When market interest rates rise, newly issued bonds come with higher coupons, which makes the older, lower-coupon bonds already in your portfolio less attractive — so their market price falls until their effective yield matches the new landscape. When rates fall, existing higher-coupon bonds become more valuable and their prices rise. The SEC states the rule plainly: “market interest rates and bond prices generally move in opposite directions,” a phenomenon it calls interest rate risk [source: U.S. Securities and Exchange Commission, Investor Bulletin, “Fixed Income Investments — When Interest Rates Go Up, Prices of Fixed-Rate Bonds Fall,” investor.gov]. And the longer a bond’s maturity, the more its price can swing when rates move [source: same SEC bulletin]. So “safe” bonds are not immune to rate changes — a long-term bond fund can drop meaningfully in a rising-rate year even though it never misses a payment.
3. Stock valuations and the discount-rate effect
Stocks feel interest rates through a subtler mechanism, and it’s the key to understanding why a rate change can move share prices even when a company’s business hasn’t changed at all. A share is worth the value today of all the cash the company is expected to generate in the future. To convert future dollars into today’s dollars, investors apply a discount rate — and that discount rate rises and falls with interest rates. When rates go up, the discount rate goes up, and the present value of those future earnings goes down [source: standard discounted-cash-flow valuation; see e.g. Nasdaq, “How Do Rising Interest Rates Affect the Stock Market?”].
A tiny arithmetic example makes it concrete. Suppose a company will pay you $100 exactly one year from now. Discount that at 2% and it’s worth about $98.04 today ($100 ÷ 1.02); discount the same $100 at 5% and it’s worth only about $95.24 ($100 ÷ 1.05). Nothing about the $100 changed — only the rate used to value it — yet the price you’d pay today fell. Now stretch that logic over a decade of future earnings and you can see why higher rates compress valuations across the market.
This also explains a pattern you’ll hear about constantly: growth stocks tend to be hit harder by rising rates. Their value leans heavily on cash flows in the distant future, which get discounted the most, so they are more sensitive to the discount rate than steady businesses whose cash arrives soon [source: Nasdaq, “How Do Rising Interest Rates Affect the Stock Market?”]. It isn’t that rate hikes single out growth companies out of spite — it’s just the math of discounting far-off money more heavily.
4. Cash and safe yields start to compete
The final channel is the quietest and often the most powerful. When rates are near zero, holding cash earns you almost nothing, so investors are pushed toward stocks and other risk assets in search of any return. When rates are high, that changes: Treasury bills, money-market funds, and savings accounts start paying a meaningful yield again. Suddenly a saver can earn a solid return with far less volatility, and that safe yield competes with stocks for every dollar. Higher rates don’t just make future earnings worth less — they also raise the bar every risky investment has to clear to be worth the risk.
The 2022 Case Study: When Every Channel Fired at Once
The four channels are usually abstract, but 2022 turned them into a live demonstration — and it’s the cleanest real-world illustration available, so it’s worth studying (as history, not as a template for what comes next).
Inflation had surged, with the Consumer Price Index peaking at a year-over-year rate of 9.1% in June 2022, the highest in about four decades [source: U.S. Bureau of Labor Statistics, Consumer Price Index]. To fight it, the Fed embarked on one of the fastest tightening campaigns in its history: 11 rate increases between March 2022 and July 2023, lifting the target range from near zero (0–0.25%) up to 5.25%–5.50% [source: Federal Reserve FOMC decisions, March 2022–July 2023]. Every channel above fired in the same direction at the same time. Borrowing costs jumped, bond prices fell as yields climbed, the discount rate on future earnings rose, and cash yields became genuinely competitive for the first time in years.
The result was rare and painful for diversified investors: both stocks and bonds fell together. The S&P 500 finished 2022 down about 19.4%, and the Bloomberg U.S. Aggregate — the broad benchmark for the American bond market — fell roughly 13%, its worst calendar year on record [source: reporting on 2022 market returns — CNBC, “2022 was the worst-ever year for U.S. bonds”; A Wealth of Common Sense; Callan]. The classic cushion of “when stocks fall, bonds rise” largely failed, because the same force — rapidly rising rates — was pushing down on both at once. That is the “net effect” box in the diagram, made real.
One honest caveat, and it matters: 2022 is an illustration of the mechanism, not a prediction that rising rates always produce that outcome. Plenty of rate-hiking cycles have coincided with rising stock prices, because other forces — strong earnings, economic growth, or simply the fact that the hikes were already expected — outweighed the rate drag. The channels describe tendencies and pressures, not guarantees.
The Stretch This Article Promises, Actually Done
Channel 3 works one example — $100 a year out, discounted at 2% and at 5% — and then says to stretch that logic over a decade of future earnings. It never stretches it. Channel 3 also asserts that growth stocks are hit harder because their cash arrives later, which is arithmetic, and leaves it as an assertion. Both are done below, using nothing but the numbers already on this page: the $100, the 2% and 5% pair, the 2022 target range, and the S&P 500’s own 2022 return. The growth factors behind every cell were produced by the shipped code behind this site’s Compound Growth Calculator, and separate code re-derives all of it.
A Decade of It, and Then Some
The one-year example above costs $2.80 of a $100 payment. Push the same payment further out and the two discount rates compound apart from each other.
| Cash arrives in | Worth today at 2% | Worth today at 5% | Share lost |
|---|---|---|---|
| 1 year | $98.04 | $95.24 | 2.86% |
| 3 years | $94.23 | $86.38 | 8.33% |
| 5 years | $90.57 | $78.35 | 13.49% |
| 10 years | $82.03 | $61.39 | 25.16% |
| 20 years | $67.30 | $37.69 | 44.00% |
| 30 years | $55.21 | $23.14 | 58.09% |
So the decade the section asks you to imagine is worth 25.16% — a quarter of the value gone with the business untouched, against 2.86% at one year. One thing about that column is worth saying plainly, because it is what makes the mechanism general rather than an example: the $100 cancels out. The share lost is one minus (1.02 ÷ 1.05) raised to the number of years, and no cash amount appears in it anywhere, so the percentages above are identical for a $100 payment and for a company earning billions. That is the difference between an illustration and a rule, and this one is a rule.
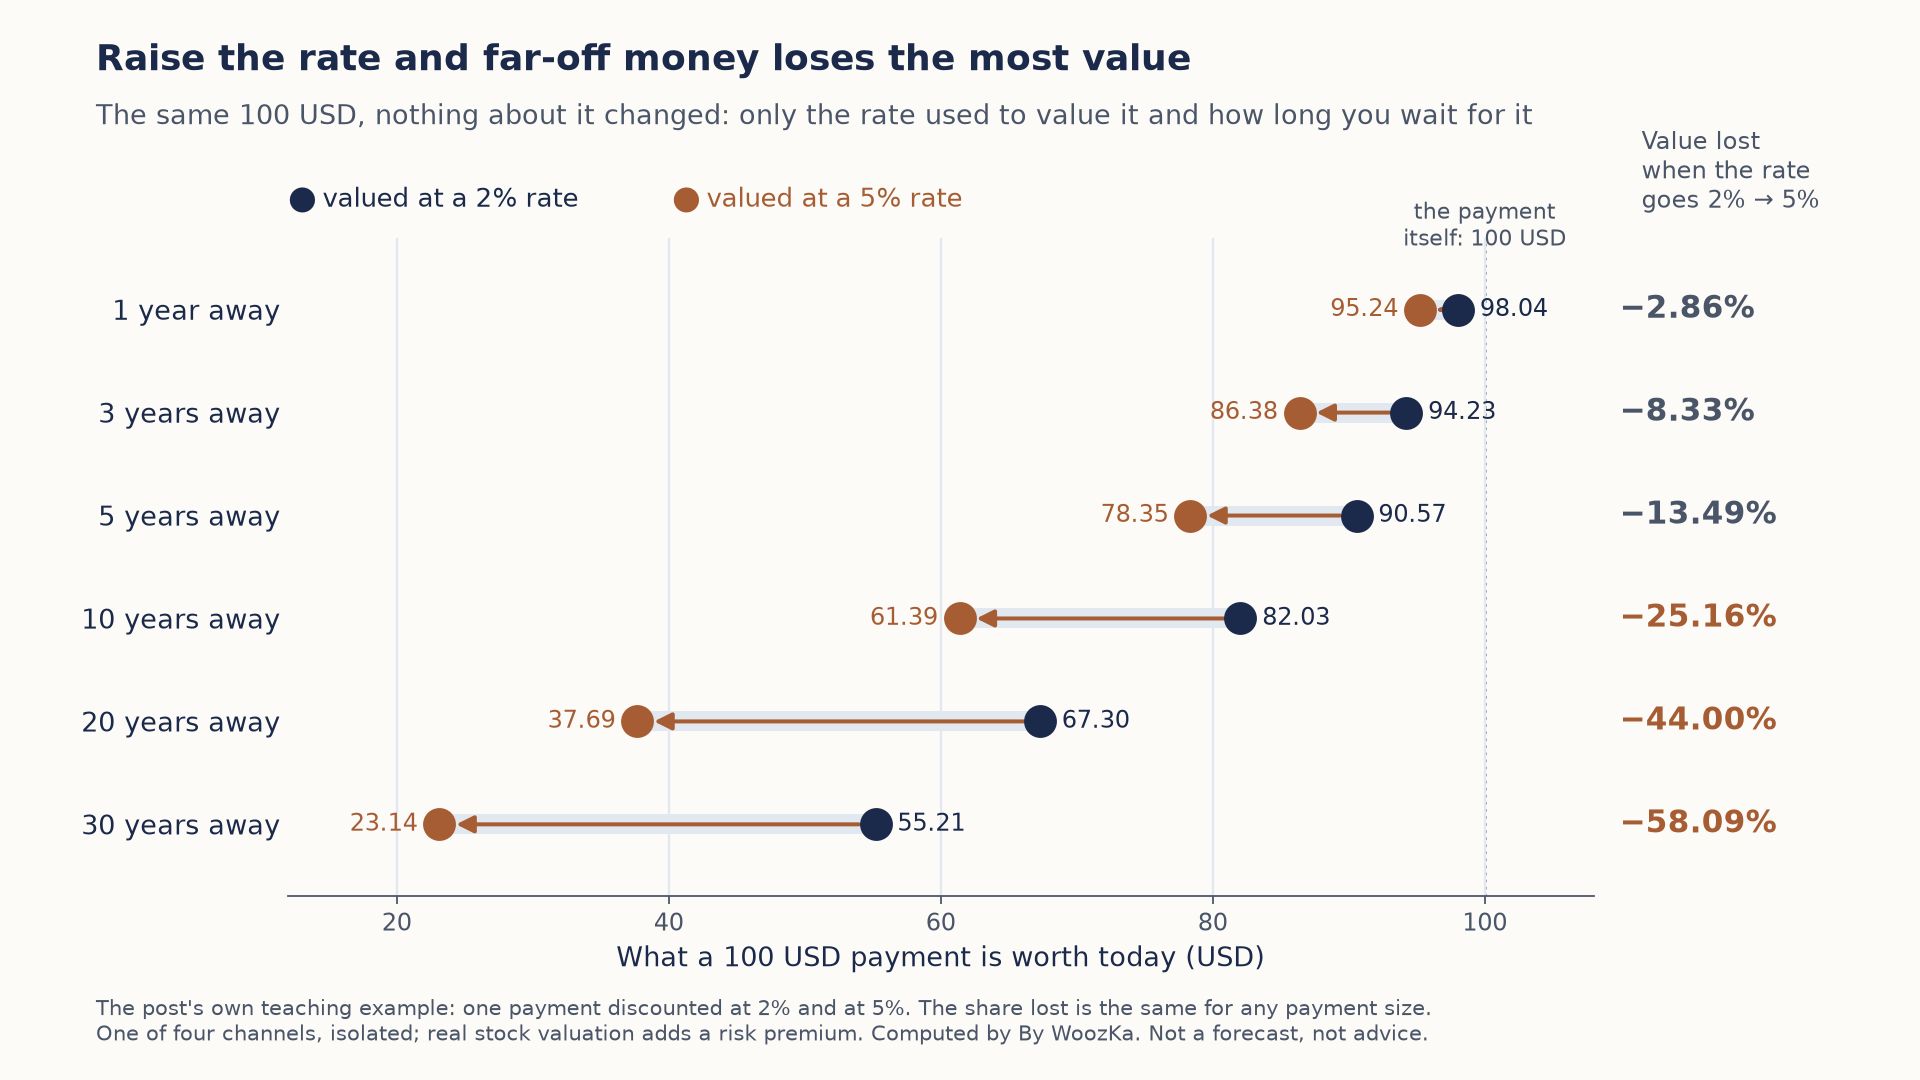 Nothing about the payment changes; only the rate and the wait do. A one-year payment loses 2.86% when the rate goes from 2% to 5%, a ten-year payment loses a quarter of its value, and a thirty-year payment loses more than half.
The Illustration Is Gentler Than This Article’s Own Case Study
The 2%-to-5% pair is a teaching example. The move the 2022 section describes is larger: the target range midpoint went from 0.125% to 5.375%. Run the identical arithmetic on it.
| Cash arrives in | Lost, 2% → 5% | Lost, 0.125% → 5.375% | Ratio |
|---|---|---|---|
| 1 year | 2.86% | 4.98% | 1.74× |
| 3 years | 8.33% | 14.21% | 1.71× |
| 5 years | 13.49% | 22.55% | 1.67× |
| 10 years | 25.16% | 40.01% | 1.59× |
| 20 years | 44.00% | 64.02% | 1.46× |
| 30 years | 58.09% | 78.42% | 1.35× |
The example understates this article’s own case study by between a third and three-quarters, depending on horizon. There is also an inversion available, and it is the sharpest number here. Ask which horizon makes this one channel produce exactly the S&P 500’s published 2022 fall of 19.4%, and the answer is 4.22 years. That is not a valuation of the index and not a claim about what 2022 was; it is the honest scale check the section invites. Take the discount channel literally, on this article’s own rate move, and it accounts for the whole of the year’s decline only if the market’s cash flows sit about four years out on average. Everything beyond four years’ worth of the channel had to be offset by the other three channels, by earnings, or by the fact that the hikes were partly expected — which is the point the caveat paragraph makes in words.
Where “Hit Harder” Stops Getting Harder
The growth-stock claim is true and it has a shape. At ten years the hit is 8.81 times the one-year hit, not ten times; at thirty it is 20.33 times, not thirty. The effect grows with distance and it decelerates while doing it.
| Decade | Lost by the start | Lost by the end | Points added |
|---|---|---|---|
| Years 0–10 | 0.00% | 25.16% | 25.16 |
| Years 10–20 | 25.16% | 44.00% | 18.83 |
| Years 20–30 | 44.00% | 58.09% | 14.09 |
The first decade of waiting costs 25.16 points; the third costs 14.09, about 56% of it. Present value cannot fall below zero, so each further decade has less left to take. The practical reading is that the gap the phrase “growth stocks” is pointing at opens up early — most of it is already there by the ten-year mark — and that two businesses whose cash sits twenty and thirty years out differ by less than two whose cash sits at the start and end of the first decade. Distance matters, and it matters at a diminishing rate.
Discount-rate arithmetic, its inputs, and the assumptions it rests on. Every input above is a figure this article already publishes — the $100, the 2% and 5% discount rates, the 0–0.25% and 5.25%–5.50% target ranges, and the S&P 500’s roughly 19.4% 2022 decline — and that code checks this article’s own $98.04 and $95.24 before it reports anything else. Both recomputed correct. The twenty-four growth factors behind the tables came from the shipped computeCompound, called on the calculator page linked above and transcribed; the script reproduces each of them to fifteen decimal places, and the invariance to cash size was checked across four amounts and three horizons rather than argued. The limits are real and they are large. This is one channel of the four, isolated on purpose: it holds the cash flows fixed, so nothing here says what higher rates do to earnings, which is channel 1’s subject. The federal funds rate is not the rate an investor discounts equities at — a real discount rate adds a risk premium that moves on its own — so applying the target-range move directly is this article’s own simplification carried through to its arithmetic, and it gives the size of the channel taken literally rather than a valuation. A single dated cash flow is not a company; real cash arrives across many years at once, and the 4.22-year figure is an average horizon implied by that simplification, not a measurement of anything. Bond price sensitivity has its own arithmetic and belongs to the bond article this site already publishes; it is deliberately not repeated here. Nothing above forecasts a rate, a return or a market direction, and nothing above recommends buying, selling or holding anything.
Where the Honest Explanation Stops
Understanding the channels is genuinely useful. Believing the channels let you predict markets is where beginners get hurt, so here are the limits, stated plainly.
Markets are forward-looking. Prices don’t just reflect today’s rate — they reflect what investors expect the Fed to do next. By the time a rate change is announced, much of it is often already baked into prices. That’s why markets sometimes rise on a rate hike (if it was smaller than feared) or fall on a cut (if investors wanted more). The surprise relative to expectations frequently matters more than the move itself, which is exactly why “the Fed raised rates, so stocks should fall today” so often turns out wrong.
“Don’t fight the Fed” is an adage, not a law. You’ll hear this old market saying — the idea that you should lean with the direction of Fed policy rather than against it. It captures something true about the pressure rates exert, but it has failed often enough that treating it as a rule is a good way to lose money. Direction, magnitude, and timing all vary from cycle to cycle.
No one can reliably time the Fed. Predicting the next rate decision, and then predicting how a complex market will react to it, is two hard forecasts stacked on top of each other. Professional institutions with armies of economists get both wrong routinely. This article deliberately makes no claim about where rates or markets are headed — the brief for this whole section is to explain the machine, not to forecast it, and that boundary is the difference between education and a sales pitch.
Consider what living through a full rate cycle actually teaches: the temptation, when the Fed starts hiking, is to yank money out of stocks in anticipation of a 2022-style drop — and just as often the market has already moved, or refuses to cooperate, and the person who “sold before the hike” ends up buying back higher. The lesson most people eventually absorb is not predict the Fed, but build a plan that survives being wrong about the Fed.
The Beginner’s Takeaway
You don’t need to predict interest rates to invest sensibly — you need to understand that they are the weather system your portfolio lives inside. Rates are the invisible force behind a huge share of the market’s day-to-day moves, which is why financial news is obsessed with the Fed. Knowing the four channels means the next time headlines scream about a rate decision, you’ll understand why your account moved, instead of treating it as random.
The practical response to all this isn’t to trade around Fed meetings. It’s the opposite: because rate moves are so hard to predict and so easily already priced in, a steady, rules-based approach — like the dollar-cost-averaging habit covered elsewhere on this site — is a way to keep investing through every phase of the rate cycle without having to guess the Fed’s next move. Interest rates will keep moving markets; your job is to build something that doesn’t depend on you calling those moves correctly.
To see how these rate cycles fit into the larger story of credit, debt, and expansion and contraction, the pillar for this section — The Economic Machine Explained — is the natural next read. For the weekly plain-English read on what the Fed and the economy are actually doing, the newsletter is below.
Every cycle since Volcker: the Economic Cycles Explorer tabulates the Fed’s policy-rate cycles from 1979 to 2023, and what each one was for.
Disclaimer: This article is educational content, not financial advice. I am not a licensed financial advisor, and nothing here is a recommendation to buy or sell any security or asset. Investing and trading involve risk, including the possible loss of the money you invest. Do your own research and consider consulting a licensed financial professional before making investment decisions. Read the full Disclaimer.
Historical and backtested results are hypothetical, carry inherent limitations, and do not guarantee future results. Figures were accurate to the best of my knowledge as of this article’s last-updated date and may have changed.
