Walk-Forward Analysis: Testing a Strategy Like a Quant
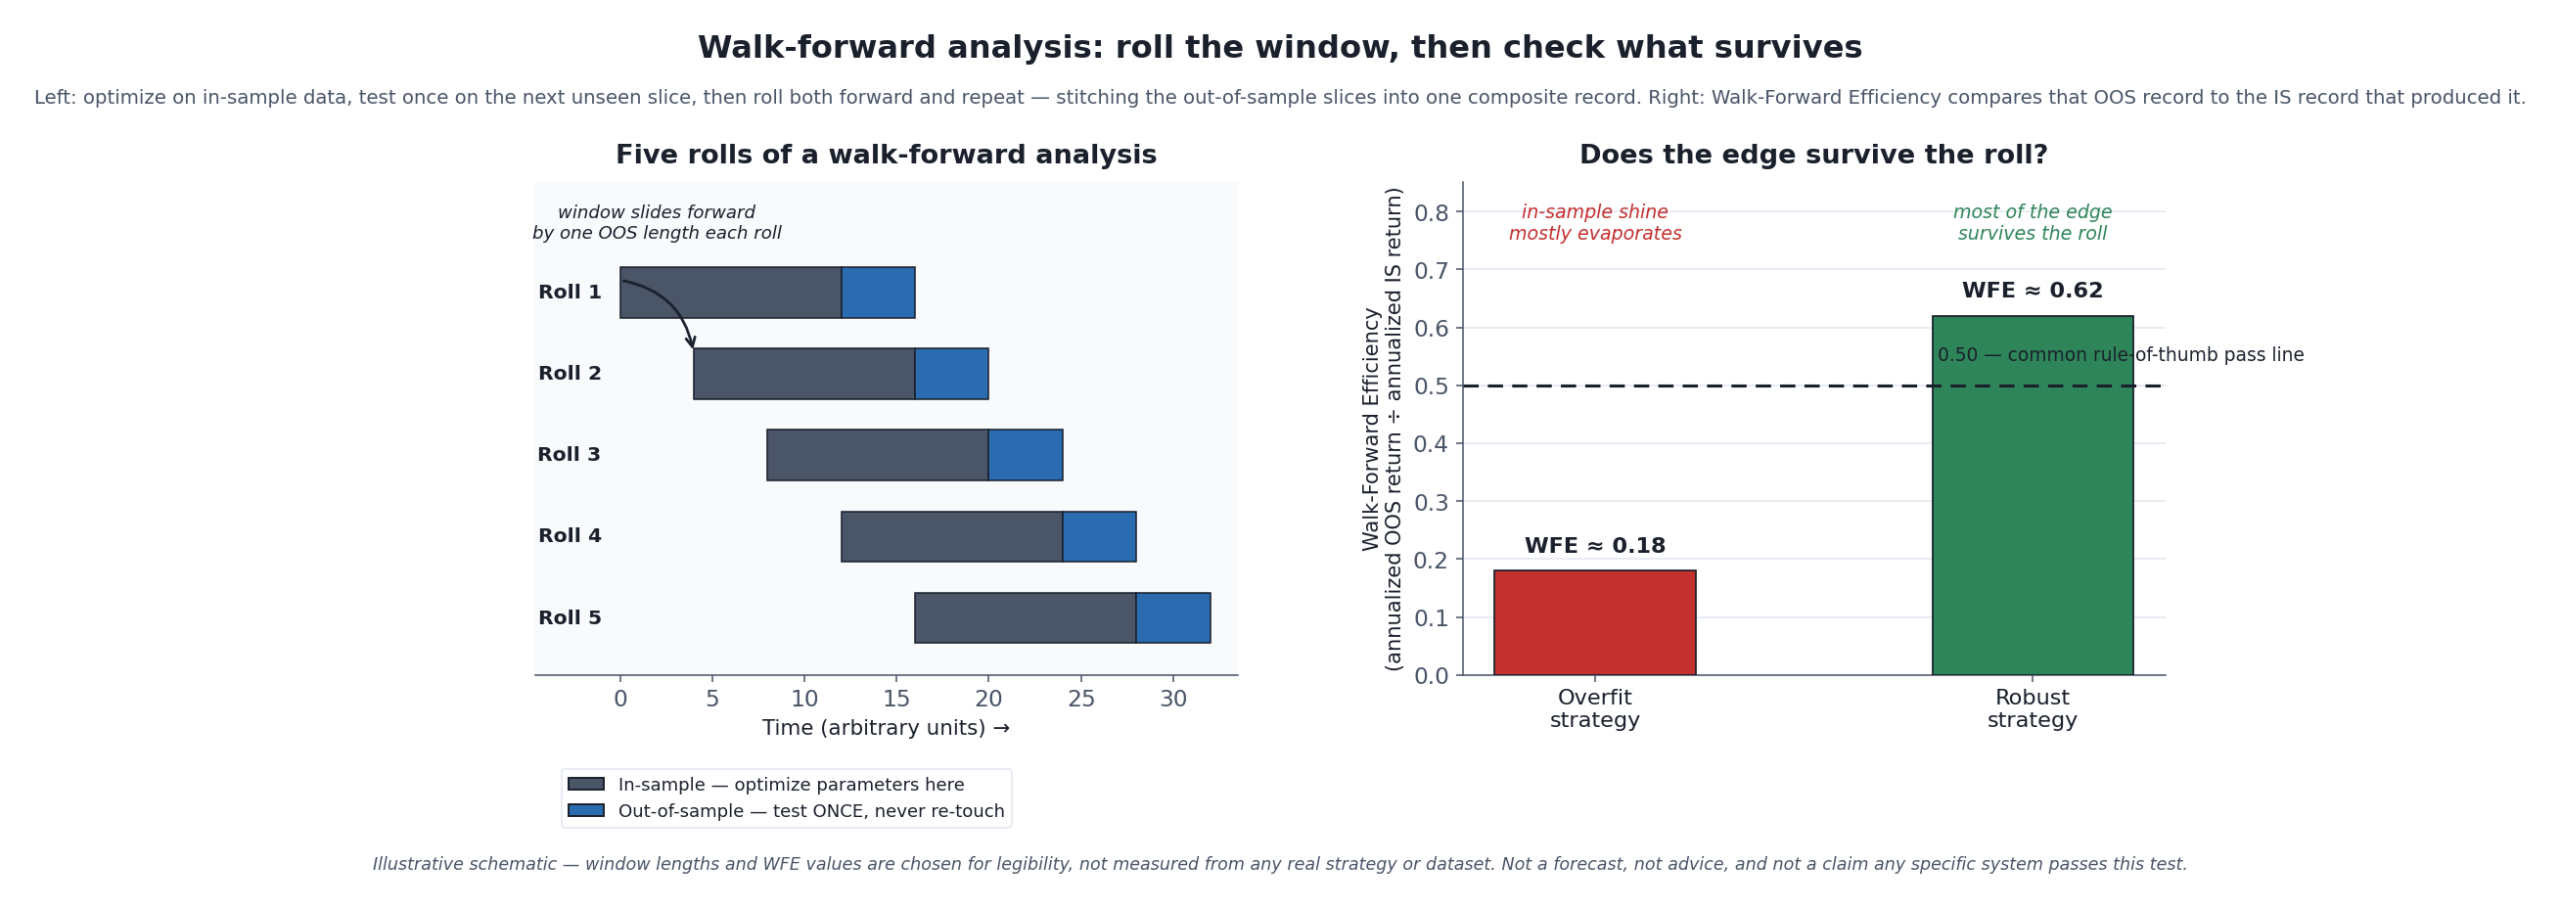
Walk-forward analysis in one picture: re-optimize, test once on data you haven’t touched, roll the window forward, repeat — then grade the whole thing with one honest ratio.
A single in-sample/out-of-sample split is the minimum bar for testing a trading strategy: tune on one slice of history, look at a different slice exactly once, and see if the edge survives. It is also, on its own, a fairly weak test. It tells you whether the strategy worked on one unseen period. It says nothing about whether the strategy would have kept working if you had re-optimized it periodically the way an actual systematic trader does — nor whether that one lucky (or unlucky) out-of-sample window was representative of anything durable. Walk-forward analysis is the answer systematic traders and quant researchers reach for instead: run the in-sample/out-of-sample test not once, but dozens of times, rolling forward through history, and grade the strategy on the stitched-together record of everything it never got to see coming. First described by Robert Pardo in his 1992 book Design, Testing and Optimization of Trading Systems and expanded in the 2008 second edition, The Evaluation and Optimization of Trading Strategies, walk-forward analysis is now widely treated as something close to the industry standard for validating a systematic strategy before risking money on it [source: Robert E. Pardo, Design, Testing and Optimization of Trading Systems, 1st ed., Wiley, 1992, pp. 108–119; Pardo, The Evaluation and Optimization of Trading Strategies, 2nd ed., Wiley, 2008, pp. 237–262].
This is a trading-systems article, so the silo’s non-negotiable rule applies at full strength here, not as a footnote: past backtest performance does not predict future results — including a backtest built the walk-forward way. Walk-forward analysis is a better test than a single split. It is still a test run entirely on the past, still vulnerable to its own specific blind spots (covered honestly further down), and still incapable of promising that any strategy — including one that “passes” — will make money going forward.
Does the edge survive the roll? Walk-Forward Efficiency for two illustrative strategies, against the common rule-of-thumb pass threshold.
| Strategy | Walk-Forward Efficiency | Verdict |
|---|---|---|
| Overfit strategy | ~0.18 | Fails |
| Robust strategy | ~0.62 | Passes |
| Rule-of-thumb threshold | 0.50 | — |
Illustrative figures, not a backtest of a specific strategy.
What the Method Does to Your Data
Strip away the terminology and the mechanics are a repeating, four-step loop [source: Pardo, 2008; Wikipedia, “Walk forward optimization,” summarizing Pardo’s method and Kirkpatrick & Dahlquist, Technical Analysis: The Complete Resource for Financial Market Technicians, FT Press, 2010, p. 548]:
- Optimize. Take a window of historical data — the in-sample (IS) window — and search over the strategy’s parameters (a moving-average length, a threshold, a stop distance) to find the setting that performed best on that window.
- Test once. Take the very next chunk of history immediately after the in-sample window — the out-of-sample (OOS) window, data the optimization step never touched — and run the strategy on it using the parameters just chosen, unchanged. Record the result. This step happens exactly once per window. You do not peek, adjust, and re-test.
- Roll forward. Slide both windows forward by the length of the out-of-sample window, so the OOS data from this round becomes part of (or adjacent to) the next round’s in-sample data.
- Repeat until you run out of history, then stitch every out-of-sample segment together, in order, into one composite out-of-sample equity curve. That composite curve — not any single round’s number, and never the in-sample numbers — is the thing you actually evaluate.
The point of stitching the OOS segments together rather than looking at them one at a time is that it produces a long, continuous, entirely out-of-sample performance record that also captures something a single split cannot: whether the strategy’s edge held up as market conditions actually changed across the whole history, since the underlying parameters get re-optimized at every roll rather than frozen once at the start [source: Wikipedia, “Walk forward optimization”]. That is the specific sense in which walk-forward analysis tests a strategy “the way a quant would” — not with one static rule tested once, but with the same re-optimize-and-deploy cycle a systematic desk actually runs in production, compressed into a repeatable backtest procedure.
Anchored vs. Rolling Windows
There are two standard ways to slide the in-sample window forward, and the choice changes what the test is actually measuring [source: general walk-forward-optimization practitioner literature; TradeStation Walk-Forward Optimizer documentation, “About the TradeStation Walk-Forward Optimizer”]:
- Rolling (sliding) windows. The in-sample window has a fixed length — say, 400 days — and the whole window slides forward together, so old data drops off the back as new data joins the front. This is the version illustrated in the chart above. Rolling windows keep the optimization focused on recent history, which suits strategies whose edge is believed to depend on current-ish market conditions — shorter-term and intraday systems, in particular, since a fixed recent window prevents parameters from being shaped by a market regime that ended long ago.
- Anchored (expanding) windows. The in-sample window keeps its start point fixed and simply grows longer with each roll, always including everything from the anchor date forward to the current point. Anchored windows trade recency for statistical weight: every re-optimization sees more data than the last, which suits longer-horizon strategies that benefit from as much history as possible and are less concerned with adapting quickly to a regime shift.
Neither variant is “more correct” in the abstract — they encode different assumptions about whether the past that matters to the strategy is all of history or just the recent past, and a strategy’s own premise should decide which fits. A useful diagnostic, in fact, is to run both: if a strategy clears its walk-forward efficiency bar (below) under both an anchored and a rolling configuration, that agreement is a meaningfully stronger signal than passing under either one alone. If it only clears the bar under one of the two, that is worth understanding rather than ignoring — it usually means the edge depends on exactly how much (or how little) history is included, which is itself useful information about how fragile the edge might be.
The Number That Grades It: Walk-Forward Efficiency
A completed walk-forward run produces two annualized return figures: the return earned across all the in-sample windows during optimization, and the return earned across all the stitched-together out-of-sample windows. The ratio of the two is the standard grading statistic, Walk-Forward Efficiency (WFE):
Walk-Forward Efficiency = annualized out-of-sample return ÷ annualized in-sample return
This exact definition — and the accompanying rule of thumb — comes from TradeStation’s own documentation for its Walk-Forward Optimizer, one of the first commercial implementations of Pardo’s method: “As a rule of thumb, a Walk-Forward Efficiency of 50% or more is considered a measure of a successful walk-forward analysis” [source: TradeStation, “Walk-Forward Summary (Out-Of-Sample),” TradeStation Walk-Forward Optimizer help documentation]. Read plainly: if the strategy’s real, unseen performance retains at least about half of what the optimization step promised, that is treated as evidence the edge is at least partly real rather than an artifact of curve-fitting the in-sample window. A WFE comfortably above roughly 0.5–0.6 is generally read as encouraging; a WFE below roughly 0.3 is a red flag that the strategy is likely fitting noise rather than signal — though these are industry rules of thumb, not universal statistical laws, and they should be read as a first filter rather than a certification.
Two caveats belong right next to that number, because a single ratio is easy to misuse:
- A high WFE built on one lucky trade is not a passing grade. TradeStation’s own guidance flags this directly: a walk-forward analysis can be invalidated by any single unusually large win, winning streak, or winning period that contributes more than half of the total out-of-sample net profit [source: TradeStation, “Walk-Forward Summary (Out-Of-Sample)”]. Before trusting a WFE number, look at the distribution of results across the individual rolls — an edge that shows up as a broadly even contribution across most rolls is far more convincing than the same aggregate number produced by one outlier window carrying the rest.
- WFE compares two backtested numbers, not a backtest to reality. Both the in-sample and out-of-sample figures are still historical statistics computed on data that has already happened. A strong WFE says the strategy’s edge survived a form of re-optimized, rolling-forward testing — it does not and cannot say the edge will survive a market regime that has not occurred yet in any tested window.
A Worked Example (Synthetic Data — Not a Real Market or Strategy)
The mechanics above are easiest to trust once you have watched a real, reproducible computation run through them — so here is one, run entirely on a synthetic price series generated for this article, with no connection to any real security, asset, or market. Nothing below should be read as evidence about how moving-average crossovers perform on real markets (that specific question, with the actual mixed academic record, is covered honestly in the Moving Averages Explained article); it exists purely to make walk-forward’s mechanics and its grading number concrete.
The setup: a synthetic daily price series (about 6.3 years, 1,600 trading days) was generated in Python from random daily returns with a small, deliberately injected autocorrelation (each day’s return nudged slightly by the prior day’s, so a trend-following rule has some faint, genuine signal to find — a coin that is very slightly weighted, not a fair one). Against that series, a simple two-parameter moving-average crossover (long when a fast SMA is above a slow SMA, flat otherwise) was walk-forward tested: an anchored-style rolling structure with an in-sample window of 400 days and an out-of-sample window of 150 days, rolled forward eight times across the full series. At each roll, the fast/slow SMA pair was chosen from a small, deliberately limited grid (4 fast lengths × 4 slow lengths = 16 combinations — keeping the number of trials low is itself part of the discipline this silo’s overfitting article covers) by whichever combination produced the best in-sample annualized return; that pair was then applied, completely unchanged, to the next out-of-sample window.
The eight rolls did not agree with each other — which is itself the point. Some rolls posted a strong in-sample number that mostly evaporated out-of-sample; one roll posted a negative in-sample number whose out-of-sample result happened to be strongly positive anyway; several late rolls were negative in both. Stitching all eight out-of-sample segments together against all eight in-sample segments produced:
- Composite in-sample annualized return: +17.15%
- Composite out-of-sample annualized return: +11.46%
- Walk-Forward Efficiency: 0.67
By the TradeStation rule of thumb above, a WFE of 0.67 would be read as a passing, even encouraging, result — the strategy retained about two-thirds of its in-sample performance once tested honestly on data it never touched during optimization. Read this result exactly as narrowly as it deserves: it demonstrates that the procedure worked as designed on one specific, artificial, mildly-autocorrelated synthetic series with a fixed random seed. It is not evidence that this or any moving-average crossover has a real edge on any real market, and a different random seed, a different synthetic autocorrelation, or a different grid would produce a different WFE — which is exactly why the method exists: to force the question onto a number computed honestly from held-out data, instead of leaving it to the impression the in-sample chart makes.
The Schedule, Tabulated
The run above reports three composite numbers and the parameters that produced them. Those parameters carry more information than the composite does, and none of it is drawn out: how much of the series was actually graded, what the anchored-versus-rolling choice would have changed, and what the grading thresholds mean in the units the run reports. All three are exact arithmetic on the figures already published above — no second price series is generated, because a different synthetic series would produce different numbers and collide with the ones stated.
One reconciliation first, because it confirms the schedule is internally consistent: an in-sample window of 400 days followed by eight out-of-sample windows of 150 gives 400 + 150 × 8 = 1,600, exactly the series length reported. The eight rolls consume the history precisely, with nothing left over.
Where the 1,600 Days Went
A walk-forward run does not grade all of its data. The first in-sample window is optimized on and never tested, because there is no earlier history to roll forward from.
| Segment | Days | Share |
|---|---|---|
| Ever tested out-of-sample | 1,200 | 75.00% |
| Never tested out-of-sample | 400 | 25.00% |
| Ever used for training | 1,450 | 90.62% |
| Full series | 1,600 | 100.00% |
Three quarters of the history is graded and a quarter of it never is — the opening 400 days are the price of admission. The useful counterpart is that every out-of-sample day is used exactly once: 1,200 day-tests spread across 1,200 distinct days, with no reuse anywhere. That single-use property is the whole reason the stitched curve can be read as an honest record, and it is also why a longer series buys grading coverage cheaply — the untested opening block stays 400 days no matter how much history follows it.
What the Window Choice Would Have Changed
The article recommends running both window types and calls the agreement between them a meaningfully stronger signal — then runs one configuration. It is worth seeing what the other would have done, since the difference is fixed by the schedule rather than by the market. (The run describes itself as an “anchored-style rolling structure” with a fixed 400-day in-sample window; a fixed-length window is the rolling variant, so both columns are shown rather than assuming which was meant.)
| Roll | Rolling | Anchored |
|---|---|---|
| 1 | 400 | 400 |
| 2 | 400 | 550 |
| 3 | 400 | 700 |
| 4 | 400 | 850 |
| 5 | 400 | 1,000 |
| 6 | 400 | 1,150 |
| 7 | 400 | 1,300 |
| 8 | 400 | 1,450 |
Summed across all eight rolls, the anchored variant would have optimized over 7,400 training-days against rolling’s 3,200 — 2.3125× as much — and its final re-optimization would have seen a window 3.625× wider. That is the article’s “trade recency for statistical weight” with a number attached, and the trade is steeper than the phrase suggests: by the last roll the anchored version is fitting to a window nearly four times longer, three quarters of which is history the rolling version has deliberately discarded. Note also what rolling does not avoid: across the run each of the 1,450 trainable days is still reused 2.2069 times on average, so a rolling window is not a fresh look each time either.
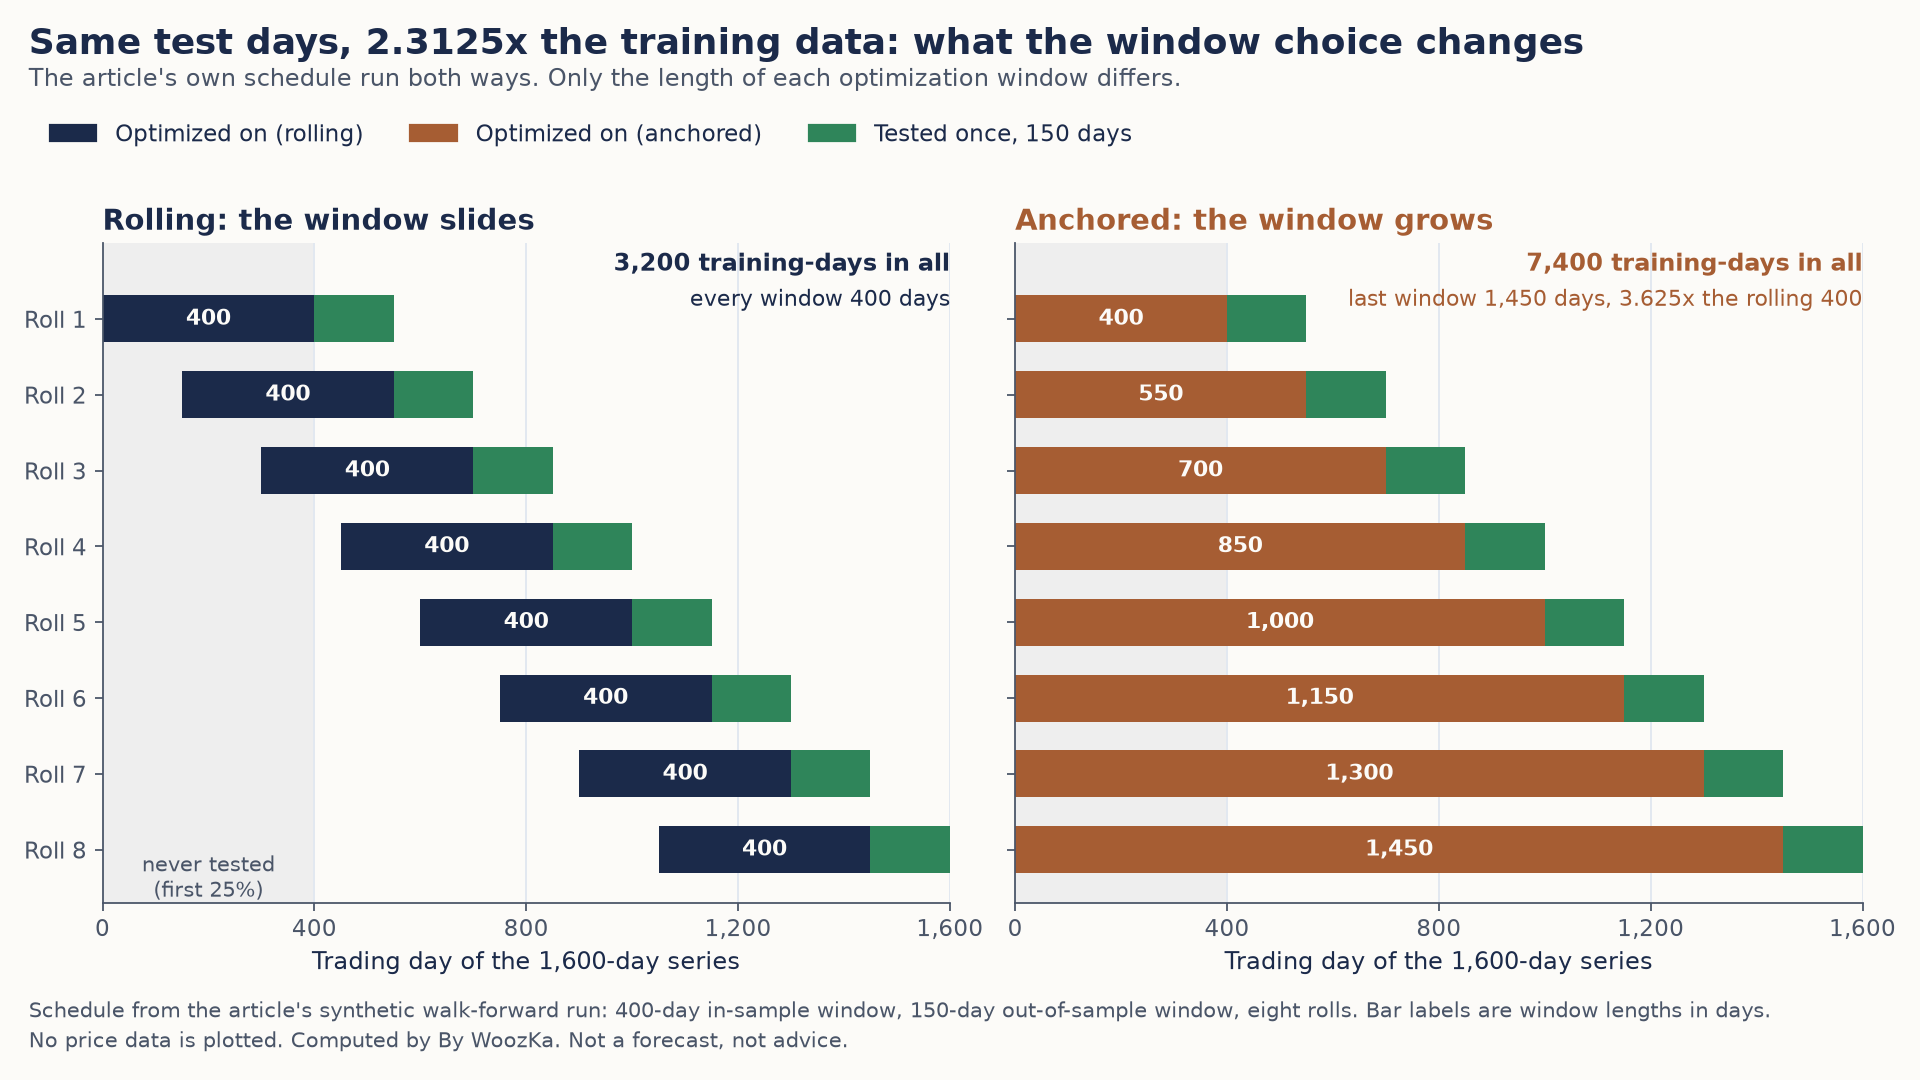
Both versions test exactly the same 1,200 days. The only difference is how much history each re-optimization sees, and by the last roll the anchored window is 3.625 times wider.
The Thresholds, in the Units the Run Reports
The grading numbers appear in two different places — a rule of thumb of 0.50, a red flag below roughly 0.30, two illustrative strategies at 0.18 and 0.62, and this run’s 0.67 — and never on one axis. Against the run’s own in-sample 17.15%, each threshold implies a specific out-of-sample return.
| Level | WFE | Implied OOS | Gap |
|---|---|---|---|
| Overfit example | 0.18 | 3.09% | 14.06 pts |
| Red-flag level | 0.30 | 5.14% | 12.00 pts |
| Rule of thumb | 0.50 | 8.57% | 8.57 pts |
| Robust example | 0.62 | 10.63% | 6.52 pts |
| This run | 0.6682 | 11.46% | 5.69 pts |
The run’s published 0.67 recomputes from its own two returns as 0.6682, so the article’s arithmetic is confirmed. The figure it does not state is the one in the last column: 5.69 percentage points a year did not survive the roll, which is 33.18% of the in-sample return handed back. Read down that column and the grading scale stops being abstract — the difference between the red-flag level and the rule of thumb is 3.43 points of annualized return on this run’s numbers, and clearing 0.50 required only 8.575% out-of-sample, a bar this run cleared by 2.885 points. The scale also flatters at the top: the distance from 0.62 to 0.67 is worth 0.83 points a year, while the distance from 0.18 to 0.30 is worth 2.06.
Method for these tables, and the one thing they do not attempt. Nothing above re-runs the walk-forward test or generates a price series; every figure is exact arithmetic on parameters this article already publishes — 1,600 days, a 400-day in-sample window, a 150-day out-of-sample window, eight rolls, a 16-combination grid, and the composite 17.15% and 11.46% returns — and the code behind the tables verifies every published value, including the article’s own 0.67, before reporting. These are properties of the schedule, not of any market: they would hold identically for any strategy run on this window structure, which is exactly why they can be stated without a backtest. The underlying series is synthetic and unconnected to any real security, as the section above says, and these tables inherit that limit without adding to it. The run performed 16 × 8 = 128 in-sample optimizations; what that count implies about luck and multiple testing is the subject of the overfitting article already linked above and is deliberately not computed here. No shipped calculator covers window scheduling, so nothing here comes from a tool and none is linked. Nothing above recommends a window type, a strategy, or a threshold, and nothing above predicts any future result.
What Walk-Forward Analysis Still Can’t Fix
Walk-forward analysis is a genuine improvement over a single in-sample/out-of-sample split, and it is still not the last word on whether a strategy is real. Three limitations are worth stating plainly, because each is easy to lose sight of once a strategy has “passed.”
It only ever tests one historical path. However many times the window rolls forward, a walk-forward analysis is still run against the one sequence of prices that actually happened. It never asks “what if history had unfolded slightly differently” — every roll’s in-sample and out-of-sample segments come from the same single timeline. That makes the resulting WFE a single data point, not a distribution: it can be biased by the specific sequence of calm periods, shocks, and trends that happened to occur, and a strategy can look robust under walk-forward testing on one path while still being fragile to paths that didn’t occur in the available history [source: general critique of walk-forward validation in the machine-learning-for-finance literature, discussed in the context of Combinatorial Purged Cross-Validation]. Marcos López de Prado’s response to exactly this gap was Combinatorial Purged Cross-Validation (CPCV), developed in 2017: instead of one rolling path through history, CPCV constructs many different train/test combinations from the same data, purges overlapping observations between them, and embargoes a gap around each split to prevent information leakage — producing a distribution of out-of-sample outcomes rather than one number [source: Marcos López de Prado, purged and combinatorial-purged cross-validation methodology, 2017 (Guggenheim Partners / Cornell University); see also the overfitting deep-dive for the Deflated Sharpe Ratio and probability-of-backtest-overfitting statistics from the same body of work]. CPCV is heavier to compute and less universally implemented in retail platforms than walk-forward, which is exactly why walk-forward remains the practical default — but it is worth knowing that “passed walk-forward” is a weaker claim than “passed a method that tests many possible historical paths.”
Repeated re-optimization can still overfit each individual window. Walk-forward analysis forces honest, never-touched out-of-sample testing at each roll — but nothing about the procedure stops the in-sample optimization step at each roll from searching over dozens of parameter combinations and picking whichever one looks best on that window’s noise, the same overfitting mechanism the dedicated overfitting article covers in full. A walk-forward analysis built on a 500-parameter grid search at every roll is not meaningfully more trustworthy than a single overfit backtest — it is the same mistake, repeated on a rolling schedule. The parameter-count discipline from that article (fewer optimizable knobs, a stated reason the strategy should work before the search begins, suspicion of any parameter chosen from a very large search space) applies with exactly the same force inside a walk-forward loop as it does outside one.
It cannot audit the choice of what to walk forward. Both limitations above sit inside the procedure; this one sits above it. Walk-forward grades a strategy against the history that exists, but it has no way to subtract the fact that you selected that strategy — usually out of a field of candidates you had already looked at — before the first window ever rolled. A Profit Factor of 70, and the Account Still Blew Up runs that selection step out in the open on public data: rank a field of simple rules on the first half of a long history, take the winner, and measure what is left of it in the second half. The winner keeps working, at a fraction of what it advertised — an edge of +3.32 percentage points a year in the ranking sample, +0.56 points in the years that followed. Rolling the window changes which rule wins in each period; it does not remove the act of picking a winner, which is where the shrinkage came from.
Running One Without Fooling Yourself
Four practical points, gathered from the mechanics above, worth treating as a short checklist before trusting any walk-forward result:
- Look at the distribution across rolls, not just the aggregate WFE. A composite number built from broadly consistent, modest results across most rolls is far more convincing than the identical number produced by one outlier roll carrying the rest — check this explicitly, since TradeStation’s own guidance treats a >50%-from-one-period result as invalidating.
- Keep the in-sample search small and justified. A tiny, deliberately limited grid searched at every roll (as in the worked example above) is defensible; a sprawling search repeated at every roll manufactures an illusion of robustness while committing the exact overfitting error walk-forward exists to catch.
- Try both anchored and rolling windows if the strategy’s premise allows it. Agreement between the two is a meaningfully stronger signal than either alone; disagreement is informative about how sensitive the edge is to how much history gets used.
- Remember what a passing WFE is — and is not. It is evidence the strategy’s edge did not evaporate across the specific historical path that was tested, re-optimized on a rolling schedule the way a systematic trader actually operates. It is not a probability of future profit, not a guarantee against a regime the tested history never contained, and not a substitute for the parameter-count and economic-rationale checks in the robustness checklist this cluster also covers.
If you have run one of these yourself, the moment that tends to stick is not the final composite number — it’s the roll where the story falls apart. The aggregate WFE looks fine, and then you break it down roll by roll and find that four of the five out-of-sample windows lost money and the fifth caught one enormous, unrepeatable move that is carrying the entire result. That is exactly the failure mode TradeStation’s own documentation warns about, and it is far easier to miss than it sounds when the headline ratio is the only number you look at. The discipline that actually protects you is not running the walk-forward analysis — it’s the habit of opening up the per-roll results every single time, before you let one clean-looking ratio talk you into a position size you’d regret.
Reading This Alongside the Pillar
This article is the deep dive on the “did it survive data it never saw” question this cluster asks repeatedly, at its strongest and most rigorous setting. From here:
- How to Backtest a Trading Strategy the Right Way — the pillar this article expands on; introduces walk-forward analysis alongside look-ahead bias, survivorship bias, and cost modeling as the four things an honest backtest must get right.
- What Is Overfitting in Backtesting (And How to Avoid It) — the mechanism this article’s “repeated re-optimization can still overfit” section depends on: why searching hard enough manufactures a great-looking backtest from pure luck.
- What Makes a Trading System Robust? A Checklist — folds “did it survive data it never saw” (question 2 of that checklist) into the full eight-question robustness review; this article is the full mechanics behind that one question.
- Position Sizing Rules for Systematic Traders — how to size a system whose walk-forward-tested drawdown is still a floor, not a ceiling, for what live trading can produce.
- Mean Reversion vs Trend Following: Which Strategy Style Fits You? — the two style families whose “does the edge generalize across regimes” question a rolling walk-forward test is specifically built to interrogate.
- Why Most Trading Systems Fail Out-of-Sample — the failure mode a clean walk-forward result is trying, imperfectly, to rule out.
- Moving Averages Explained: SMA vs EMA and When to Use Each — the actual, mixed academic record on moving-average crossovers referenced (and deliberately not relied upon) in the worked example above.
If you want the plain-English, rigor-first read on building and validating trading systems — the honest version, where every method comes with what it still can’t tell you attached — that is what the newsletter is for. Subscribe below to get the system-builder’s checklist.
Disclaimer: This article is educational content, not financial advice. I am not a licensed financial advisor, and nothing here is a recommendation to buy or sell any security or asset. Investing and trading involve risk, including the possible loss of the money you invest. Do your own research and consider consulting a licensed financial professional before making investment decisions. Read the full Disclaimer.
Historical and backtested results are hypothetical, carry inherent limitations, and do not guarantee future results. Figures were accurate to the best of my knowledge as of this article’s last-updated date and may have changed.
