Risk/Reward Ratio Explained: Why a “Good” Ratio Isn’t an Edge by Itself
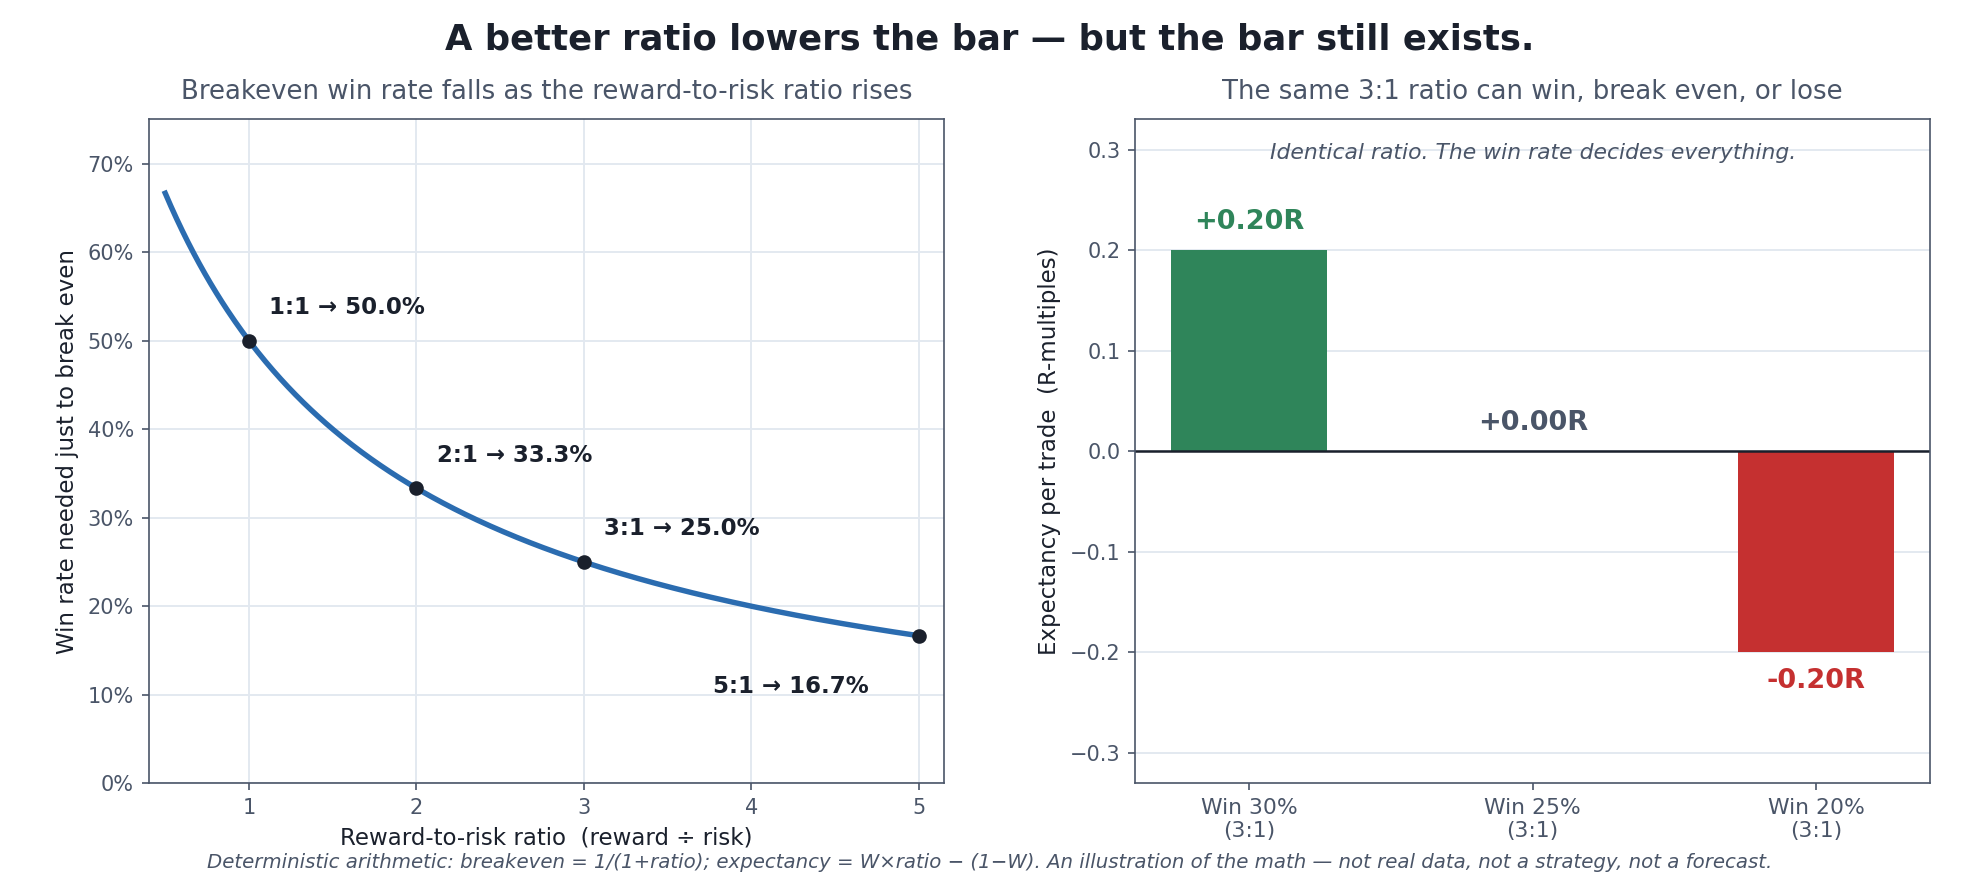
The whole argument in one picture. A favorable risk/reward ratio does one specific, valuable thing — it lowers the win rate you need to break even (left). It does not, and cannot, tell you whether you’ll clear that bar (right): three systems with the exact same 3:1 ratio range from a solid winner to a steady loser, decided entirely by a number the ratio doesn’t contain — the win rate.
Open almost any trading tutorial and you’ll meet the same commandment early: “always use a risk/reward ratio of at least 2:1.” It is repeated so often it sounds like a law of nature. It is not. The risk/reward ratio is a genuinely useful number, but on its own it is one of the most over-sold and least-understood metrics in trading — because a favorable ratio is not an edge. It is a discount on the win rate you need, and nothing more. This article is about what the ratio actually measures, the one formula that turns it into something you can act on, and the honest catch that the “just use 3:1” crowd almost never mentions.
This is a trading-systems article, so the silo’s non-negotiable rule governs every line: past backtest performance does not predict future results. A risk/reward ratio you plan is not the ratio you will realize; a win rate measured on history is not the win rate you’ll get next; and any nice-looking combination of the two, pulled from a backtest, is a lucky-sample statistic like every other.
What the Ratio Actually Is
The risk/reward ratio (more precisely the reward-to-risk ratio) compares the size of the profit you’re aiming for against the size of the loss you’re willing to accept on a single trade. It is defined before you enter, from three prices: your entry, your stop-loss (where you’ll get out if wrong), and your target (where you plan to take profit).
Reward-to-risk ratio = Potential reward ÷ Potential risk = |Target − Entry| ÷ |Entry − Stop|
If you buy at $50, set a stop at $48, and a target at $56, your risk is $2 per share and your reward is $6 per share, for a ratio of 6 ÷ 2 = 3.0, usually written 3:1 (“three to one”). You’re risking one unit to make three. Note what the ratio is not: it says nothing about how many shares you buy (that’s position sizing), and nothing about how likely the target is to be hit before the stop. It is purely the shape of a single trade’s payoff — the geometry of the bet, not the odds of winning it.
Expressed the other way around, some platforms show the risk/reward ratio as risk ÷ reward (here, 1 ÷ 3 ≈ 0.33). The numbers are the same information inverted; this article uses the reward-to-risk convention (bigger = more reward per unit of risk) because it’s the one most traders say out loud, but the calculator that pairs with this piece labels both so there’s no ambiguity.
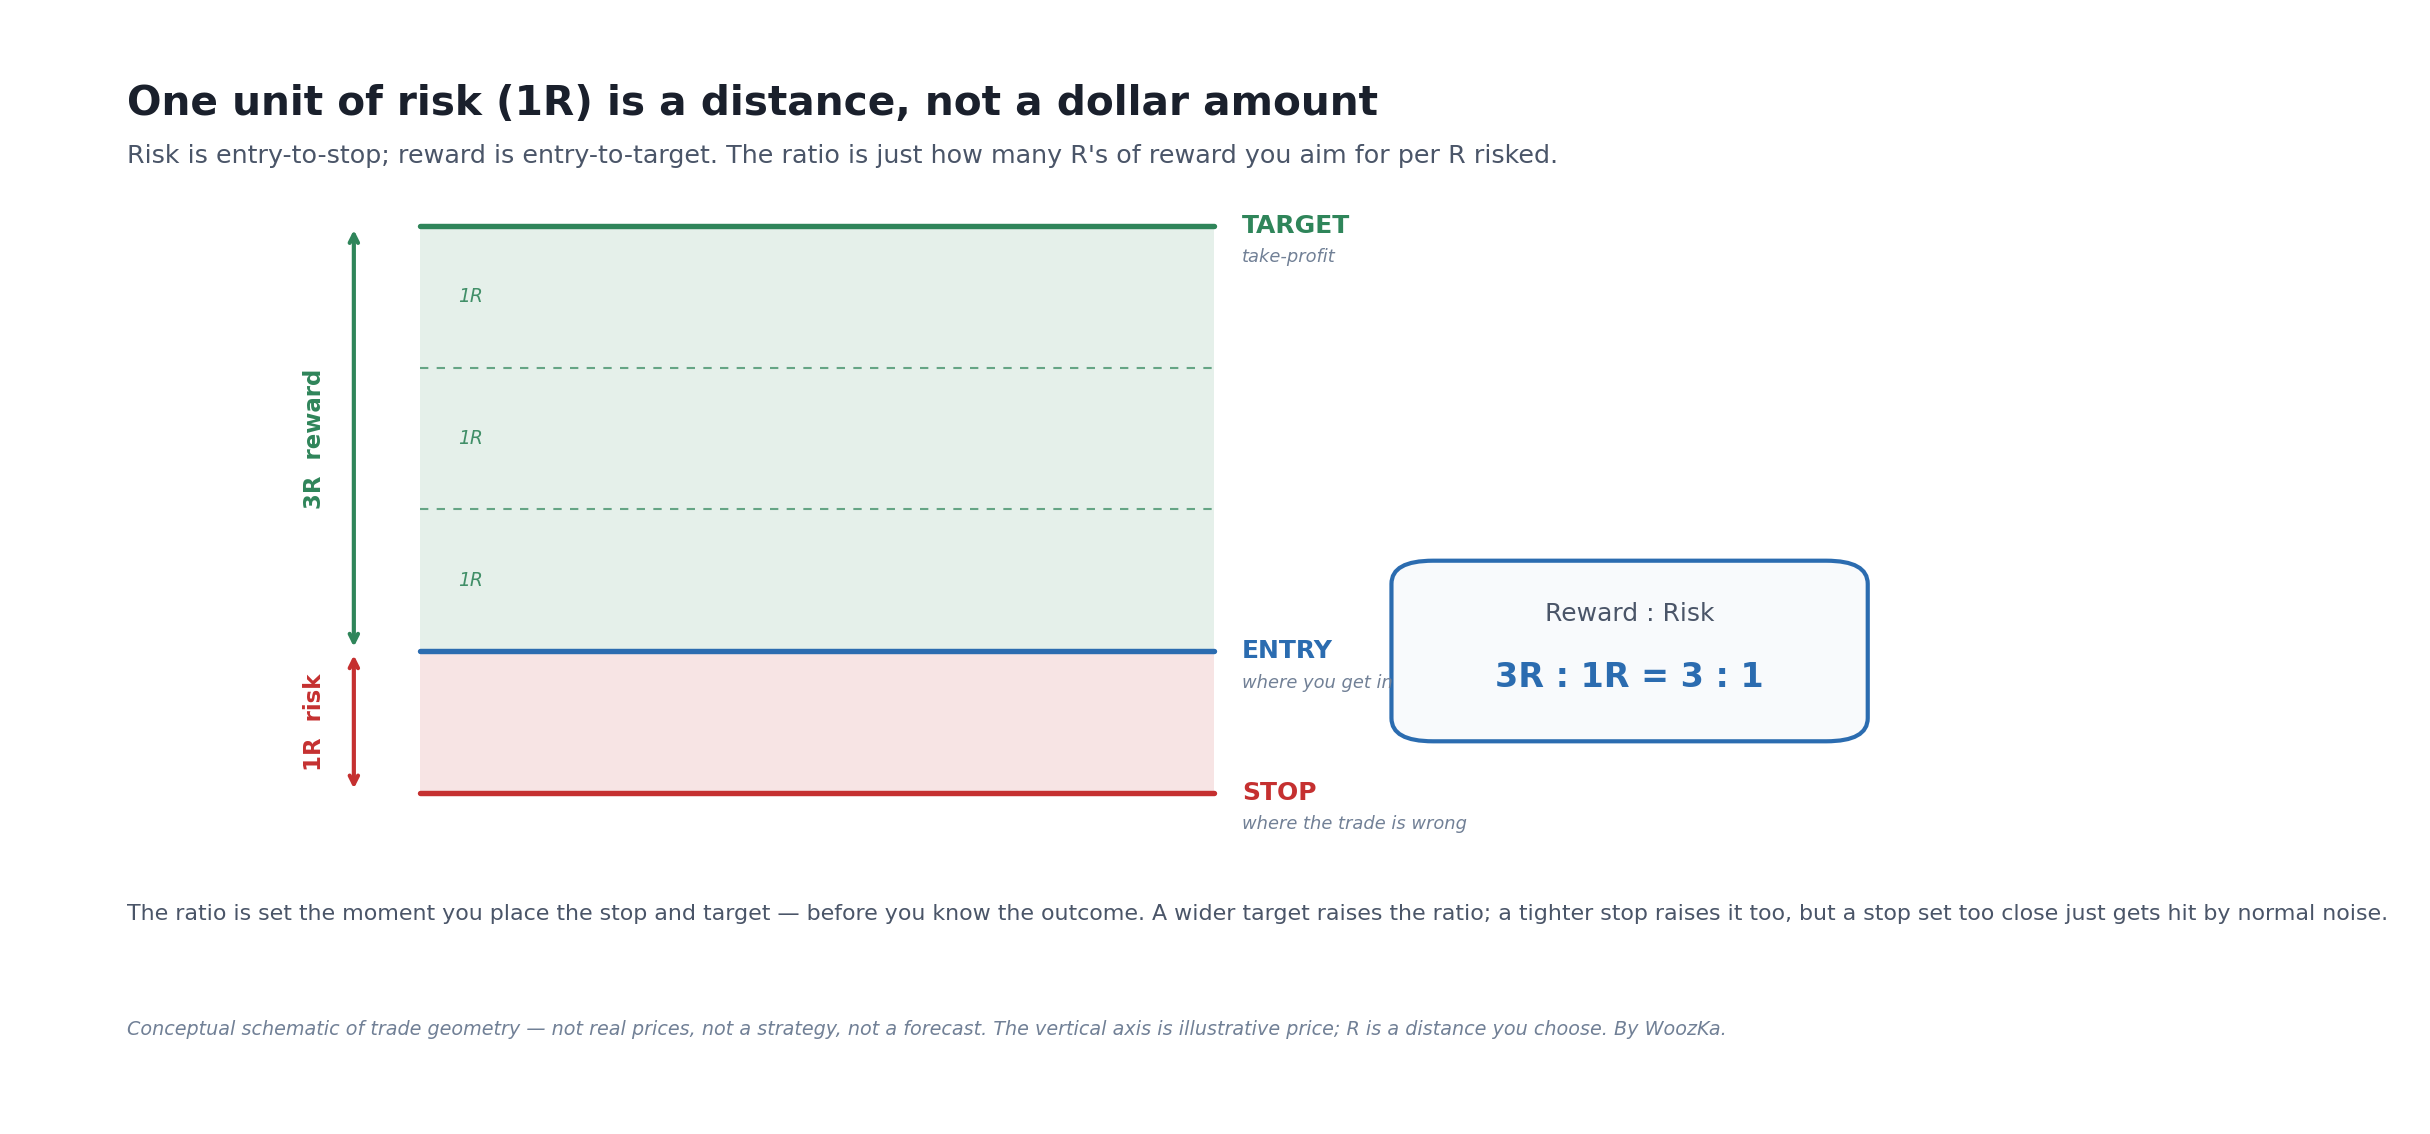
Before the ratio is a number it is a picture: one unit of risk is the space between your entry and your stop, and the ratio just counts how many of those units of reward you are reaching for.
The One Formula That Makes the Ratio Useful: Breakeven Win Rate
A ratio by itself is inert. What turns it into a decision is pairing it with the question it implies: given this payoff shape, how often do I need to be right just to break even? That number is the breakeven win rate, and it is exact arithmetic, not an opinion:
Breakeven win rate = 1 ÷ (1 + reward-to-risk ratio)
equivalently Risk ÷ (Risk + Reward) [source: standard trading arithmetic; the breakeven win rate is set entirely by the reward-to-risk ratio — see summaries at JournalPlus, Traders’ Second Brain, and FXNX, verified via web search 2026-07-10]. Run it across the common ratios and the whole appeal of a favorable ratio becomes visible (this table is deterministic arithmetic — an illustration of the math, not any strategy’s results):
| Reward-to-risk ratio | Breakeven win rate |
|---|---|
| 0.5 : 1 | 66.7% |
| 1 : 1 | 50.0% |
| 1.5 : 1 | 40.0% |
| 2 : 1 | 33.3% |
| 3 : 1 | 25.0% |
| 4 : 1 | 20.0% |
| 5 : 1 | 16.7% |
This is the entire mathematical case for a bigger ratio, and it’s a real one: the more you stand to make relative to what you risk, the less often you need to be right. At 1:1 you must win more than half your trades to make money. At 2:1 you can be wrong two times out of three and still break even. At 3:1 you can be wrong three times out of four. This is the arithmetic behind the trend-follower’s creed — win rarely, but let the winners dwarf the losers — and it’s why “cut your losses short and let your winners run” is more than a slogan: running your winners raises the reward side of the ratio, which lowers the win rate you have to defend.
The left panel of the featured chart is just this table drawn as a curve. Notice its shape: the breakeven win rate drops fast from 1:1 to about 3:1, then flattens. Going from 1:1 to 2:1 buys you a huge reduction (50% → 33.3%); going from 4:1 to 5:1 barely moves the bar (20% → 16.7%). The help a bigger ratio gives you has sharply diminishing returns — a fact that matters once we get to the catch.
Why the Ratio Alone Is Not an Edge
Here is the part the “always use 2:1” advice skips, and it is the reason this article exists. The breakeven win rate is the bar; the ratio doesn’t tell you whether you clear it. Your actual win rate — how often the target really gets hit before the stop — is a completely separate number that the ratio contains no information about. Pair a great ratio with a win rate below its breakeven and you have a losing system with beautiful geometry.
The right panel of the chart makes this concrete with three systems that share an identical 3:1 ratio:
- Win 30% of the time: expectancy = (0.30 × 3) − (0.70 × 1) = 0.90 − 0.70 = +0.20R per trade. A winner.
- Win 25% of the time (exactly the breakeven for 3:1): (0.25 × 3) − (0.75 × 1) = 0.75 − 0.75 = 0.00R. Dead flat.
- Win 20% of the time: (0.20 × 3) − (0.80 × 1) = 0.60 − 0.80 = −0.20R per trade. A loser.
Same ratio, three destinations, from profit to loss — decided entirely by the win rate. A 3:1 setup that only wins 20% of the time is worse than a boring 1:1 setup that wins 55%. This is the single most important correction to the popular framing: a favorable risk/reward ratio is necessary but not sufficient. What actually determines whether a system makes money is the two numbers together, combined into expectancy — which is exactly why the full quality judgment lives in the trade expectancy explainer and its calculator. The risk/reward ratio is one input to that judgment, not a substitute for it.
The Catch Nobody Mentions: A Better Ratio Usually Costs You Win Rate
If a bigger ratio only ever helped — lowering your breakeven win rate for free — the optimal strategy would be to set absurdly distant targets and reap 10:1 payoffs. Traders who try this discover the catch immediately: pushing your target further away lowers the probability the target gets hit before your stop. Reward and win rate are not independent dials you can turn separately. Widen the target to improve the ratio and, all else equal, price now has to travel further in your favor without first touching the stop — so a smaller fraction of trades reach it. You bought a lower breakeven win rate and paid for it with a lower actual win rate, and there is no guarantee the trade was worth it.
This is why “just use 3:1” is not free advice. Moving from a 1:1 target to a 3:1 target on the same setup might drop your breakeven requirement from 50% to 25% — but if it also drops your real hit rate from 55% to 22%, you’ve made the system worse, not better. The right target is the one that maximizes expectancy (ratio and win rate multiplied together), and finding it is an empirical question about how a specific setup’s price actually behaves — not a slogan. A modest, realistic ratio you actually achieve beats a heroic ratio you rarely reach.
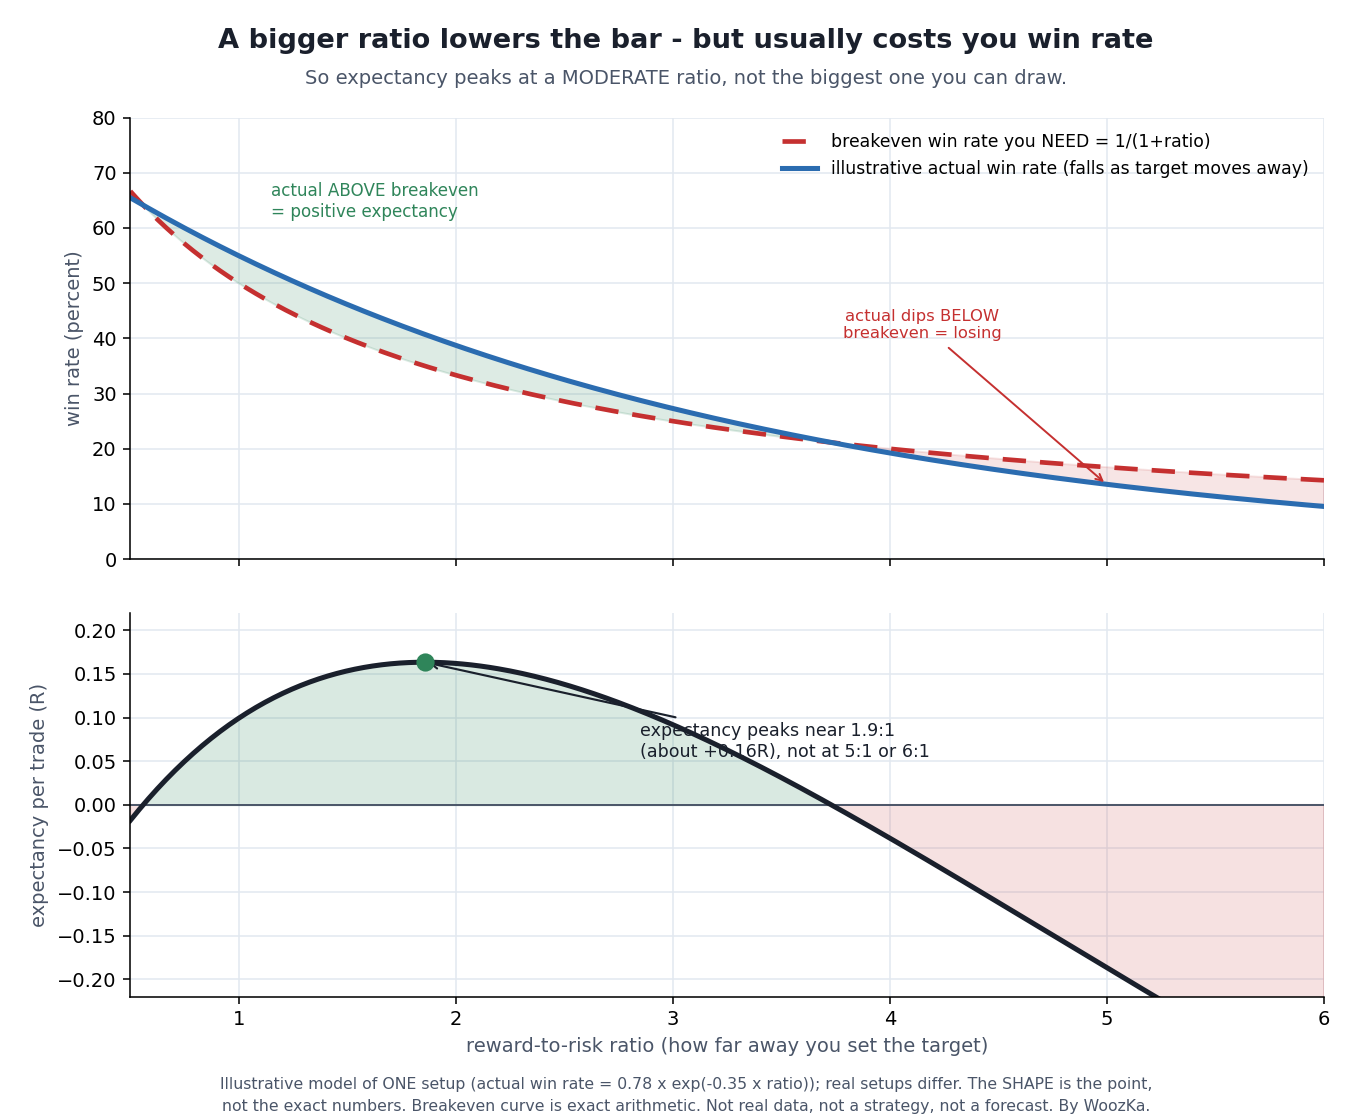
Why “bigger is always better” is wrong. A more distant target lowers the win rate you need (the red bar) but also lowers the win rate you get (the blue line falls faster). Multiply the two into expectancy and you get the bottom panel: a hump, not a ramp. The best target on this illustrative setup is a modest ~1.9:1 — past that, every extra unit of ratio costs more win rate than it’s worth.
The reason the popular rule still contains wisdom is subtler than “bigger is better”: most beginners err in the opposite direction — tiny targets and wide stops, an unfavorable ratio that demands a punishingly high win rate they can’t sustain once costs and cold streaks arrive. “Use at least 2:1” is a blunt corrective to that specific mistake, not a universal optimum.
Planned Ratio vs. Realized Ratio
There’s a second gap between the ratio on your screen and the ratio in your account, and it’s easy to forget: the ratio you plan is rarely the ratio you get. The clean 3:1 assumes you exit exactly at your stop on every loss and exactly at your target on every win. Real trading is messier. Stops slip in fast markets, so a −1R planned loss can become −1.3R. You take partial profits early, or trail a stop and get shaken out at +1.2R instead of the planned +3R. Gaps jump straight past your stop. Every one of these drags your realized reward-to-risk ratio below the number you drew on the chart — and because losses tend to slip against you more than wins slip in your favor, the drift is usually unfavorable.
Then there are costs. The bid-ask spread, commissions, and slippage come out of every winner and add to every loser, and they shrink small ratios disproportionately. A planned 1.2:1 trade can quietly become a losing proposition once realistic costs are netted out on both sides, while a 4:1 trade barely notices them.
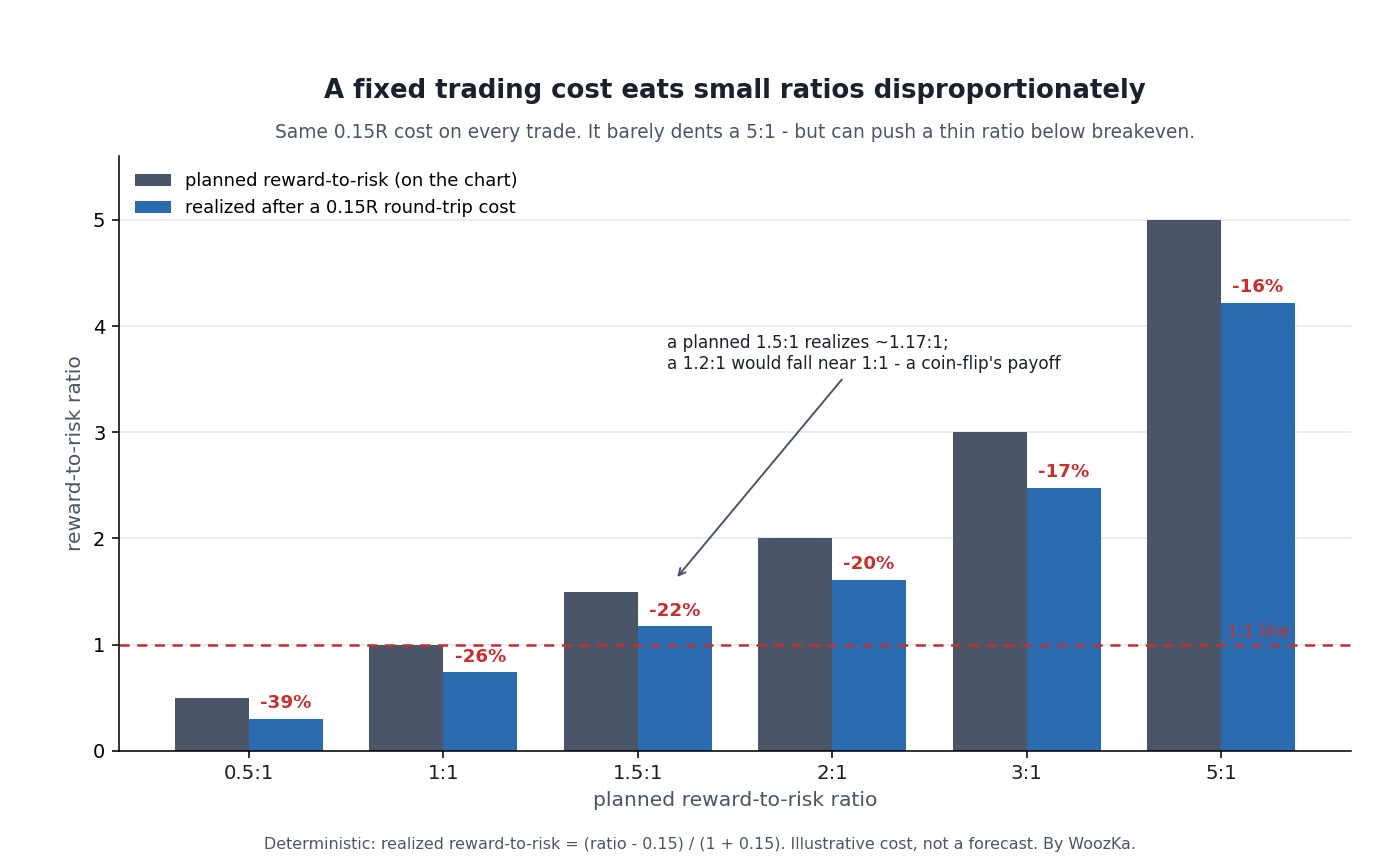
The unglamorous argument for a healthier ratio. The cost is the same on every trade, but it takes a far bigger proportional bite out of a small ratio — 39% off a 0.5:1 versus 16% off a 5:1. A cushion isn’t magic; it just survives contact with real-world frictions that quietly sink a thin one.
This is a real, underappreciated argument for a healthier ratio — not that the geometry is magic, but that a bigger cushion survives contact with the frictions of live trading, whereas a razor-thin ratio is often eaten alive by them. The honest way to evaluate any ratio is net of costs and after realistic exit behavior, not on the pristine entry/stop/target you sketched.
Carrying the Slippage Numbers Through
The section above names exact figures — a planned −1R loss arriving as −1.3R, a planned +3R win taken at +1.2R — and then stops, calling the drift “usually unfavorable.” Those two numbers are enough to finish the thought, and finishing it changes the picture more than the wording suggests.
The same trade, planned and realized. The 3:1 setup and the 30% win rate are this article’s own; the two slippage figures are the ones it names.
| Planned | Realized | |
|---|---|---|
| Reward-to-risk | 3.00 | 0.9231 |
| Breakeven win rate | 25.0% | 52.0% |
| Expectancy at 30% wins | +0.20R | −0.55R |
A 3:1 setup that slips this way is not a 3:1 setup at all. It is a 0.92:1 setup — 69.23% of the planned ratio given away — and, worse, the bar moves with it. The trader who chose this trade because it only needed to be right one time in four now needs to be right more than half the time: the breakeven requirement goes from 25.0% to 52.0%. Run it at the win rate this article itself uses for a 3:1 winner, 30%, and the system crosses from +0.20R to −0.55R per trade, a swing of 0.75R. Nothing about the strategy changed. Only the exits did.
One measurement note, because the number depends on the unit and the article does not settle which. The −0.55R above is stated in the planned R — the amount the position was sized against, which is the honest unit for an account that set its size before the slippage happened. Measured per unit of the risk actually taken, it is −0.4231R. The conclusion is the same either way; the figure is not, so it is worth naming which one is on the page.
The Cost the Chart Never Names
The paragraph after that reports two figures from a chart — a 39% bite out of a 0.5:1 ratio, 16% out of a 5:1 — without saying what size of cost produces them. It can be recovered. Costs come out of every winner and add to every loser, so a planned ratio r nets out at (r − c) ÷ (1 + c). Solving each published bite for c separately:
The 39% figure implies a cost of 0.14943R per side. The 16% figure implies 0.15385R. Two percentages taken from opposite ends of the chart, with no obvious relationship between them, agree on the underlying cost to within 2.92% — and a flat 0.15R reproduces both of the article’s published numbers, at 39.13% and 15.65%.
What 0.15R per side does to a ratio. The first and last rows are the article’s own published figures; the three between them are the same arithmetic extended.
| Planned ratio | Net ratio | Bite |
|---|---|---|
| 0.5:1 | 0.3043 | 39.13% |
| 1:1 | 0.7391 | 26.09% |
| 2:1 | 1.6087 | 19.57% |
| 3:1 | 2.4783 | 17.39% |
| 5:1 | 4.2174 | 15.65% |
The Same Cost, Measured Two Ways
That table supports the article’s cushion argument exactly as stated: the proportional damage to a thin ratio is more than twice the damage to a fat one. But run the same cost through expectancy instead of through the ratio and something different happens.
Five different systems, one cost. The last two columns are the same 0.15R viewed two ways.
| Win rate | Ratio | Planned | After costs | Loss |
|---|---|---|---|---|
| 55% | 1:1 | +0.100R | −0.050R | 0.150R |
| 22% | 3:1 | −0.120R | −0.270R | 0.150R |
| 30% | 3:1 | +0.200R | +0.050R | 0.150R |
| 40% | 2:1 | +0.200R | +0.050R | 0.150R |
| 70% | 0.5:1 | +0.050R | −0.100R | 0.150R |
The last column never moves. Costs subtract exactly the same amount from expectancy at every ratio and every win rate, and the algebra says why in one line: the net expectancy is p(r − c) − q(1 + c), which rearranges to pr − q − c(p + q), and since p and q are the only two outcomes they sum to one — leaving the planned expectancy minus c, with the ratio gone from the expression entirely.
Both of the article’s claims survive this, and it is worth being precise about what each one means, because they are easy to blur. Costs really do take a far bigger proportional bite out of a thin ratio — 39% against 16% — and a thin ratio really is the one that gets pushed below 1:1 and stops working. But the fat-ratio system is not losing less money to frictions. It is losing the identical 0.15R per trade and keeping a better-looking ratio while it does. The cushion protects the geometry, not the profit.
The article’s own upgrade example carries the same signature. A 1:1 setup winning 55% is worth +0.10R; the 3:1 version of the same setup winning 22% is worth −0.12R, so the “improvement” costs 0.22R per trade and turns a modest winner into a loser — which is the article’s point, now with a price on it. And that 0.22R gap is identical after costs, because costs charge both systems the same 0.15R. Frictions make both worse; they do not change which one you should have chosen.
Method and limits, so this can be checked rather than taken on trust. Every input belongs to this article: the 3:1 planned setup, the 30% win rate, the −1.3R and +1.2R slippage figures, the 39% and 16% cost bites, and the 1:1-at-55% against 3:1-at-22% comparison. Nine values were read straight off computeRiskReward and computeExpectancy — the code running inside this page’s own Risk / Reward calculator and the Trade Expectancy one it links to — and separate code rebuilds each of the nine from scratch, reporting nothing unless its own answer matches. The 0.15R cost is not a market measurement — it is the figure implied by the article’s own two chart percentages, recovered by solving each one backward, and it is reported as such. The slippage figures are illustrative in the article and stay illustrative here; nothing above claims how often stops really slip. Prices, spreads and fill quality were never consulted; this is arithmetic on the article’s stated assumptions.
How to Use It Well
Put together, the risk/reward ratio earns a specific, bounded role in a real process — powerful when used correctly, dangerous when used as a shortcut.
Use it as a pre-trade filter and a sizing input, not a crystal ball. Before you take a trade, compute the ratio from your actual entry, stop, and target, read off the breakeven win rate it demands, and ask honestly: is my real win rate on this kind of setup comfortably above that bar, after costs? If you don’t know your win rate, the ratio can’t rescue you — that’s the signal to keep records and find out, not to assume a big ratio will carry you. Use the ratio to reject trades whose geometry forces an unrealistic win rate, and to standardize risk across trades so a “1R loss” means the same fraction of your account every time (the bridge to position sizing, which uses your per-trade risk to decide how many shares or contracts to buy).
And treat the ratio as one term in expectancy, never a replacement for it. The professional’s question is never “is this at least 2:1?” It is “does this setup’s ratio, times a win rate I can actually defend, net of costs, add up to a positive expectancy — and can I size it so a normal losing streak doesn’t end me?” The ratio is the first, easiest input to that question. It is not the answer.
If you haven’t yet run into the gap between a good ratio and a good outcome, it’s worth picturing the common version. A trader learns the “2:1 minimum” rule, takes it to heart, and starts hunting bigger and bigger ratios — moving targets further out because a 4:1 looks so much better on paper than a 2:1. The setups still trigger, the geometry looks textbook, and the account still bleeds, because every extra dollar of target pushed the target further from where price was actually willing to go, and the win rate quietly fell below the breakeven the ratio demanded. The fix is never a bigger ratio. It’s measuring the win rate the ratio actually earns and choosing the target where the two, multiplied, are largest — which is usually far more modest than the ratio the tutorials sell.
Compute It on Your Own Trade
The Risk/Reward Ratio Calculator turns this from arithmetic into a habit. Enter your entry, stop, and target and it returns the reward-to-risk ratio and — the part most public R:R calculators leave out — the exact breakeven win rate that ratio requires, so you can immediately check it against the win rate you actually have. Like everything on the site it’s an educational model, not a forecast; it computes the geometry of the trade you describe and the win rate that geometry demands, and it deliberately cannot tell you your real win rate — that’s the number only your own honest records can supply.
Where to Go Next
The risk/reward ratio is the entry point to the numbers that actually decide whether a system works:
- Trade Expectancy Explained — the number that combines the ratio and the win rate into the one figure that says whether a system makes money. Read this next; it’s where the ratio’s real meaning lands.
- Position Sizing Rules for Systematic Traders — the ratio defines one trade’s shape; sizing turns your per-trade risk into how much to actually buy, and decides whether a losing streak is survivable.
- Risk of Ruin: Why a Winning System Can Still Blow Up — even a positive-expectancy system with a great ratio can be sized into ruin; this is the survival math.
- Drawdown Explained: The Metric That Matters More Than Win Rate — where a string of losses, each a clean −1R, adds up into the hole you have to climb out of.
- How to Backtest a Trading Strategy the Right Way — the pillar. Where an honest, cost-inclusive, realistic-exit estimate of your ratio and win rate actually comes from.
If you want the plain-English, rigor-first read on building and judging trading systems — the honest version, where every metric comes with what it can’t tell you attached — that’s what the newsletter is for. Subscribe below to get the system-builder’s checklist.
Disclaimer: This article is educational content, not financial advice. I am not a licensed financial advisor, and nothing here is a recommendation to buy or sell any security or asset. Investing and trading involve risk, including the possible loss of the money you invest. Do your own research and consider consulting a licensed financial professional before making investment decisions. Read the full Disclaimer.
Historical and backtested results are hypothetical, carry inherent limitations, and do not guarantee future results. Figures were accurate to the best of my knowledge as of this article’s last-updated date and may have changed.
