How to Backtest a Trading Strategy the Right Way
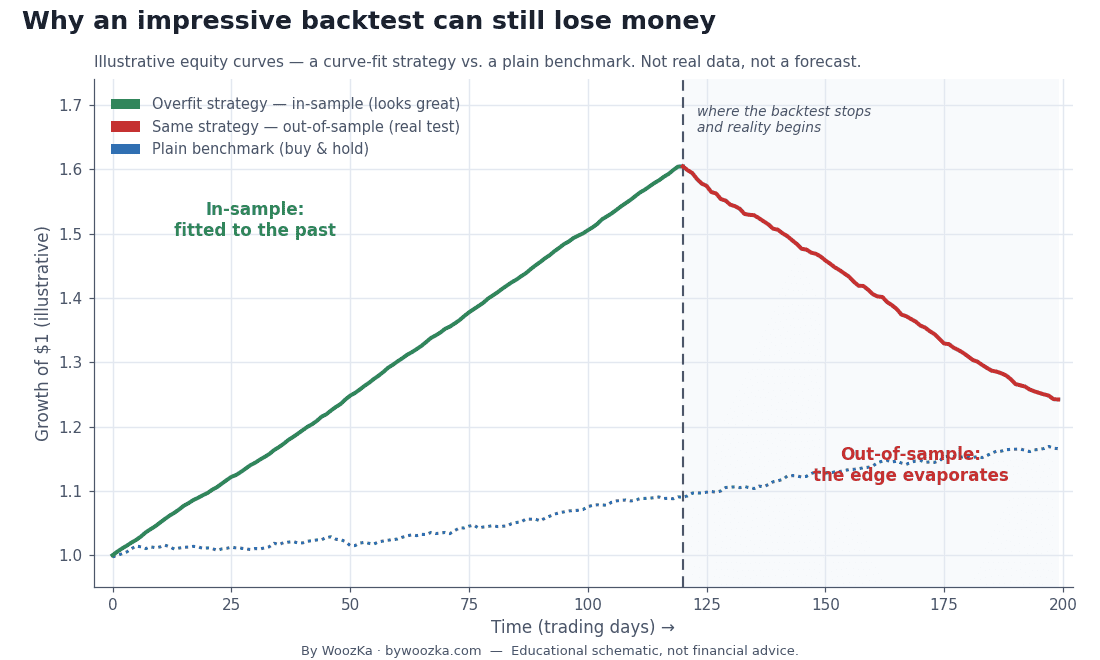 The whole danger in one picture: a strategy tuned to fit the past (green) can look far better than a plain benchmark (blue) — right up until it meets data it was never fitted to (red), where the “edge” disappears. Everything below is about not being fooled by the green part.
A backtest is a simulation. You take a set of trading rules — “buy when this crosses that, sell when the other thing happens” — and run them over historical price data to see how they would have performed. Done well, it is one of the most useful tools a systematic trader has. Done carelessly, it is one of the most dangerous, because a bad backtest doesn’t just fail to help you — it actively lies to you, handing you false confidence right before you risk real money.
Here is the single sentence this entire article exists to defend, and it is the non-negotiable disclaimer for everything in this silo: past backtest performance does not predict future results. A backtest measures how a strategy fit the past, not how it will behave in a future that has not happened yet. That distinction is not fine print at the bottom of this page — it is the subject of this page. This guide is about how to backtest properly, and, just as importantly, how backtests fool the people running them so you can stop being one of them.
Here is the pattern this whole article is about, in miniature. A trader tests a set of rules on ten years of data, tweaks the parameters until the equity curve climbs smoothly, and sees a backtested Sharpe that looks extraordinary. Then the strategy meets data it wasn’t tuned on — the next six months, or a held-out slice — and the beautiful curve flattens or rolls over. Nothing ‘broke’: the backtest was measuring how well the rules fit the past, not how well they’d predict the future. That gap is the most expensive lesson in systematic trading.
What a Backtest Is, and What It Can Never Be
At its core, a backtest answers a narrow, mechanical question: if I had followed these exact rules over this exact period, what would have happened to my account? You feed it historical data, it applies your entry and exit logic bar by bar, and it produces an equity curve and a set of statistics — total return, drawdown, win rate, and so on.
What a backtest is not is a forecast. It is a hypothesis test run on the past. Markets are not a fixed physical system with constant laws; they are a shifting arena of participants, regimes, liquidity conditions, and structural changes. A rule that captured something real in 2015–2020 may be capturing a relationship that no longer exists. Worse, as you’ll see, the very process of searching for good rules on historical data tends to manufacture relationships that were never real to begin with — coincidences dressed up as signals. Treat a backtest the way a scientist treats a promising result from a single experiment: as a reason to test further, never as proof.
The Four Ways a Backtest Lies to You
If you internalize nothing else from this article, internalize these four failure modes. Every blown-up systematic trader has been beaten by at least one of them.
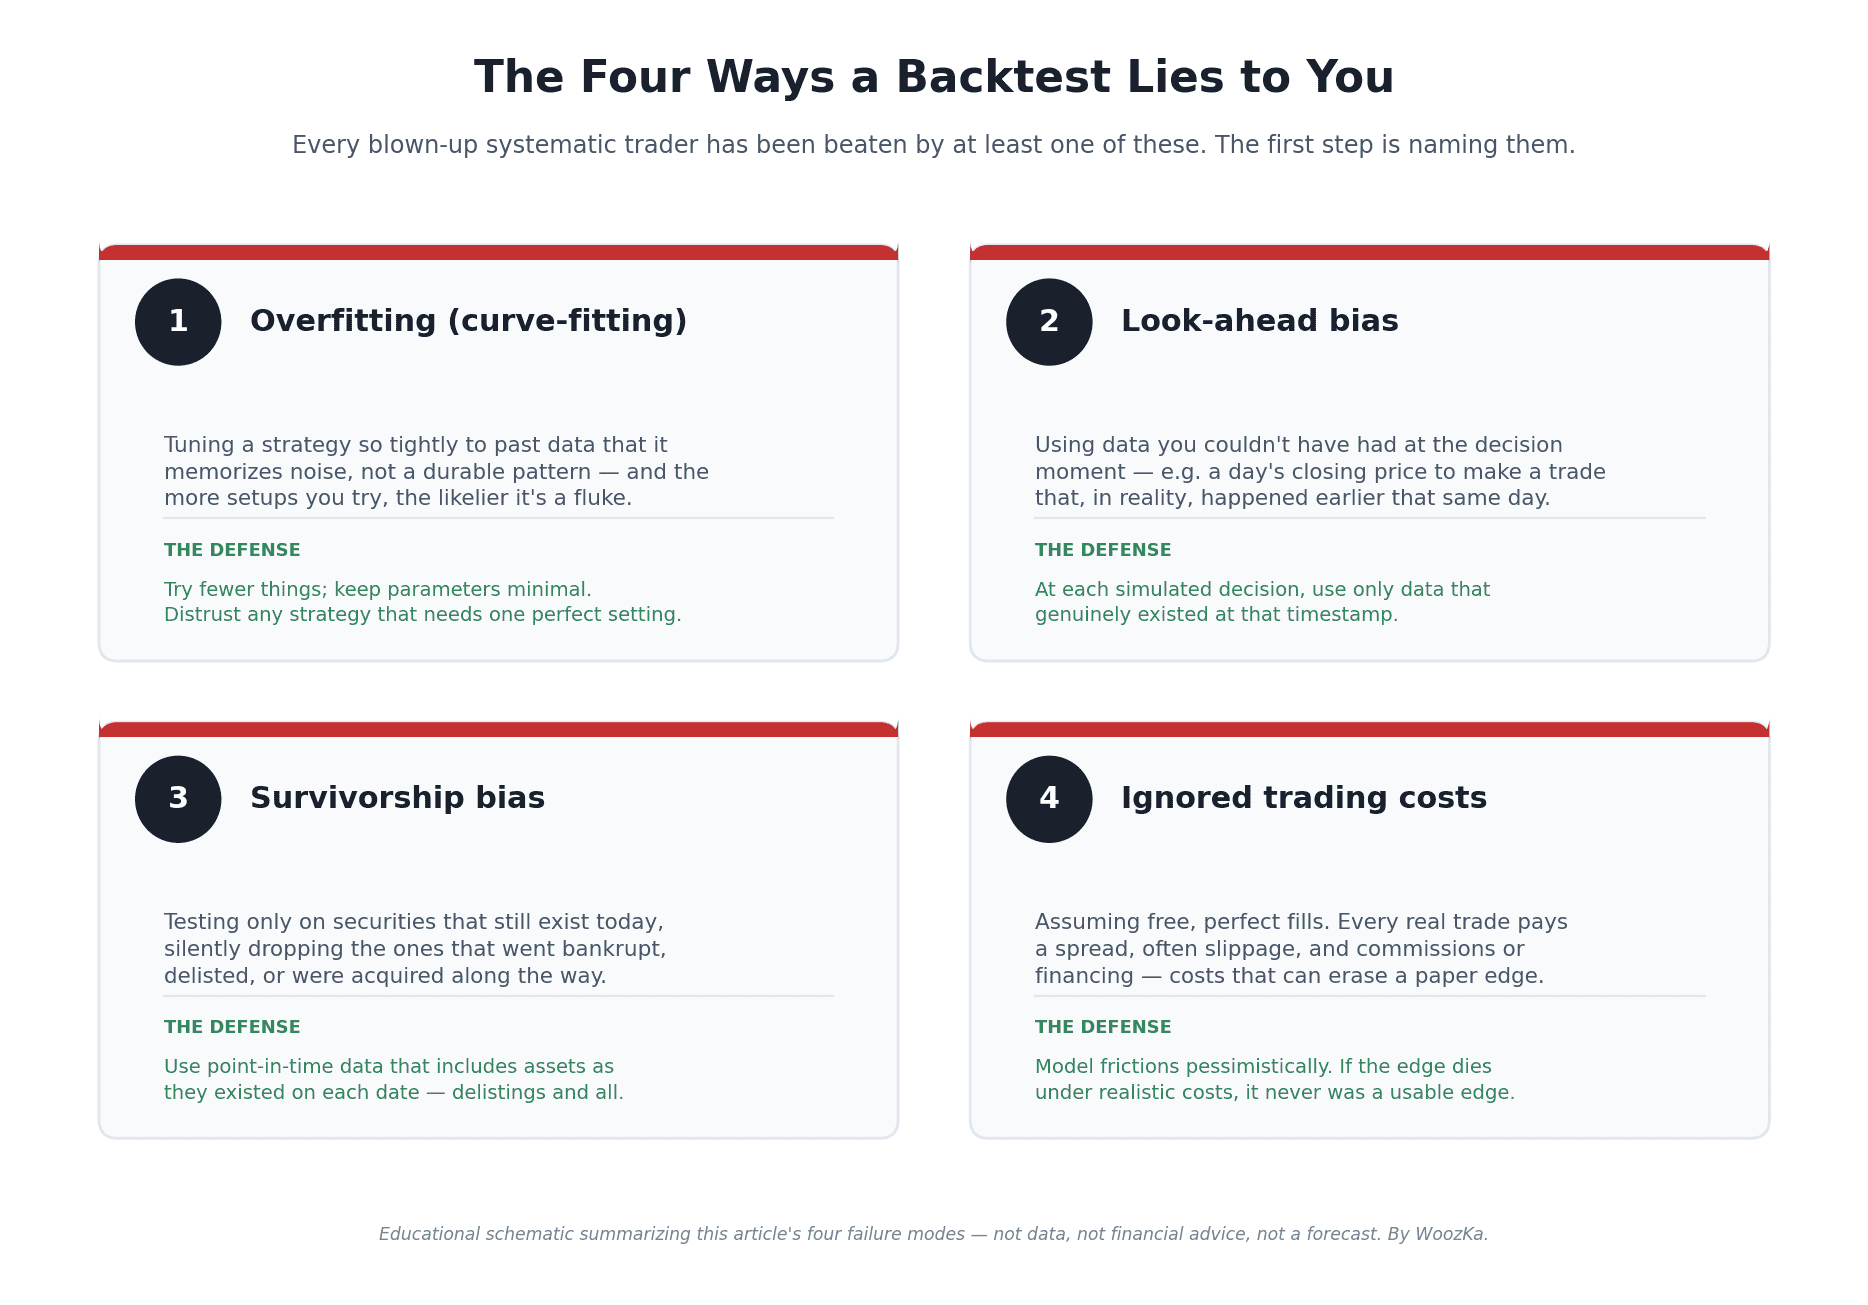 The four traps this section unpacks, side by side — each with its defense. If you remember nothing else, remember these four names; the sections below are simply each one in detail.
1. Overfitting (curve-fitting): the big one
Overfitting is what happens when you tune a strategy so tightly to historical data that it memorizes the past’s noise instead of learning a durable pattern. Add enough rules, filters, and parameters, and you can make almost any backtest look brilliant — you have simply drawn a curve that threads perfectly through points that will never repeat in that exact arrangement.
This is not a vague worry; it has been formalized. In a widely cited 2014 paper in the Notices of the American Mathematical Society, David Bailey, Jonathan Borwein, Marcos López de Prado, and Qiji Zhu showed that high simulated performance is easy to achieve after testing only a relatively small number of alternative strategy configurations — and that the more configurations you try, the higher the probability that your winning backtest is overfit. Their sharper result: under realistic conditions, backtest overfitting doesn’t merely produce a strategy with zero future edge, it can produce one with negative expected out-of-sample returns, which they offer as one reason so many quantitative funds fail [source: Bailey, Borwein, López de Prado & Zhu, “Pseudo-Mathematics and Financial Charlatanism: The Effects of Backtest Overfitting on Out-of-Sample Performance,” Notices of the AMS, 61(5), May 2014]. Because most people never report how many variations they tried before landing on the one they show you, you usually can’t tell how overfit a given backtest is — including your own. The practical defense: try fewer things, keep parameters minimal, and be deeply suspicious of any strategy that only works with one precise, hand-tuned setting. That is the failure the chart at the top of this page illustrates.
2. Look-ahead bias: using information you couldn’t have had
Look-ahead bias is the accidental use of data that would not have been available at the moment a decision was made [source: standard backtesting-methodology references; e.g., QuantifiedStrategies, “Survivorship Bias in Backtesting,” and Auquan, “Backtesting Biases and How to Avoid Them”]. The classic version: your rule uses a day’s closing price to make a decision that, in the simulation, executes during that same day — but in reality you couldn’t have known the close until the day was over. Other versions creep in through data that gets revised after the fact (like economic figures) or through indicators that quietly reference future bars. The result is a backtest that “knew” things it couldn’t have known, inflating performance. The defense is discipline: at every simulated decision point, use only information that genuinely existed at that timestamp.
3. Survivorship bias: testing on the winners that survived
Survivorship bias creeps in when your historical data set includes only the securities that still exist today, silently excluding the companies that were delisted, went bankrupt, or were acquired along the way [source: QuantifiedStrategies, “Survivorship Bias in Trading”; LuxAlgo, “Survivorship Bias in Backtesting Explained”]. If you backtest a stock strategy on today’s index membership, you’ve unknowingly guaranteed that every company in your universe was a survivor — the failures that would have hit your real portfolio simply aren’t in the data. This inflates returns and understates risk, sometimes dramatically. The defense is survivorship-bias-free (“point-in-time”) data that includes assets as they actually existed on each historical date, delistings and all.
4. Ignored trading costs: the profits that don’t survive contact with reality
A backtest that assumes you buy and sell at the exact printed price, for free, is describing a market that doesn’t exist. Every real trade pays a spread (the gap between the bid and the ask), often suffers slippage (getting filled at a slightly worse price than you saw), and may carry commissions or financing costs. For a slow strategy that trades a few times a year, these are a rounding error. For an active strategy that trades daily, realistic costs can turn a beautiful backtested profit into a real-world loss. Model costs honestly and pessimistically — if a strategy’s edge is so thin that it evaporates under reasonable frictions, it never had a usable edge.
The Metrics That Matter — and What They Don’t Capture
A backtest spits out numbers. Knowing what each one honestly measures — and what it hides — is the difference between analysis and self-deception. The brief for this silo is explicit that formulas here must be correct, so here they are, plainly.
Total and annualized return tell you how much the strategy made, but on their own they say nothing about the risk taken to make it. A 40% return earned through stomach-churning swings is not obviously better than a 20% return earned smoothly. Return without risk context is half a sentence.
Maximum drawdown is the largest peak-to-trough decline in the equity curve — the worst loss you would have ridden from a high-water mark down to the subsequent low before a new high. It matters more than most beginners expect, because it measures the pain you’d actually have to survive. A strategy with a 60% max drawdown may be mathematically “profitable” over a decade and still be un-tradeable, because almost no real person holds through a 60% loss without abandoning the plan at the worst moment.
The Sharpe ratio is the most common risk-adjusted return measure. It’s defined as the strategy’s average return in excess of the risk-free rate, divided by the standard deviation of those returns: Sharpe = (R_p − R_f) / σ_p [source: William F. Sharpe’s ratio, as summarized across standard references, e.g., QuantInsti and Investopedia]. A period Sharpe (say, daily) is commonly annualized by multiplying by the square root of the number of periods in a year — for daily returns, √252, reflecting roughly 252 trading days [source: standard convention; e.g., InvestExcel, “How to Annualize a Sharpe Ratio,” and SixFigureInvesting]. But the Sharpe ratio has real blind spots: it treats upside volatility as “risk” just like downside volatility, it assumes returns are reasonably well-behaved (it understates danger when returns have fat tails or serial correlation), and — critically — it says nothing about drawdown path. And because it’s a number people optimize toward, it is itself vulnerable to overfitting; the same researchers behind the overfitting paper proposed a “Deflated Sharpe Ratio” specifically to correct for the selection bias introduced by trying many strategies [source: Bailey & López de Prado, “The Deflated Sharpe Ratio,” Journal of Portfolio Management, 2014]. Use the Sharpe ratio, but never use it alone.
Win rate — the percentage of trades that were profitable — is the metric most likely to mislead a beginner, because a high win rate feels like skill. It isn’t, on its own. A strategy that wins 90% of the time in tiny amounts and loses 10% of the time catastrophically can have a terrible expectancy (average profit per trade, accounting for the size of wins and losses). What you’re actually after is positive expectancy with survivable drawdowns — not a comforting win rate.
A number from my own testing, since this is the section for it: the algorithm I trade now is built from a strategy I’d been running by hand, and it backtests to a profit factor somewhere around 1.4 to 1.5. I assumed that was comfortably enough margin. It isn’t. Under a drawdown limit that’s actually enforced, a strategy sitting nearer a 2 can still be finished off by risk management slipping for a single session. A backtest metric describes the strategy under the assumption that you follow it exactly, every time — which is the one assumption a backtest can’t test.
How to Backtest the Right Way: The Process
Knowing the failure modes, here is the disciplined workflow that guards against them.
Split your data before you touch it. Divide your history into an in-sample period (where you’re allowed to develop and tune the strategy) and an out-of-sample period (which you set aside and do not look at during development). You build on the in-sample data, then test — once — on the out-of-sample data you’ve never touched. If performance holds up on data the strategy has never seen, that’s a genuine signal. If it collapses, you’ve caught an overfit strategy before it cost you money instead of after. This is exactly the split drawn in the chart above.
Use walk-forward analysis for anything you plan to trade seriously. A single in-sample/out-of-sample split is good; walk-forward analysis is better. Popularized in systematic trading by Robert Pardo in The Evaluation and Optimization of Trading Strategies, walk-forward analysis optimizes a strategy on one window of history, tests it on the next unseen window, then rolls both windows forward and repeats — stitching the out-of-sample segments together into a composite equity curve that far better reflects how the strategy would have adapted through changing conditions [source: Robert Pardo, The Evaluation and Optimization of Trading Strategies, 2nd ed., Wiley, 2008; summarized in walk-forward methodology references]. Pardo’s own first line of defense against overfitting is blunt and worth repeating: keep the number of optimizable parameters to a minimum.
Model costs and frictions pessimistically. Build in realistic spreads, slippage, and commissions from the start, not as an afterthought. If you’re unsure, err high. A strategy that only works under frictionless assumptions is a strategy that only works in a spreadsheet.
Forward-test (paper trade) before you commit capital. Out-of-sample historical data is data the strategy hasn’t seen, but it’s still the past. Forward testing — running the strategy on live, incoming data without risking money — is the closest thing to a true out-of-sample test, because it’s happening in a market that genuinely doesn’t know your rules exist. It’s slow, and that slowness is the point: it forces the patience that overfitting punishes.
This is exactly why walk-forward testing exists: optimize on one window, then test on the next unseen window, and repeat — so the number you trust always comes from data the strategy never saw while it was being tuned. It’s also why costs deserve as much scrutiny as signals. A strategy that looks profitable at zero commissions and zero slippage can be a net loser once realistic execution costs are subtracted, especially for anything that trades frequently.
A Word on Automation: It’s a Tool, Not an Edge
Once a strategy is rules-based, it’s natural to want to automate its execution — to have software enter and exit trades according to your conditions so emotion and manual error stay out of it. Automation platforms exist for exactly this, and used well they remove a real source of slippage between plan and action.
But be very clear about what automation does and doesn’t do. Automating a bad or overfit strategy doesn’t fix it — it just loses money faster and more consistently, without the hesitation that might have saved you. Automation removes emotional and manual-execution error; it does not add profitability, and it is no substitute for the backtesting and overfitting rigor that is this article’s entire subject. The edge, if there is one, lives in the strategy and the discipline behind it — never in the fact that a bot is clicking the buttons. (This blog’s separate, regularly updated “Best Backtesting Platforms Compared” article is where specific tools — including options-execution automation — are reviewed with current pricing and an affiliate disclosure; that’s the right place for product specifics, not this methodology pillar.)
The Habits That Wreck a Backtest
- Trusting a beautiful equity curve. The smoother and steeper the in-sample curve, the more suspicious you should be that it was fit to noise. Reality is rarely that clean.
- Optimizing until it works. Every parameter you add and every variation you test raises your overfitting risk. The number of things you tried is itself a hidden cost you rarely account for.
- Peeking at out-of-sample data. The moment you tweak the strategy after seeing out-of-sample results, that data is no longer out-of-sample — you’ve contaminated your only honest test.
- Backtesting on survivor-only universes. If your data excludes the companies that failed, your results describe a world that was never available to trade.
- Assuming free, perfect fills. Costs and slippage are where paper profits go to die. Model them from the first run.
- Confusing a high win rate with an edge. Expectancy and drawdown decide whether a strategy is survivable; win rate alone can hide a time bomb.
The Fourth Trap, Priced on This Article’s Own System
Of the four ways a backtest lies, three are named above with a defense and no magnitude. The fourth — ignored trading costs — is the one this article already publishes enough to settle exactly, because it closes with a complete worked system: a 40% win rate, a $600 average winner, a $300 average loser, an expectancy of +$60 a trade, a profit factor of 1.33, a breakeven win rate of 33.3%, and +$6,000 over 100 trades. Those figures sit in the closing paragraph; the costs warning sits five sections earlier; and the two are never multiplied. Doing so settles three things the article states as judgments. Every input below is a number this article already publishes, and every output was produced by the shipped Trade Expectancy Calculator and checked again in separate code before it was reported.
The Cost That Ends This Strategy Is the Strategy’s Own Edge
Charge a round-trip cost of c on every trade — spread, slippage and commission together — so each winner arrives at $600 − c and each loser leaves at $300 + c. The first result is that the cost comes straight off the top: expectancy falls to exactly $60 − c, one dollar per dollar. That is not a feature of a 40% win rate; it holds at every win rate from 5% to 95%, checked on 91 rows, because the winners pay the cost in proportion to how often they happen and the losers pay it in proportion to how often they do not.
| Cost per round trip | Net expectancy | Profit factor | Win rate then required | Over 100 trades |
|---|---|---|---|---|
| $0 | $60.00 | 1.3333 | 33.333% | $6,000 |
| $10 | $50.00 | 1.2688 | 34.444% | $5,000 |
| $20 | $40.00 | 1.2083 | 35.556% | $4,000 |
| $30 | $30.00 | 1.1515 | 36.667% | $3,000 |
| $45 | $15.00 | 1.0725 | 38.333% | $1,500 |
| $60 | $0.00 | 1.0000 | 40.000% | $0 |
The last row is the point of the table. Because the cost is added to the loser exactly as it is taken from the winner, the two averages always sum to $900 whatever c is, so the required breakeven win rate is simply (300 + c) ÷ 900 — a straight line. It reaches 40.000% when c reaches $60, which is the strategy’s own win rate, so the strategy needs to be exactly as good as it already is and has nothing left over. That killing cost is 10% of the average winner and 6.667% of the distance between a full winner and a full loser. Nothing about the rules changed; the article’s +$6,000 became $0.00, and its profit factor of 1.33 became exactly 1.
Frequency Is Not the Variable — Edge Size Is
The article says costs are “a rounding error” for a strategy that trades a few times a year and can be fatal for one that trades daily. In dollars that is plainly true, and in survival terms it credits the wrong variable. A fixed $20 cost against a fixed +$60 edge takes 33.33% of that edge at five trades a year and 33.33% of it at a thousand: both sides scale with the trade count, so the count cancels and cannot decide whether the strategy lives. What decides it is the ratio of the cost to the per-trade edge. Below, the same 2:1 payoff and the same 40% win rate are held fixed and only the size of the trade changes.
| Average winner | Average loser | Edge before costs | Edge after $20 | Share of the edge gone |
|---|---|---|---|---|
| $600 | $300 | $60.00 | $40.00 | 33.3% |
| $300 | $150 | $30.00 | $10.00 | 66.7% |
| $200 | $100 | $20.00 | $0.00 | 100.0% |
| $150 | $75 | $15.00 | −$5.00 | 133.3% |
| $60 | $30 | $6.00 | −$14.00 | 333.3% |
Every row has the identical win rate, the identical payoff ratio and the identical profit factor before costs; the bottom two are losing strategies anyway. The break point is exact and needs no search: the system dies where its pre-cost edge equals the cost, which is the $200 / $100 row. So the article’s rule of thumb is right about which strategies get hurt and wrong about why — frequent traders suffer not because they trade often but because chasing many trades usually means accepting a smaller edge on each one, and the leverage against them is severe. For this system the amplification is the average winner divided by the expectancy, exactly 10×: every 1% of the average winner paid away in frictions removes 10% of the edge.
The Metric That Cannot See Any of This
The article’s last habit-to-avoid is confusing a high win rate with an edge, and its metrics section says win rate is the number most likely to mislead a beginner. Costs make that case better than the argument does, because they are literally invisible to it. A $20 cost does not change which trades won; it changes only what the winners and losers were worth. Here is one $20 cost as each reported number shows it.
| What the backtest reports | Costs ignored | Costs at $20 | Move |
|---|---|---|---|
| Win rate | 40.00% | 40.00% | 0.000% |
| Profit factor | 1.3333 | 1.2083 | −9.375% |
| Expectancy per trade | $60.00 | $40.00 | −33.333% |
| Margin over breakeven | 6.667 pts | 4.444 pts | −33.333% |
| Total, 100 trades | $6,000 | $4,000 | −33.333% |
Win rate reports nothing at all, and profit factor — the metric that looks like the grown-up alternative — reports a 9.375% deterioration where the money fell 33.333%, understating the damage by 3.5556×. The bottom three rows move together to the last decimal, and that is an identity rather than a coincidence: expectancy equals the sum of the two averages multiplied by the margin over the breakeven win rate, and that sum is fixed at $900 no matter what the cost is, so the edge and the margin can only ever move by the same percentage. Checked at every dollar from $0 to $60. The practical reading is narrow and worth stating plainly: of the numbers a backtest hands you, only the ones denominated in money will tell you a cost assumption was optimistic.
This section reworks the article’s own numbers; here is how far that goes. Every input above — the 40% win rate, the $600 and $300 averages, the +$60 expectancy, the 1.33 profit factor, the 33.3% breakeven and the +$6,000 over 100 trades — is a figure this article already publishes, and all four of those published results were recomputed and confirmed before anything was built on them. Every output came from the site’s shipped Trade Expectancy Calculator, called directly, and separate code checks each returned value to fifteen decimals before it is reported. The cost model is deliberately the simplest one that is honest: a single round-trip charge applied to every trade, taken from the winner and added to the loser, which is how spread, slippage and commission actually land. It assumes the cost does not change the trades you take — in reality a wider spread also removes marginal setups — and it ignores financing and taxes, both of which make the picture worse rather than better. The dollar amounts are the article’s illustration and not a measurement of any real strategy; the results that matter here are the ratios and the break points, which do not depend on the dollar scale. Nothing above is a forecast, a strategy recommendation, or a claim that this or any system has an edge, and, as the article says throughout, backtested figures describe a fit to the past and do not predict future results.
Building on This Pillar
This pillar is the foundation; the rest of the Trading Systems cluster builds the specifics on top of it:
- What Is Overfitting in Backtesting (And How to Avoid It) — a deeper dive into the single most important failure mode above.
- Why Most Trading Systems Fail Out-of-Sample — the companion piece on what really happens when a backtest meets live markets.
- Walk-Forward Analysis: Testing a Strategy Like a Quant — the full mechanics of the rolling out-of-sample method introduced here.
- Moving Averages Explained: SMA vs EMA, RSI Explained, MACD Explained, and Bollinger Bands Explained — what these indicators actually measure and their known false-signal patterns, so you build rules on honest components.
- Position Sizing Rules for Systematic Traders — because how much you risk per trade decides whether a real edge survives its own drawdowns.
If you want the plain-English, rigor-first read on building and testing systems — explained honestly, never hyped — that’s what the newsletter is for. Subscribe below.
Why win rate misleads, in numbers: a system that wins just 40% of the time with an average win of $600 against an average loss of $300 has an expectancy of +$60 per trade, a profit factor of 1.33, and a breakeven win rate of 33.3%. Over 100 trades that is +$6,000 from a strategy that loses more often than it wins. The Trade Expectancy Calculator turns a win rate and average win/loss into expectancy, profit factor, and the win rate you would need just to break even.
Disclaimer: This article is educational content, not financial advice. I am not a licensed financial advisor, and nothing here is a recommendation to buy or sell any security or asset. Investing and trading involve risk, including the possible loss of the money you invest. Do your own research and consider consulting a licensed financial professional before making investment decisions. Read the full Disclaimer.
Historical and backtested results are hypothetical, carry inherent limitations, and do not guarantee future results. Figures were accurate to the best of my knowledge as of this article’s last-updated date and may have changed.
