Position Sizing Rules for Systematic Traders
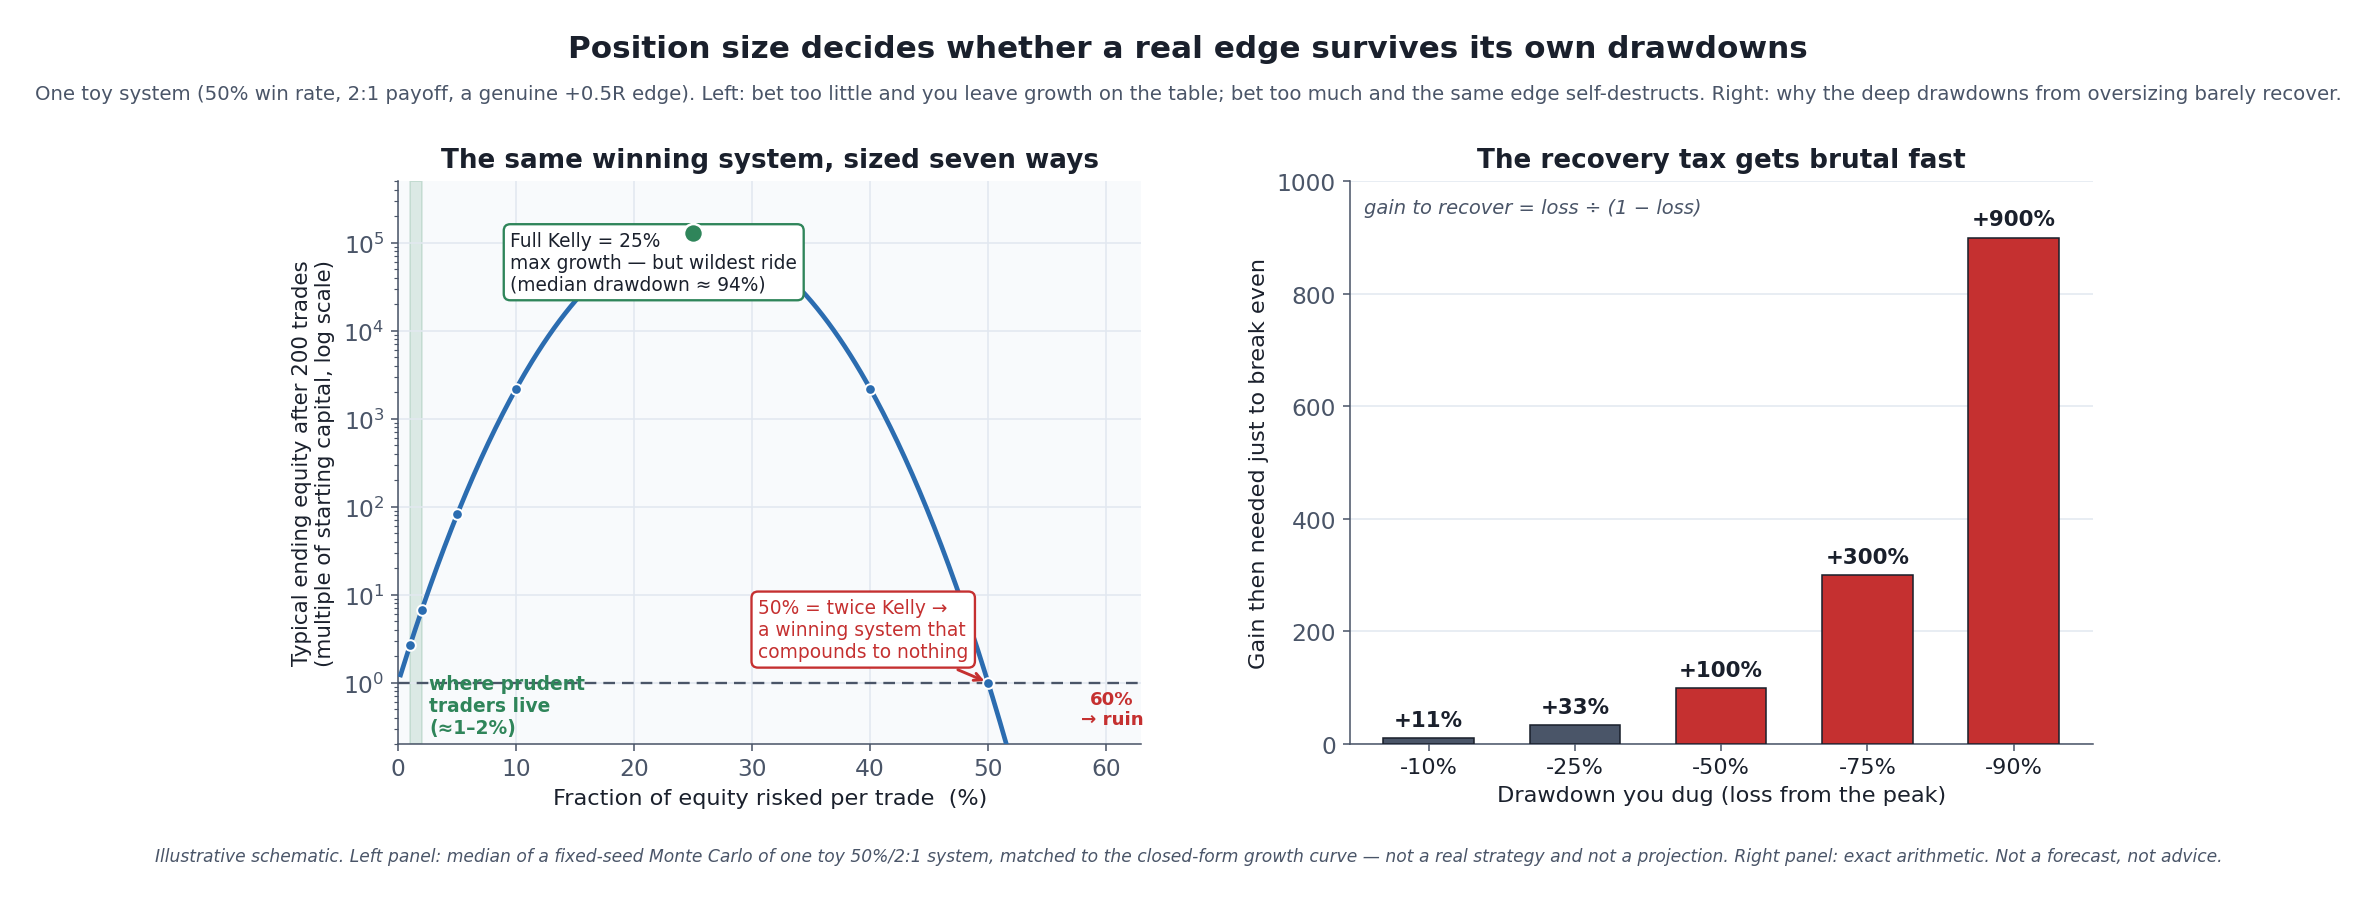 The whole article in one picture. Left: one genuinely profitable toy system, bet at seven different sizes. Bet too little and you leave growth on the table; bet too much and the identical edge self-destructs — the growth curve peaks and then falls off a cliff, even though the system never changed. Right: why the deep drawdowns that oversizing creates are a trap — a 50% loss needs a 100% gain just to get back to even. Everything below is about landing in the shaded zone on the left, not the cliff.
Most traders spend ninety percent of their effort on the entry — the perfect indicator, the ideal signal, the exact bar to buy. The entry is the least important decision you make. Position sizing — how much of your account you put at risk on each trade — is the decision that determines whether a genuinely good strategy makes you money or quietly ruins you. This article is about that decision, treated the way a systematic trader should treat it: as a rule, computed the same way every time, backtested and stress-tested like any other part of the system.
This is a trading-systems article, so the silo’s non-negotiable disclaimer governs every line of it: past backtest performance does not predict future results. Position sizing does not create an edge and cannot rescue a bad strategy — a bot sizing a losing system perfectly just loses money in an orderly fashion. Everything here assumes you have already done the hard, humbling work of establishing that your edge is real and not an artifact of overfitting. Sizing is what you do after that, to keep a real edge alive.
Risk Per Trade Is Not Position Size
The single most common beginner confusion is treating “how many shares I buy” and “how much I can lose” as the same number. They are not, and the whole discipline starts with separating them.
Position size is how much exposure you take — the notional value of the trade. Risk per trade is how much you actually lose if the trade goes against you and you exit at your stop: the distance from your entry to your stop-loss, multiplied by your position size. You control your risk by choosing your position size and your stop together, not by staring at the notional.
Alexander Elder made this concrete with what he called the 2% Rule in Trading for a Living: the money you risk on any single trade should never exceed 2% of your account equity, where “risk” means the dollar distance from entry to stop times the number of shares or contracts [source: Alexander Elder, Trading for a Living, Wiley, 1993; The New Trading for a Living, Wiley, 2014]. On a $100,000 account, that caps your loss on any one trade at $2,000 — but the position can be far larger than $2,000. If you buy a $50 stock with a stop at $48, you are risking $2 per share, so the 2% cap lets you buy 1,000 shares — a $50,000 position that risks only $2,000 [source: worked example after Elder’s 2% Rule; financial-spread-betting.com, “Amount to Risk per Trade and the 2% rule”]. Elder is explicit that 2% is a ceiling, not a target: “Good traders tend to stay well below the 2% limit,” and most professionals risk closer to 1% [source: Elder, Trading for a Living].
That relationship is the engine of every sizing rule worth knowing. Rearranged, it gives you the fixed-fractional formula, the workhorse of systematic sizing:
Shares (or contracts) = (Account equity × Risk fraction) ÷ (Entry − Stop distance)
Pick the fraction of your account you are willing to lose, decide where the trade is wrong (the stop), and the position size falls out as arithmetic. Notice what this does automatically: a wide stop forces a smaller position, a tight stop allows a larger one, and both risk the same dollars. Your bet size stops being a gut feeling and becomes an output.
Elder pairs the 2% Rule with a 6% Rule — halt new trades for the month once your total risk from open positions plus losses already taken reaches 6% of equity — precisely so that a cluster of correlated positions can’t quietly add up to a catastrophic bet even when each one obeys the 2% cap [source: Elder, Trading for a Living, Wiley, 1993]. Per-trade discipline is necessary but not sufficient; portfolio-level caps catch the risk that per-trade rules miss.
Why Sizing Matters More Than Your Entry
This sounds like an exaggeration until you see the demonstration that made it famous. In his book Trade Your Way to Financial Freedom, Van Tharp — who did more than anyone to popularize the term “position sizing” — recounts a 1991 seminar with trader Tom Basso. Basso was explaining that the most important parts of his system were his exits and his position-sizing rules, and an attendee pushed the logic to its limit: it sounded like you could make money with a random entry, as long as your exits and sizing were sound [source: Van K. Tharp, Trade Your Way to Financial Freedom, McGraw-Hill, 1998; turtletrader.com, “Van Tharp”].
So they tested it. Their “coin-flip” study entered long or short at random across a basket of about ten diversified futures markets, using a simple volatility-based trailing stop to cut losers and let winners run, and sizing each position so that risk was equalized across markets. It made money [source: Tharp, Trade Your Way to Financial Freedom, 1998]. A 2016 re-test of the same rules across twenty runs found the approach still turned a profit in most cases [source: “Revisiting Tom Basso: How Important is Your Entry?”, Nasdaq/InvestingLive, 2016].
Read that result carefully, because it is easy to draw the wrong lesson. It does not mean entries are irrelevant or that you can trade randomly and be fine — the profit depended entirely on disciplined exits, broad diversification across uncorrelated markets, and a large enough account to survive the drawdowns along the way. What it does mean is that the two decisions traders obsess over least — when to get out and how much to bet — carry more of the load than the one they obsess over most. Position sizing is not a footnote to your strategy. In a real sense, it is the strategy’s risk profile.
The Math That Makes Sizing Non-Negotiable
The reason sizing is so decisive comes down to two pieces of arithmetic that most trading content skips.
First: losses and gains are not symmetric. A drawdown of d percent requires a gain of d ÷ (1 − d) just to get back to where you started — always more than the loss itself, and dramatically more as the hole deepens. Lose 10% and you need +11.1% to recover. Lose 25% and you need +33.3%. Lose 50% and you need +100% — you have to double what’s left. Lose 90% and you need +900% just to break even [source: standard arithmetic of drawdown recovery; the right panel of the chart above]. This is not a market opinion; it is division. It is also why oversizing is a trap that springs late: the same overbetting that produces spectacular gains on the way up produces the deep drawdowns that are nearly impossible to climb out of on the way down.
Second: trading compounds, so the size of each bet feeds the next one. Because you’re risking a fraction of a changing balance, your long-run result is a product of many multiplications, not a sum. And here is the counterintuitive consequence, drawn out in the left panel of the chart: take one genuinely profitable system and bet it at different sizes, and growth does not just keep rising with bet size. It rises to a peak and then collapses — and past a certain point, a system with a real, positive edge compounds to nothing, and then to ruin. The edge never changed. Only the bet size did.
This is the domain that Ralph Vince formalized as optimal f — the single fixed fraction that maximizes long-run geometric growth for a given system, derived from its actual trade history [source: Ralph Vince, Portfolio Management Formulas, Wiley, 1990; The Mathematics of Money Management, Wiley, 1992]. Vince’s central and sobering finding is that betting a positive-expectancy system too large can still lead to ruin, and that even betting exactly the growth-optimal fraction produces drawdowns most humans could never stomach — accounts run at full optimal f have endured drawdowns on the order of 90%-plus [source: Vince, The Mathematics of Money Management, 1992; turtletrader.com, “Optimal F”; bettersystemtrader.com interview with Ralph Vince]. The math that maximizes growth and the math that keeps you sane are two different objectives, and the gap between them is where every practical sizing rule lives.
How Much Is Too Much? Kelly and the Case for Betting Small
The clean way to see the peak-and-collapse is the Kelly criterion, published by Bell Labs researcher John Kelly in 1956 [source: J. L. Kelly Jr., “A New Interpretation of Information Rate,” Bell System Technical Journal, 35(4): 917–926, 1956]. Kelly gives the fraction of capital to bet to maximize the long-run geometric growth rate — equivalently, to maximize the expected logarithm of wealth. For a simple win/loss bet it is:
f* = p − q ÷ b
where p is the win probability, q = 1 − p is the loss probability, and b is the reward-to-risk ratio (how many units you win per unit risked) [source: Kelly, 1956; quantitative-finance summaries of the Kelly criterion, 2026].
Take the toy system used throughout the chart above: it wins 50% of the time and pays 2:1 (a win makes twice what a loss costs). Its per-trade expectancy is a genuinely positive +0.5 units of risk. Its Kelly fraction is f* = 0.5 − 0.5 ÷ 2 = 0.25 — full Kelly says bet 25% of your equity on every trade. Run that through a simulation of 200 trades and full Kelly does indeed produce the highest typical ending balance of any fixed fraction. It also produces a median drawdown of roughly 94% along the way [source: fixed-seed Monte Carlo of the toy system, left panel of the chart above — illustrative, not a projection]. Nobody trades like that.
The picture gets sharper past the peak. Because the growth curve is symmetric in a specific sense, risking 40% earns the same long-run growth as risking 10% — same reward, far more pain. Risk twice the Kelly fraction (50% here) and a genuinely winning system compounds, over the long run, to break-even: all that edge, converted into zero. Risk more than that and it trends to ruin [source: closed-form geometric-growth curve G(f) = p·ln(1+bf) + (1−p)·ln(1−f) for the toy system; the property that growth turns negative beyond 2× Kelly is standard]. This is the precise, checkable version of Vince’s warning: overbetting doesn’t just reduce your edge, it can invert it.
So why does everyone sane bet a small fraction of Kelly — a half, a quarter, or far less? Two reasons, and they are the heart of prudent sizing:
- The ride. Fractional Kelly gives up a little growth to cut volatility and drawdown enormously. Betting half-Kelly captures roughly three-quarters of the growth with a fraction of the drawdown — a trade most people take gladly [source: quantitative-finance literature on fractional Kelly, widely summarized 2026].
- You don’t actually know your numbers. The Kelly formula assumes you know p and b exactly and that they never change. In real markets you have estimates of your win rate and payoff, measured with error on a limited, possibly overfit sample, and the true values drift as conditions shift. Betting full Kelly on an overestimated edge puts you past the peak and onto the cliff without knowing it. Sizing well below Kelly is the margin of safety for being wrong about your own edge — which you routinely will be.
That is why the widely cited conventions — Elder’s ≤2%, most pros’ ~1% — sit far to the left of the mathematical optimum. They are not timid; they are the deliberate choice to under-bet a number you can’t trust, in exchange for surviving long enough for the edge to show up. What your own number should be is genuinely yours to set: it depends on how confident you are the edge is real, how much drawdown you can tolerate without abandoning the system, and how correlated your positions are. This article gives you the math to reason about it, not a figure to copy.
Risk of Ruin: The Number That Should Set Your Ceiling
Everything above rolls up into one concept worth computing before you trade a system live: risk of ruin — the probability that a string of losses drives your account below a threshold you’ve defined as game-over. Risk of ruin depends on three things together: your win rate, your reward-to-risk ratio, and — critically — how much you bet per trade [source: standard risk-of-ruin analysis; QuantifiedStrategies.com, “The Risk of Ruin in Trading”; Vince, Portfolio Management Formulas, 1990].
The lesson the formula teaches is the one the chart shows: hold the edge fixed and raise the bet size, and risk of ruin climbs — gently at first, then steeply. In the toy system, risking 1–2% per trade produces essentially no chance of a 50%-plus drawdown over 200 trades; risking 10% pushes the odds of a 50%-plus drawdown above three-quarters; at full Kelly it becomes a near-certainty [source: fixed-seed Monte Carlo of the toy system used for the chart above — illustrative, not a projection]. A positive expectancy tells you the system makes money on average, given infinite trials and infinite capital. Risk of ruin tells you whether you’ll still be in the game to collect. Systematic traders size to keep risk of ruin negligible, then let the edge compound — not the other way around.
Running the Numbers: Exposure, Growth, and Ruin
Three sections above make claims that are exactly checkable and were never shown: that a tight stop “allows a larger” position, that growth “rises to a peak and then collapses,” and that risk of ruin climbs “gently at first, then steeply.” Here they are as numbers. The exposure and ruin tables below were produced by the two calculators this site already publishes, and the growth table by the closed form this article already quotes — so nothing here rests on arithmetic you have to take on trust. Every cell is reproducible in your own browser.
One Risk Rule, Five Stops
Take the worked example from the end of this article and change one thing. The account stays at $25,000, the entry stays at $50.00, and the rule stays at 1% of equity — so every row below risks exactly $250. Only the stop moves. Each row is one run of the Position Size Calculator.
| Stop distance | Shares | Position | % of account |
|---|---|---|---|
| 1% | 500 | $25,000 | 100% |
| 2% | 250 | $12,500 | 50% |
| 5% | 100 | $5,000 | 20% |
| 10% | 50 | $2,500 | 10% |
| 20% | 25 | $1,250 | 5% |
The third row is the one this article already publishes — 100 shares, $5,000, 20% of the account — and it reproduces exactly. Read the last column down and the point of the section on confusing size with risk becomes concrete: the same rule, obeyed identically every time, sanctions a position anywhere from 5% to 100% of the account. A 1% risk rule can put your entire balance into a single trade and still be followed to the letter, because the rule constrains what you lose if the stop is hit, not what you hold. Push it one step further: at Elder’s 2% ceiling with that same 1% stop, the arithmetic returns 1,000 shares worth $50,000 — 200% of a $25,000 account, a leveraged bet that breaks no rule stated here. That gap is the whole reason Elder pairs the 2% Rule with a portfolio-level 6% Rule, and the reason a stop is a sizing input rather than an afterthought.
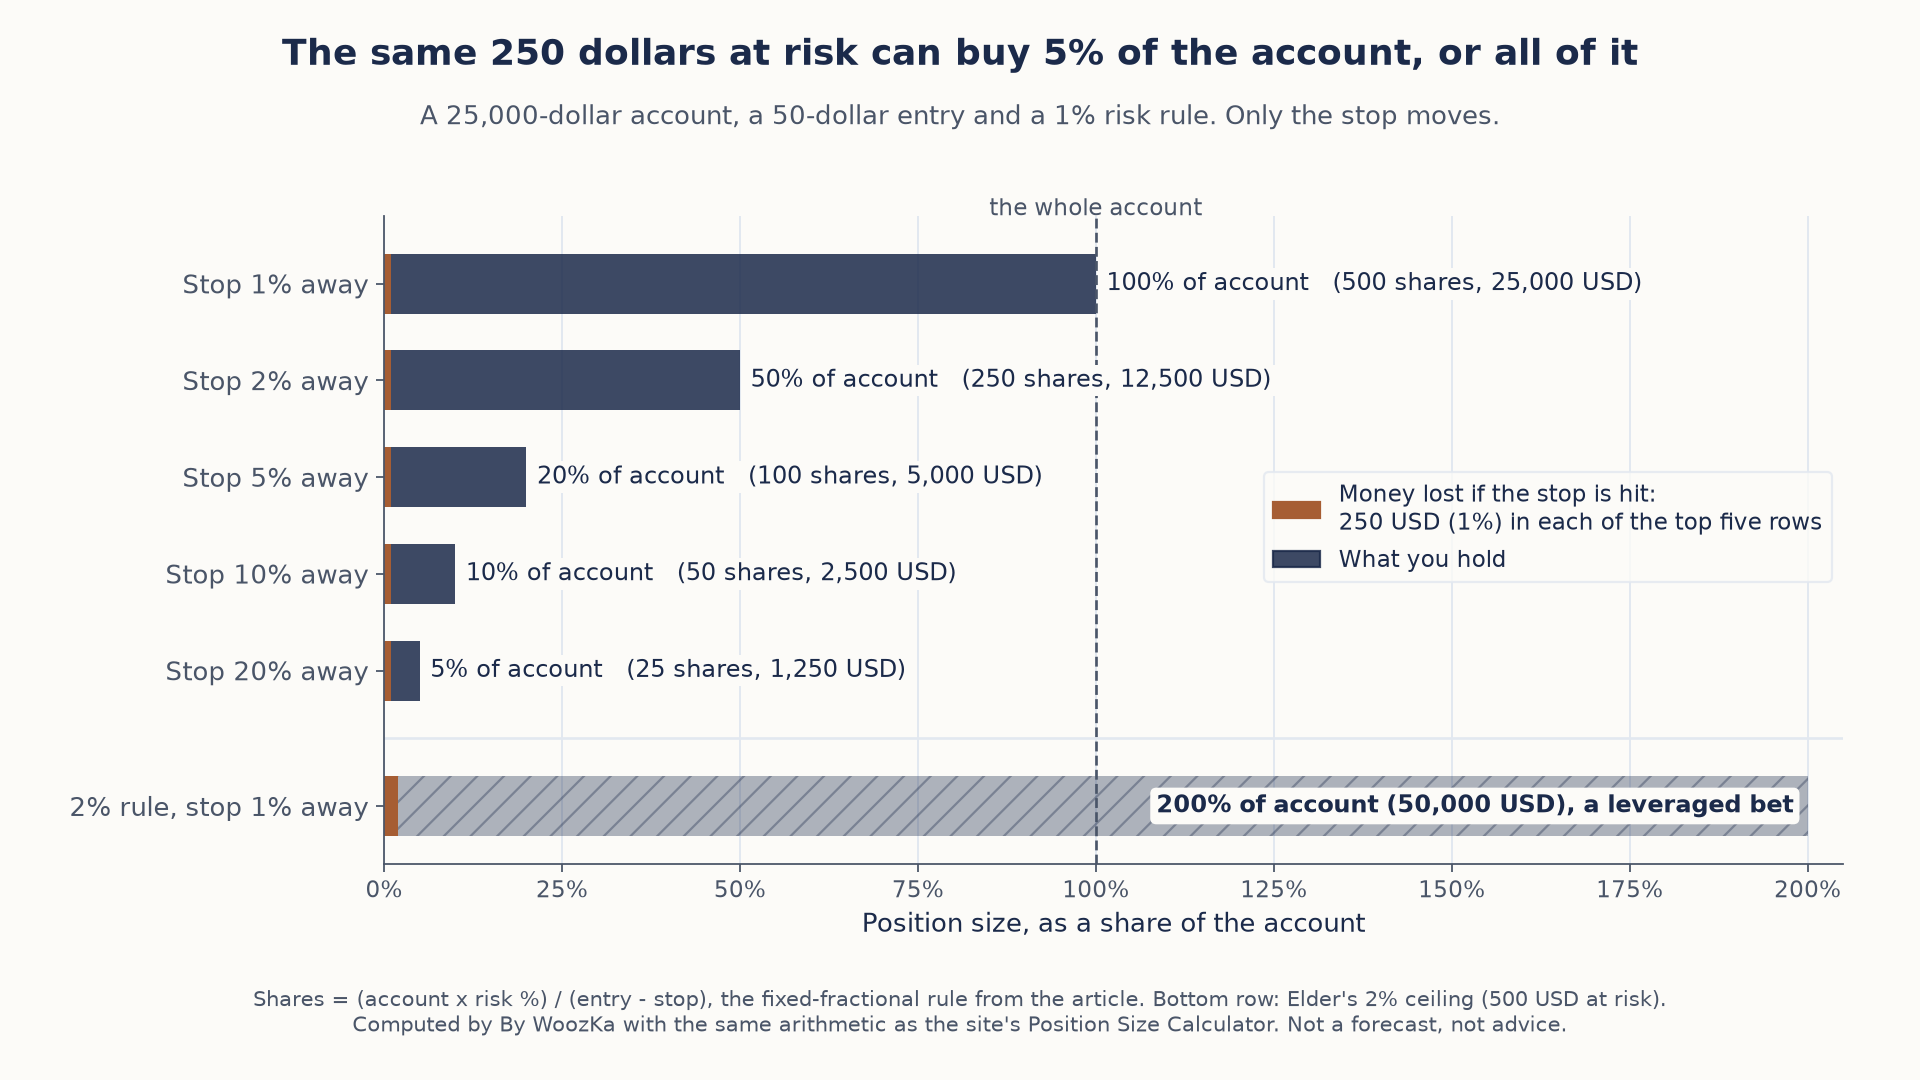 The risk rule fixes what you lose if the stop is hit, not what you hold: the same 250 dollars at risk sanctions anything from 5% to 100% of the account, and a 2% rule with a tight stop sanctions a position twice the account’s size.
The Growth Curve, Computed
The closed form quoted above — G(f) = p × ln(1 + bf) + (1 − p) × ln(1 − f) — needs no simulation and no seed. For the toy system used throughout this article (50% wins, 2:1 payoff, Kelly fraction 25%), it is one line of arithmetic per row. The last column compounds that growth rate over the 200 trades the chart uses.
| Risked per trade | × Kelly | Growth per trade | Typical, 200 trades |
|---|---|---|---|
| 1.0% | 0.04× | 0.004876 | ×2.65 |
| 2.0% | 0.08× | 0.009509 | ×6.70 |
| 5.0% | 0.20× | 0.022008 | ×81.59 |
| 10.0% | 0.40× | 0.038481 | ×2,200 |
| 12.5% | 0.50× | 0.044806 | ×7,795 |
| 25.0% | 1.00× | 0.058892 | ×130,392 |
| 40.0% | 1.60× | 0.038481 | ×2,200 |
| 50.0% | 2.00× | 0.000000 | ×1.00 |
| 60.0% | 2.40× | −0.063917 | ×0.0000028 |
All three claims hold, and two of them are identities rather than approximations. Risking 10% and risking 40% produce the same growth rate to fifteen decimal places — both 0.038480520568064, not merely close — so the four-fold larger bet buys literally nothing but a rougher ride. At twice Kelly the two logarithms are ln(2) and ln(0.5), which annihilate: growth is exactly zero, and a system with a real, positive edge compounds over the long run to precisely the balance it started with. One row further down it is negative. And half-Kelly keeps 76.08% of peak growth for half the bet, which is the arithmetic behind this article’s point that the conventional 1% to 2% is a deliberate trade rather than timidity: the left end of this table gives up far less growth than its distance from the peak suggests.
Risk of Ruin Is a Ratio
The heading above calls risk of ruin “the number that should set your ceiling.” Run the same toy system through this site’s Risk of Ruin Simulator, with ruin defined as being 50% below where you started, and the ceiling gets specific.
| Risked per trade | Units to −50% | Risk of ruin |
|---|---|---|
| 1.0% | 50 | 0.0000000036% |
| 2.0% | 25 | 0.0005960861% |
| 5.0% | 10 | 0.8131% |
| 10.0% | 5 | 9.0170% |
| 12.5% | 4 | 14.5898% |
| 25.0% | 2 | 38.1966% |
In plain odds that is roughly 1 in 28 billion at 1%, about 1 in 11 at 10%, and about 1 in 2.6 at the growth-optimal bet — the same system, the same edge, differing only in bet size. The middle column is why the curve bends the way it does. The simulator only ever sees units: how many consecutive risk-sized losses separate you from your threshold. Ruin is that root raised to the number of units, so halving the risk per trade squares the probability of ruin — 38.20% becomes 14.59%, which becomes 2.13% — and the fall accelerates precisely because squaring a number below one is brutal. It also means the threshold and the bet size matter only through their ratio: risking 1% against a 50% threshold and risking 2% against a total wipeout are the identical calculation, so cutting your bet in half is worth exactly as much as doubling the loss you are prepared to absorb.
One caution, because “risk of ruin” is not a single quantity and these numbers are not interchangeable with the chart at the top of this article. The simulator models each loss as a fixed unit and asks whether the account is ever 50% below its starting stake. The chart’s simulation instead lets the bet compound and asks whether a peak-to-trough drawdown of that depth happens at any point within 200 trades — a much easier bar to clear, which is why its figures are far higher. Neither is wrong; they answer different questions, and the moral of the difference is that a risk-of-ruin number means nothing until you know what counts as ruin, whether the stake compounds, and over how long.
Scope of this section: what it computed, and what it deliberately does not claim. The toy system — 50% wins, 2:1 payoff — is this article’s own, chosen to make the arithmetic legible, and it is not a strategy, a backtest or a claim about any market. The exposure table is computePositionSize and the ruin table is computeRiskOfRuin, both called directly from the calculators linked in this section, so every cell is reproducible in your browser. The growth column is the closed form this article already quotes; “typical” means that growth rate compounded over 200 trades — the geometric outcome the chart plots, not an average, not a median in the strict sense and emphatically not a projection. All of it assumes the win rate and payoff are known exactly and never drift, which is the one assumption this article spends a whole section warning you is false. The code behind these tables reports every figure above; it also re-derives this article’s own published numbers from scratch — the $2,000 cap and 1,000-share position, the 100 shares and 20% exposure, f* = 0.25, the +0.5R expectancy and all five drawdown-recovery pairs — and checks that each one matches before reporting anything.
Sizing Rules a Systematic Trader Can Run
Here are the standard, sourced methods, from simplest to most refined. None is “best”; they trade simplicity for precision, and the right one depends on your system and markets.
Fixed-fractional (the default). Risk a constant fraction of current equity on every trade, using the formula from the first section: size = (equity × fraction) ÷ stop distance. It’s simple, it compounds naturally (positions grow as the account grows and shrink after losses), and it never lets one trade exceed your chosen cap. It’s the sane starting point for almost everyone [source: fixed-fractional sizing as described in Elder, 1993, and Tharp, 1998].
Fixed-dollar or fixed-units. Risk the same dollar amount, or trade the same number of shares/contracts, regardless of account size. Simplest of all and useful for very small accounts where fractional sizing rounds to zero, but it doesn’t compound and doesn’t scale down after a drawdown — so most systematic traders graduate off it.
Volatility-based (ATR) sizing. Size inversely to each market’s volatility so that every position carries the same dollar risk even though the instruments move differently. The classic implementation is the Turtle system’s: measure volatility as N, the 20-day Average True Range, and size a “Unit” so that a 1-N move equals about 1% of account equity, with the stop placed 2N from entry [source: Curtis Faith, Way of the Turtle, McGraw-Hill, 2007; turtletrader.com, “Turtle Trading Rules”; QuantifiedStrategies.com, “Position Sizing in a Turtle Trading System”]. A wild market gets a small position, a quiet one a larger position, and each trade risks the same slice of the account — so your risk doesn’t secretly balloon just because you traded a more volatile instrument. This is the most robust default for a portfolio spanning many markets.
Fractional Kelly / fractional optimal f. For traders who have rigorously measured their system’s statistics and want to reason about the growth-versus-drawdown trade-off explicitly, compute the Kelly or optimal-f fraction and then trade a conservative fraction of it — commonly a quarter to a half, often less [source: fractional-Kelly and fractional-optimal-f practice; Vince, 1992; quantitative-finance literature]. Treat the output as an upper bound to stay well under, not a target to hit, for all the estimation-error reasons above.
Whichever you pick, the systematic discipline is the same: position sizing is a rule inside the system, not a discretionary decision made trade by trade. It gets written down, coded, and backtested alongside your entries and exits — and it gets stress-tested against the questions a raw backtest hides: what’s the worst historical drawdown at this size, what’s the risk of ruin, and could a run of correlated losses breach your portfolio cap? A backtest that assumes a fixed position and ignores compounding can look perfectly healthy while hiding a sizing scheme that would have blown up the account. Sizing is part of what you test, not something you bolt on after.
If you have ever built a system that backtested beautifully, traded it at a size that felt bold rather than calculated, and watched a normal, expected losing streak turn into a drawdown so deep you abandoned the strategy right before it would have recovered — you’ve felt why this matters. The system didn’t fail you. The bet size did. The fix is not a better indicator; it’s smaller, rule-based bets that let an ordinary losing streak stay ordinary.
The Sizing Errors That Do Real Damage
- Confusing position size with risk. A “small” 100-share position with a far-away stop can risk more than a “large” 1,000-share position with a tight one. Risk is stop distance times size — compute it, don’t eyeball the share count.
- Sizing off a hunch instead of a rule. “This one feels good, I’ll go bigger” is how a disciplined system quietly becomes a discretionary one. The whole point of a systematic approach is that the size is an output, not a mood.
- Chasing the growth-optimal bet. Full Kelly and full optimal f maximize theoretical growth and, in practice, maximize the odds you quit — or blow up — during a drawdown no human tolerates. The optimum on paper is a ceiling to stay far under, not a goal.
- Trusting a Kelly number built on an overfit edge. Kelly and optimal f are only as good as the win rate and payoff you feed them. If those came from a curve-fit backtest, full-formula sizing points you straight off the cliff. Prove the edge first; size conservatively second.
- Ignoring correlation. Ten positions each risking 2% are not risking 2% if they all move together — in a correlated selloff they’re one 20% bet. Cap total portfolio risk (Elder’s 6% Rule is one such cap), not just per-trade risk.
- Backtesting entries and exits but not sizing. A backtest on fixed one-share positions can hide the drawdown and ruin risk that your actual compounding, fractional sizing would produce. Test the sizing scheme, not just the signals.
Proving the Edge Before You Size It
Position sizing is the risk-management half of a systematic strategy; the rest of the Trading Systems cluster builds the other half — proving the edge is real before you ever size it:
- How to Backtest a Trading Strategy the Right Way — the pillar this article supports. Sizing keeps a real edge alive; the pillar is how you establish it’s real in the first place.
- What Is Overfitting in Backtesting (And How to Avoid It) — the reason to distrust your own win-rate and payoff estimates, and to size well below what a Kelly or optimal-f formula built on them would allow.
- Why Most Trading Systems Fail Out-of-Sample — the companion on what happens when a mined edge meets live markets, drawdowns and all.
- Walk-Forward Analysis: Testing a Strategy Like a Quant — how to estimate the live drawdown your sizing has to survive, rather than the flattering in-sample one.
- Moving Averages Explained, RSI Explained, MACD Explained, and Bollinger Bands Explained — the signals; remember they only decide whether to trade, while sizing decides how much, and the second decision carries more of the risk.
- Position Sizing in Forex: The Math That Keeps You in the Game and Crypto Position Sizing — the same principles applied to leveraged currency trading and to volatile crypto allocations, where oversizing bites even faster.
If you want the plain-English, rigor-first read on building and running trading systems — explained honestly, never hyped — that is what the newsletter is for. Subscribe below.
Worked example: a $25,000 account risking 1% ($250) with a $50.00 entry and a $47.50 stop has $2.50 of risk per share, so the position is 100 shares — $5,000 of exposure, or 20% of the account, behind a 5% stop. Move the stop and the share count changes while the $250 at risk stays fixed. Run your own entry and stop through the Position Size Calculator.
Disclaimer: This article is educational content, not financial advice. I am not a licensed financial advisor, and nothing here is a recommendation to buy or sell any security or asset. Investing and trading involve risk, including the possible loss of the money you invest. Do your own research and consider consulting a licensed financial professional before making investment decisions. Read the full Disclaimer.
Historical and backtested results are hypothetical, carry inherent limitations, and do not guarantee future results. Figures were accurate to the best of my knowledge as of this article’s last-updated date and may have changed.
