A Profit Factor of 70, and the Account Still Blew Up
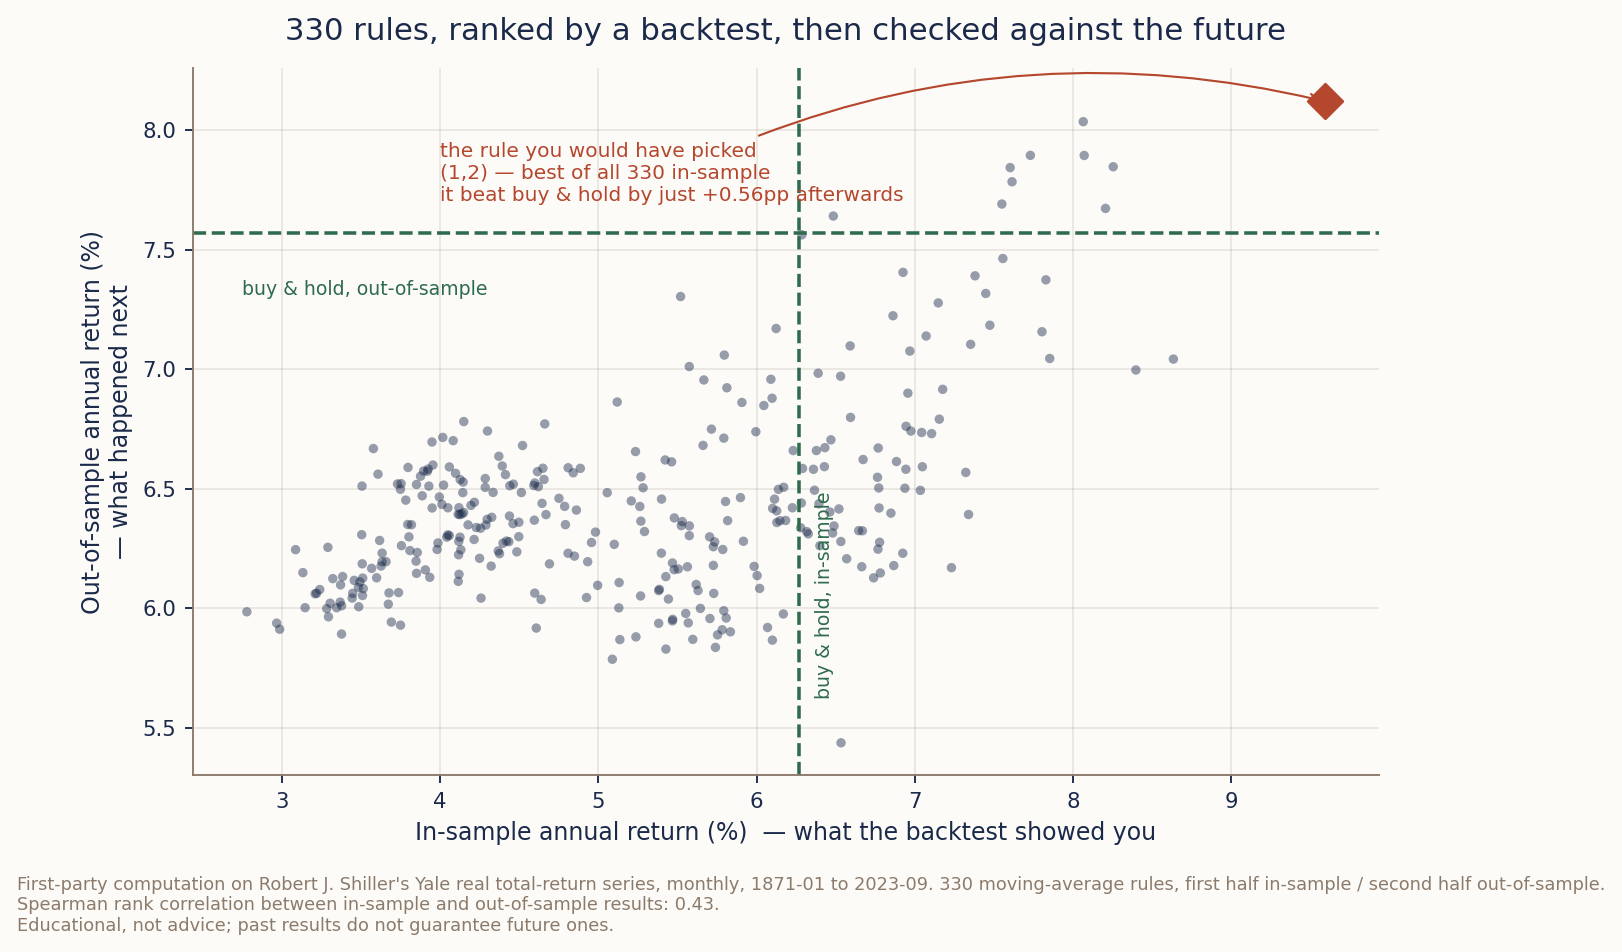
Every dot is a rule that looked like a strategy. The horizontal axis is what the backtest promised; the vertical axis is what actually happened next. The relationship is real but weak — and the rule you’d have chosen is the red diamond.
I had a strategy backtest with a profit factor over 70.
If that number means nothing to you: profit factor is gross profit divided by gross loss. Anything above 2 is considered strong. Above 3, people start asking what you’re doing differently. Seventy is not a good strategy — seventy is a number that should make you suspicious, and I want to be honest that at the time it made me excited instead.
I traded it. The account blew up.
That is the short version of about six years of my life, and this article is the long version, because I think the way backtesting gets taught leaves out the part that actually costs people money.
Five or six years of paying for lessons I thought were tests
I’ve always been the kind of person who notices patterns. It’s genuinely one of my strengths, and in trading it turned out to be the trap door.
I was a losing trader for five or six years. Like a lot of beginners I put my faith in chart indicators — far too naively, in hindsight. My working assumption was simple and completely wrong: somewhere out there is a good enough indicator, and finding it is what separates people who make money from people who don’t.
So I set out to find it. I taught myself to code indicators on charting platforms, entirely self-directed, and I started building the patterns I’d noticed into custom indicators. I have never counted them properly, but honestly, without exaggerating: I think I coded more than a thousand.
I should be precise about what that thousand was, because the honest version matters more than the impressive-sounding one. They were custom indicators built on new logic from basic indicators, custom versions of other people’s custom indicators, color-coded new plots so trades were easier to spot, new visuals, and so on. Most of them were variations and re-presentations of a much smaller set of underlying ideas — which, I now think, is a fair description of what indicator work is for most retail traders, and is why the effort never produced an edge. Recoloring a signal does not add information to it.
I traded with them. I lost, and lost again. And because I was impatient — because I wanted the money to arrive quickly — I ran those tests with real money instead of paper. They weren’t tests. They were lessons, and I paid a very expensive price for them.
Eventually I found a pattern and a calculation I liked, and I tested it by hand, manually, going back through the chart. At a glance it looked like it worked. So I built the prototype, put it on a simulation account, and then — greed again — went straight to real money. I lost all of it.
The prop-firm years, and seventy-plus accounts
Then I discovered prop firms.
The pitch is reasonable on its face: pass an evaluation, trade the firm’s capital, keep a cut. What it meant in practice for me was cycling between evaluation accounts and funded accounts, passing and failing and passing, paying a fee every time. With a prop account you’re usually trading through NinjaTrader, so I started testing strategies as NinjaTrader strategies.
That is where the profit factors came from. Some of those strategies backtested over a given period with a profit factor above 20. Some above 30. One was above 70.
Every one of them ended the same way. Trade it live, or backtest it over a different period, and the losses show up and the prop account blows up. That is what a plain backtest gets you. Not a strategy — a description of one stretch of history, dressed up as a prediction.
I want to be precise about my own part in this, because it would be easy to tell the story as though the tools failed me. I have a strongly gambling-prone streak. That is my temperament, not a market condition. Between the evaluations, the funded accounts and the retries, I burned through more than seventy prop-firm accounts. Some of that was bad strategy. A lot of it was me.
If you want the anatomy of how an account actually dies — the mechanics rather than the psychology — I wrote that up separately in Margin Calls Explained and Drawdown Explained.
So I built the thing you’re supposed to build
Over time I stopped hand-testing and built a proper backtesting system of my own, coding it up piece by piece. And I did the things the literature tells you to do. I ran out-of-sample tests. I ran walk-forward analysis, where you optimize on one window, test on the next, roll forward, and repeat — the standard answer to “how do I know I’m not just curve-fitting?”
I thought I’d built it properly. I genuinely did.
I kept failing. And in the middle of building the thing that was supposed to stop me blowing up accounts, I blew up more accounts.
The system did get better. After a great many backtests and a great many revisions to the backtesting system itself, I ended up with results I’d call high quality. But here is the sentence I most want you to take away, and it’s the one no tutorial told me:
Even after out-of-sample and walk-forward testing, there is always something you miss.
Let me show you the mechanism, on data you can download
I can’t hand you my prop-firm statements, and my strategies were intraday futures — a different instrument and timeframe from anything I can reproduce here. But the mechanism that broke them is reproducible on public data, so I built a small experiment rather than just asserting it.
I took Robert Shiller’s monthly US market data — real total return, dividends reinvested, inflation-adjusted, 1871 to 2023 [source: Robert J. Shiller, Irrational Exuberance dataset, Yale University, ie_data.xls]. I generated 330 simple moving-average crossover rules — every fast/slow combination in a sensible range, long when the fast average is above the slow one, flat otherwise, acting on the next month’s open so there’s no look-ahead. Then I split the history in half: the first half is the “backtest”, the second half is “what happened next.” The whole thing is one script — fixed seed, no hand-tuning — so every figure below can be regenerated from the same public spreadsheet rather than taken on my word.
Then I did what every one of us does. I ranked all 330 by their backtest and picked the winner.
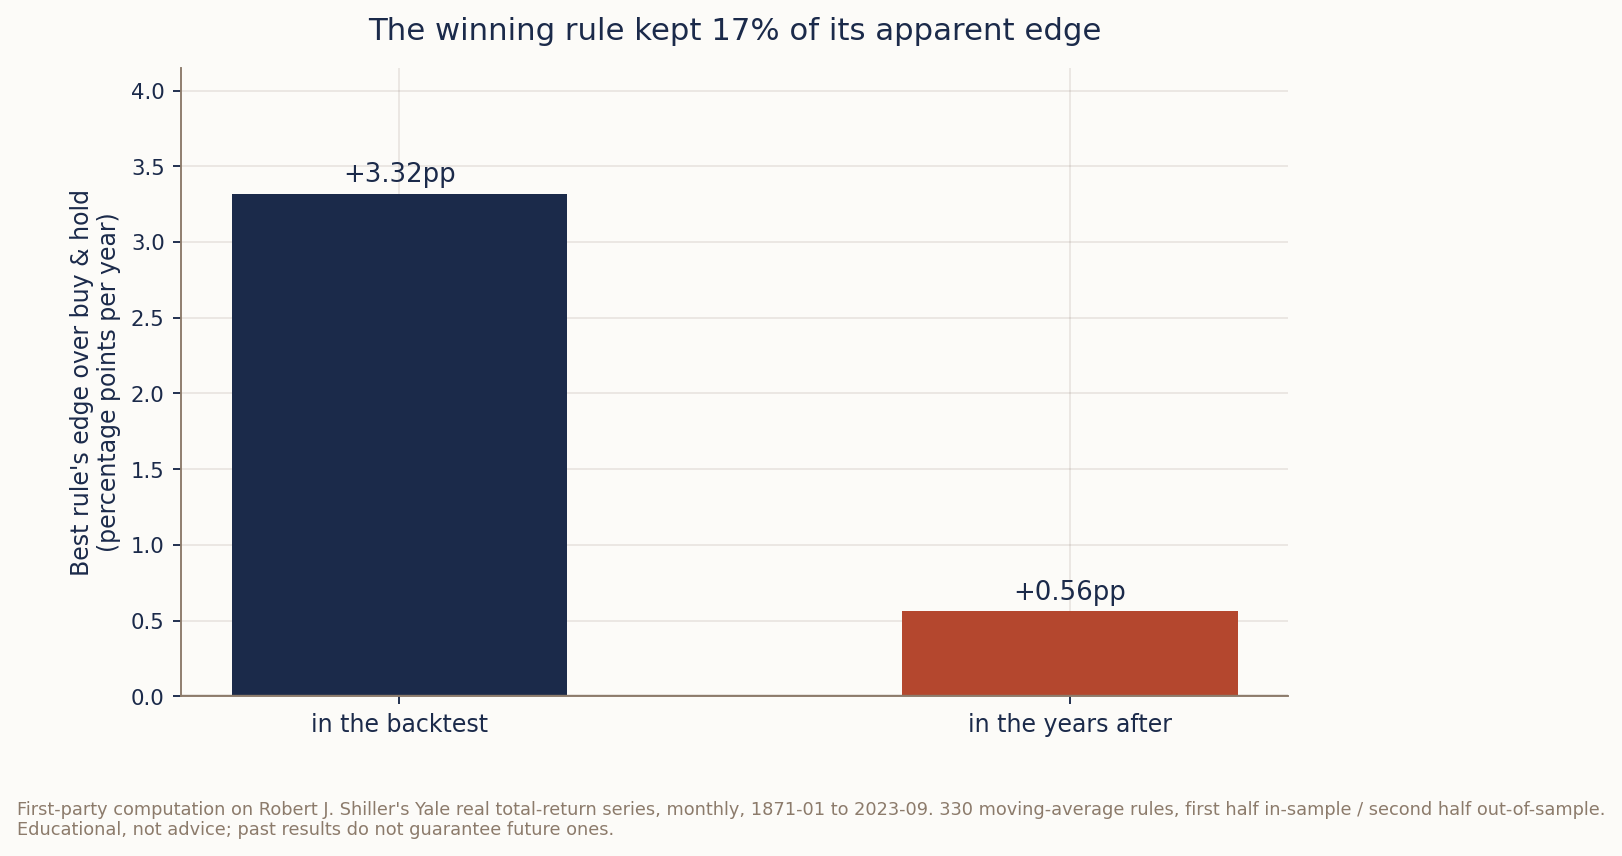
The winner didn’t stop working. It just stopped being special.
In the backtest, the winning rule returned 9.59% a year against buy-and-hold’s 6.27% — an edge of +3.32 percentage points, which is the kind of number that makes you open a brokerage account. In the years that followed, it returned 8.12% against buy-and-hold’s 7.57%. The edge was +0.56 points. It kept about 17% of what it appeared to promise.
And that’s the winner. Look at what happened to the field:
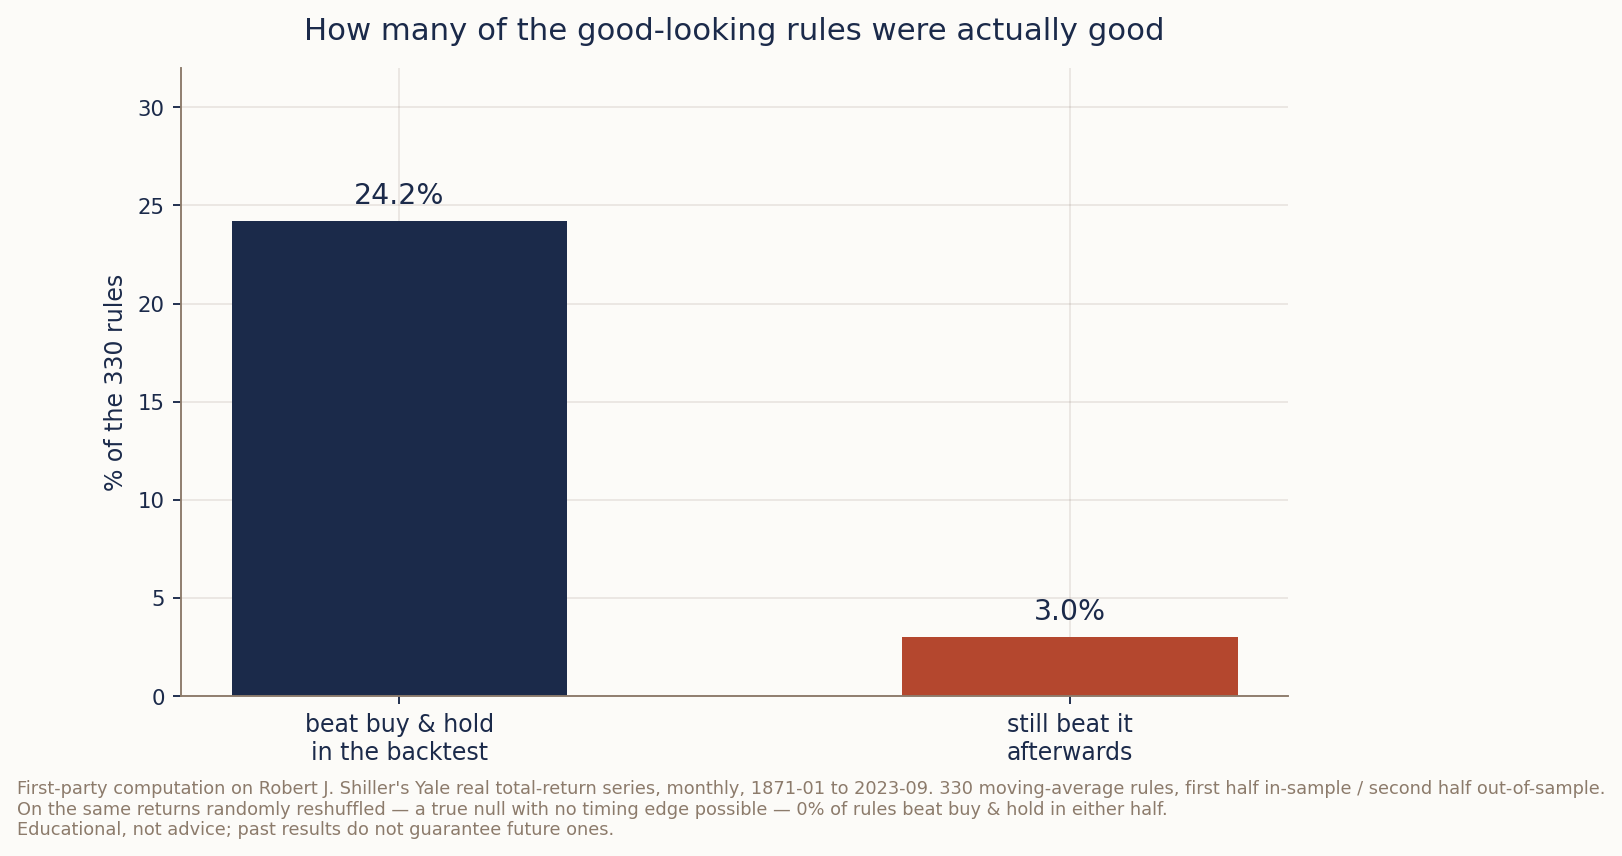
Roughly a quarter of the rules looked better than doing nothing. Three percent actually were.
24.2% of the rules beat buy-and-hold in the backtest. 3.0% still beat it afterwards. The rank correlation between how a rule scored in the backtest and how it scored later was 0.43 — real, but nowhere near strong enough to justify the confidence with which people select strategies.
I also ran a control, because a result without one is just a story. I took the same monthly returns and shuffled them into random order. Same returns, same average, same volatility — but the sequence destroyed, so no timing rule can possibly work. On that series, 0% of the 330 rules beat buy-and-hold, in either half. That tells you the real market does contain some genuine structure for these rules to grab; it also tells you that most of what looked like structure in the first half was noise that didn’t repeat.
Three hundred and thirty rules is a small search. I ran more than a thousand indicators by hand, over years, on a single instrument I cared about. Multiply the selection pressure and you get a profit factor of 70 — and an account that blows up.
Why out-of-sample doesn’t save you the way you think
Here’s the thing I understand now that I didn’t then.
Out-of-sample testing protects you against fitting one specific slice of history. It does not protect you against you. If you test a rule out-of-sample, it fails, and you go back and adjust it and test it again — the out-of-sample data has quietly become in-sample data. You’ve just laundered it through your own memory. I did this for years without noticing, because each individual adjustment felt like learning rather than fitting.
Walk-forward is stronger, and I’d still recommend it over a plain backtest — I wrote up how to run one in Walk-Forward Analysis, and the broader failure mode in What Is Overfitting in Backtesting. But walk-forward tests a procedure on the history that exists. It cannot test it against the market’s willingness to behave differently, and it cannot subtract the fact that you chose which procedure to walk forward.
The market is not a fixed system waiting to be decoded. It’s a very large number of retail traders, institutional desks, and algorithms running on hardware I will never own, all adapting to each other. In that environment only a tiny minority make money consistently. It is not easy. It is genuinely, genuinely difficult, and I think a lot of trading education is quietly dishonest about that.
The evidence backs the pessimism. Studies of entire national populations of retail traders — not surveys, not volunteers, but everyone with an account — find the large majority lose money over time, and that the more actively people trade, the worse they do on average [source: Barber & Odean, “Trading Is Hazardous to Your Wealth,” Journal of Finance, 2000; Barber, Lee, Liu & Odean on Taiwanese day traders; Chague, De-Losso & Giovannetti, “Day Trading for a Living?”, 2020]. The figure I’ve seen quoted is that upwards of 95% of traders and ordinary investors fail.
The gap between a backtest and a funded account
There’s a specific reason my numbers kept surviving testing and dying in production, and it took the prop-firm years to see it.
A backtest measures a strategy. A funded account measures a strategy plus a rulebook plus a person, and it measures the worst moment rather than the average one. Those are not the same object, and almost everything published about backtesting quietly assumes they are.
Three things live in that gap.
The backtest has no drawdown limit and your account does. A strategy that ends the year up 30% having been down 25% in March is a fine backtest result and a dead funded account, because the firm closed it in March. Most published profit factors are computed over the whole period as though nobody was watching in the middle. Somebody is always watching in the middle — the firm, or your own nerve.
Costs and fills are assumptions, and assumptions are where optimism hides. Slippage, spread, commission, and the fill you didn’t get because the move happened without you. On a strategy that trades rarely these are a rounding error. On an intraday strategy taking many trades a day, they are frequently the entire edge. A profit factor of 70 computed on perfect fills is not a profit factor; it’s a description of a market that doesn’t exist.
And the rulebook only exists if you follow it. This is the one I underestimated most. My repeated failure in the funded stage wasn’t a strategy failure — it was breaking a rule I had written down myself, letting a loss run past the point I’d promised to stop. The strategy didn’t blow the account. I did, using the strategy.
What actually changed my results was narrowing that gap deliberately: testing against the drawdown limit rather than the final return, assuming worse fills than I hoped for, and taking the discretion out of my own hands by trading a systematic version. Not because an algorithm is smarter than me, but because it doesn’t negotiate with itself at 2pm.
The part that actually changed my results
Everything above is technical. The thing that changed most was not.
Backtesting is, in the end, the same activity as trading. You have to hold the assumption that you are going to be wrong.
That sounds like humility-as-decoration until you notice what it rules out. It rules out treating a good backtest as evidence. It rules out adding capital because the last five trades worked. It rules out the specific move that cost me the most money, which is refusing to take a loss because taking it means admitting the decision was wrong.
Traders generally lose money in exactly the moments they feel most certain. Conviction is not information — it’s mostly a measure of how completely one idea has taken over your head, and that has no reliable relationship to what the position does next.
And there’s a structural version of the same bias. You’re supposed to weigh risk and reward together. But we’re human, so we fixate on the reward. The upside is vivid and specific; the downside is abstract until it isn’t. That asymmetry in attention is the trap most traders fall into, and no amount of backtesting rigor fixes it, because it isn’t a modeling error. It’s an attention error.
These days I trade a systematic version — an algorithm built from my own strategy, with rules written down in advance. Even that has been an education in how narrow the tolerance is. Backtested, it sits around a 1.4 to 1.5 profit factor, and I assumed that would be comfortably enough. It isn’t. A funded account is strict about drawdown in a way a personal account never is; a strategy nearer a 2 can still blow up if risk management slips for a single session. I’d rather have a 1.4 I understand than a 70 I don’t.
What I’d tell you if you asked me over coffee
Distrust your best backtest specifically. Not backtests in general — the best one. It’s the most selected object you own, and selection is exactly what manufactures fake edge. If one of your rules looks dramatically better than the rest, that’s information about your search, not about the market.
Count your attempts. If you’ve tested a thousand things, your winner needs to clear a far higher bar than if you tested three. Almost nobody adjusts for this, and it is the single biggest reason impressive backtests disappoint.
Write down what would make you exit before you enter — for a trade and for a strategy. My most expensive losses were the ones I refused to take.
Size for being wrong, not for being right. If you want the arithmetic, Position Sizing Rules for Systematic Traders covers it, and the Risk of Ruin Simulator will show you how a strategy with a positive edge still goes to zero when the bet is too large.
And be honest about your temperament before your system. Mine is gambling-prone. Knowing that is worth more than any indicator I ever wrote, and it took seventy accounts to learn.
I can’t help every trader. But if you’re where I was — a thousand indicators deep, convinced the next one is the one — I hope this saved you a few of the lessons I paid full price for.
Where to go next
- How to Backtest a Trading Strategy the Right Way — the process itself, done carefully.
- What Is Overfitting in Backtesting — the failure mode above, explained from the ground up.
- Walk-Forward Analysis — the strongest validation available, and its limits.
- How to Design a Trading Indicator From Scratch — if you’re going to build them anyway, build them deliberately.
- Trade Expectancy Calculator — what a system is actually worth per trade, once losses are counted honestly.
If you want markets explained plainly — measured, never hyped, and honest about what the data can’t tell you — that’s what the newsletter is for. Subscribe below.
Disclaimer: This article is educational content, not financial advice. I am not a licensed financial advisor, and nothing here is a recommendation to buy or sell any security or asset. Investing and trading involve risk, including the possible loss of the money you invest. Do your own research and consider consulting a licensed financial professional before making investment decisions. Read the full Disclaimer.
Historical and backtested results are hypothetical, carry inherent limitations, and do not guarantee future results. Figures were accurate to the best of my knowledge as of this article’s last-updated date and may have changed.
