What Is Overfitting in Backtesting (And How to Avoid It)
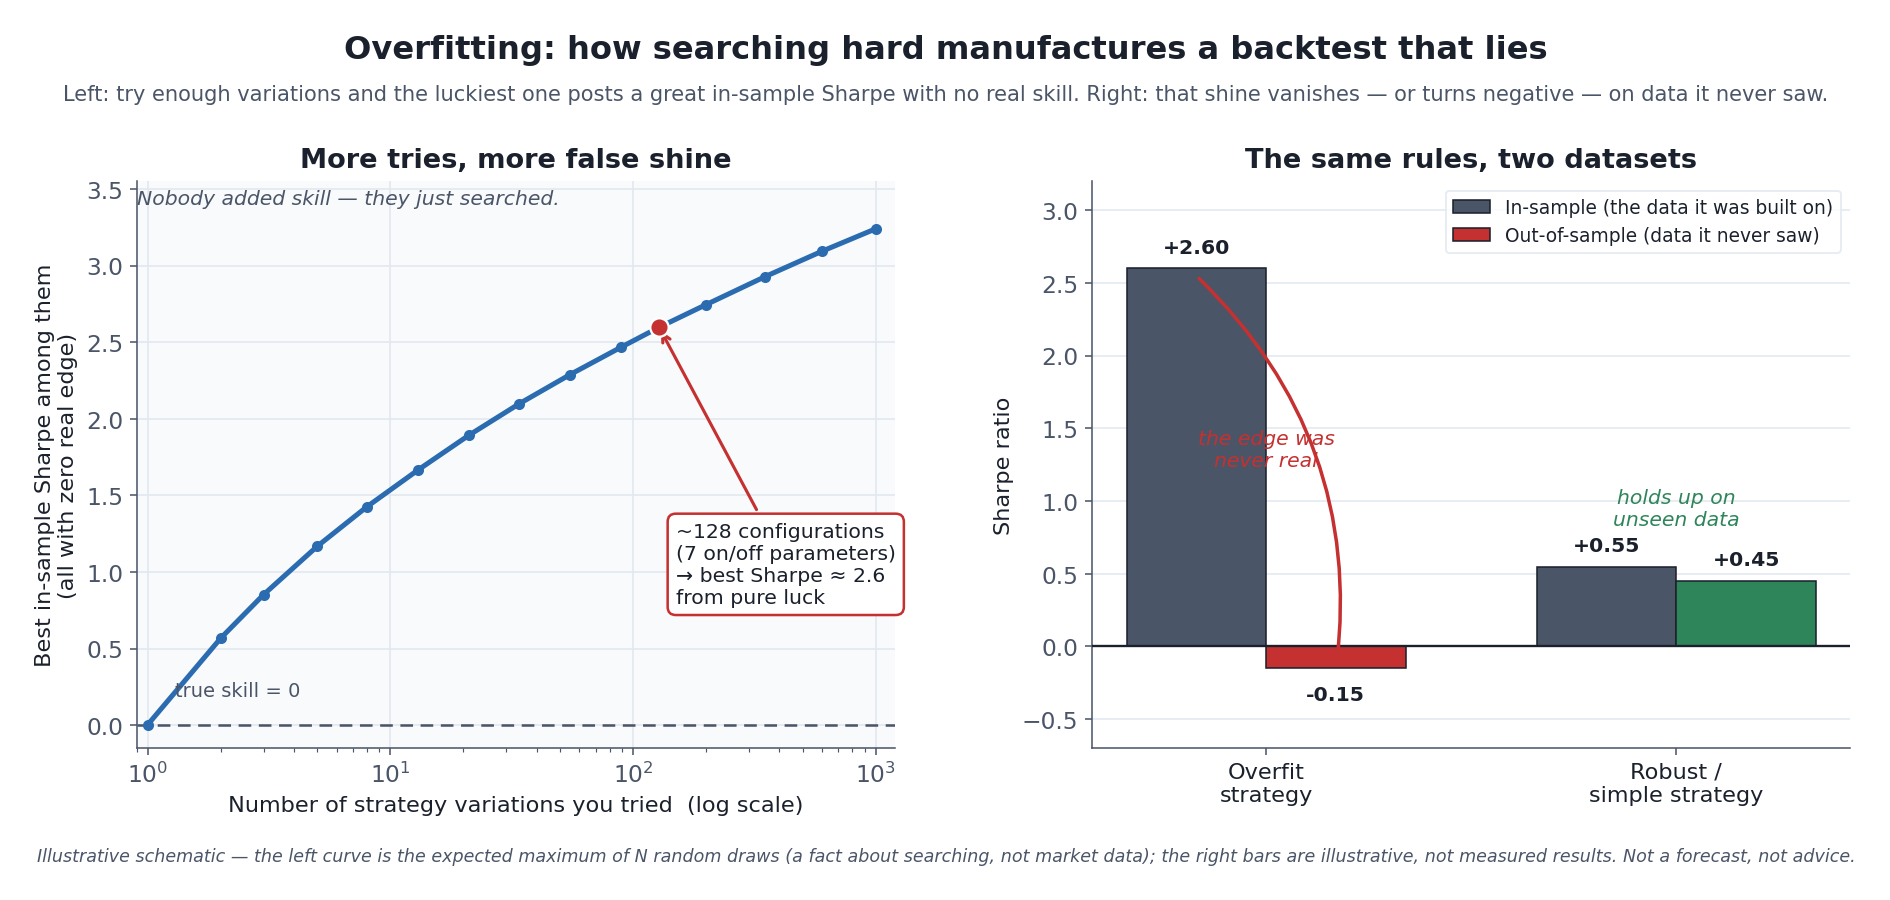
The whole article in one picture. Left: the more strategy variations you test, the higher the best one’s backtested Sharpe climbs — even when none of them has any real edge, because you are cherry-picking the luckiest of many. Right: that borrowed shine disappears the moment the strategy meets data it was never fitted to. Everything below is about not being the person holding the tall bar on the left.
A backtest can be flawless in its mechanics — clean data, no look-ahead, realistic costs — and still lie to you. Overfitting is how. It is the single most important reason a spectacular backtest and a money-losing strategy are so often the same strategy, and it is the failure mode that the backtesting pillar names first among the four. This article is the deep dive on it.
Here is the honest framing up front: overfitting is what happens when a strategy learns the specific accidents of your historical sample instead of any durable pattern — and the harder you search for a strategy that “worked,” the more certain it is that what you found is an accident. That second clause is the part most trading content leaves out. Overfitting is not only a mistake you make by adding too many rules; it is a mistake you make by trying too many strategies and keeping the best-looking one. Both roads lead to the same place: a backtest that describes the past beautifully and predicts the future not at all.
This is a trading-systems article, so the silo’s non-negotiable disclaimer governs every line of it: past backtest performance does not predict future results. Nowhere is that more literally true than here, because overfitting is precisely the process by which past performance is manufactured out of nothing.
Overfitting, Defined Without the Jargon
Borrow the idea from statistics and machine learning, where it has a precise meaning. Any set of historical prices contains two things mixed together: signal — relationships that are real and may persist — and noise — coincidences, one-off events, and randomness that will never repeat in the same arrangement. A model overfits when it is flexible enough to bend around the noise, treating the accidents of one sample as if they were laws.
The classic mental image is a curve drawn through scattered points. Give yourself a straight line and you capture the broad trend but miss the wiggles. Give yourself a high-order polynomial with enough free parameters and you can thread the curve through every single point perfectly — but that curve is now describing the exact dust pattern of this one dataset. Show it a new point and it whips off in some absurd direction. In trading, the “points” are historical bars and the “curve” is your set of rules and parameters. A strategy with enough moving parts — indicators, thresholds, filters, time-of-day conditions, one special exception for that one bad year — can be tuned to trace the past almost perfectly. It has memorized the answer key, not learned the subject.
The tell is always the same: an overfit strategy performs superbly on the data it was built on and falls apart on data it has never seen. That gap between in-sample performance (the history you developed and tuned on) and out-of-sample performance (history you held back, or the live future) is the fingerprint of overfitting, and shrinking it is the entire game. The right panel of the chart above is that fingerprint drawn out: a +2.6 in-sample Sharpe that collapses to negative on unseen data.
The Real Engine: Searching, Not Just Complexity
Most explanations stop at “too many parameters.” That is half the story, and the less dangerous half. The deeper, more insidious source of overfitting is the search itself — the number of distinct strategies, settings, and ideas you try before you find the one you decide to trade.
Think about what optimization actually does. You test a moving-average crossover with a 10/30 pair; then 12/26; then 9/21; then you add an RSI filter; then you try three RSI thresholds; then you restrict it to Tuesdays because that looked better. Each of those is a separate roll of the dice against the same finite history. Somewhere in that pile of attempts, by chance alone, one combination will have lined up with the noise in your sample and posted a gorgeous result. You will feel like you discovered something. What you actually did was run a lottery and keep the winning ticket — a process statisticians call data snooping or multiple testing, and it is the same mechanism as “p-hacking” in science: torture the data with enough hypotheses and one of them confesses.
This is why the left panel of the chart matters so much. It plots a genuine mathematical fact — not market data — about searching: the expected highest score among N pure-noise strategies. Even when every strategy you test has exactly zero real edge, the best of them looks better and better the more you test, simply because you are selecting the maximum of a larger and larger pile of random outcomes. The shine is real on the screen and fake in the world. Nobody added skill; they just searched.
How Much Luck Are We Talking About? The Numbers Are Startling
This is not hand-waving. It has been formalized, and the figures are sobering. In their widely cited 2014 paper in the Notices of the American Mathematical Society, David Bailey, Jonathan Borwein, Marcos López de Prado, and Qiji Zhu quantified exactly how easy it is to conjure an impressive backtest from noise [source: Bailey, Borwein, López de Prado & Zhu, “Pseudo-Mathematics and Financial Charlatanism: The Effects of Backtest Overfitting on Out-of-Sample Performance,” Notices of the AMS, 61(5): 458–471, May 2014].
Two of their results are worth carrying with you for life:
- A handful of on/off choices is already a large lottery. A strategy with just seven independent binary parameters gives 2⁷ = 128 configurations to try — and the expected best in-sample Sharpe ratio among 128 zero-skill strategies is above 2.6 [source: Bailey et al., 2014; David H. Bailey, “Backtest overfitting in financial markets,” overfitting-tools note]. A backtested Sharpe of 2.6 would make most people quit their job. It can come from pure searching.
- Short histories make it worse, and there is a minimum length you need. The same authors defined the Minimum Backtest Length — the amount of history you need before a given amount of searching stops guaranteeing a false winner. Their concrete example: if you have only five years of daily data, you should try no more than about 45 independent configurations, or a strategy showing an in-sample Sharpe of 1 will, on average, have an expected out-of-sample Sharpe of zero [source: Bailey et al., 2014; portfoliooptimizationbook.com, “The Dangers of Backtesting”]. Try more than that on five years, and an in-sample Sharpe of 1 is not evidence of anything.
And the sharpest result of all: under realistic conditions, backtest overfitting does not merely leave you with a strategy that has zero future edge — it can hand you one with negative expected out-of-sample returns [source: Bailey et al., 2014]. The reason is subtle but important. When you optimize hard, you tend to select the configuration that was most helped by the particular sequence of noise in your sample; when that noise reverses out-of-sample, as noise does, the strategy is positioned to be hurt by the reversal. This is one reason the authors offer for why so many quantitative strategies that dazzle on paper lose money live. The tall in-sample bar doesn’t fall to zero — it can fall through the floor.
Putting a number on the luck
The startling part can be shown rather than described, because it is a question about sampling and contains no market data at all. Take N trading rules that have no edge whatsoever — every one of them a coin flip by construction — and score them. The best of the batch will still post a good-looking backtest, purely because you looked at N of them:
| Rules tested | What the best one scores in-sample | Its true edge |
|---|---|---|
| 10 | 1.54 | 0.00 |
| 50 | 2.25 | 0.00 |
| 100 | 2.51 | 0.00 |
| 1,000 | 3.24 | 0.00 |
| 10,000 | 3.85 | 0.00 |
Scores are in standard-error units — read them as t-statistics, or as a Sharpe ratio divided by its own standard error. Anything past about 2 is conventionally called significant.
The last column is not an error. Every rule in this experiment has an edge of exactly zero; that is how they were built. So the winner’s honest expectation out of sample is zero — and the middle column is what the backtest will show you regardless. Searching a thousand worthless rules manufactures a 3.24 without a single one of them being worth anything.
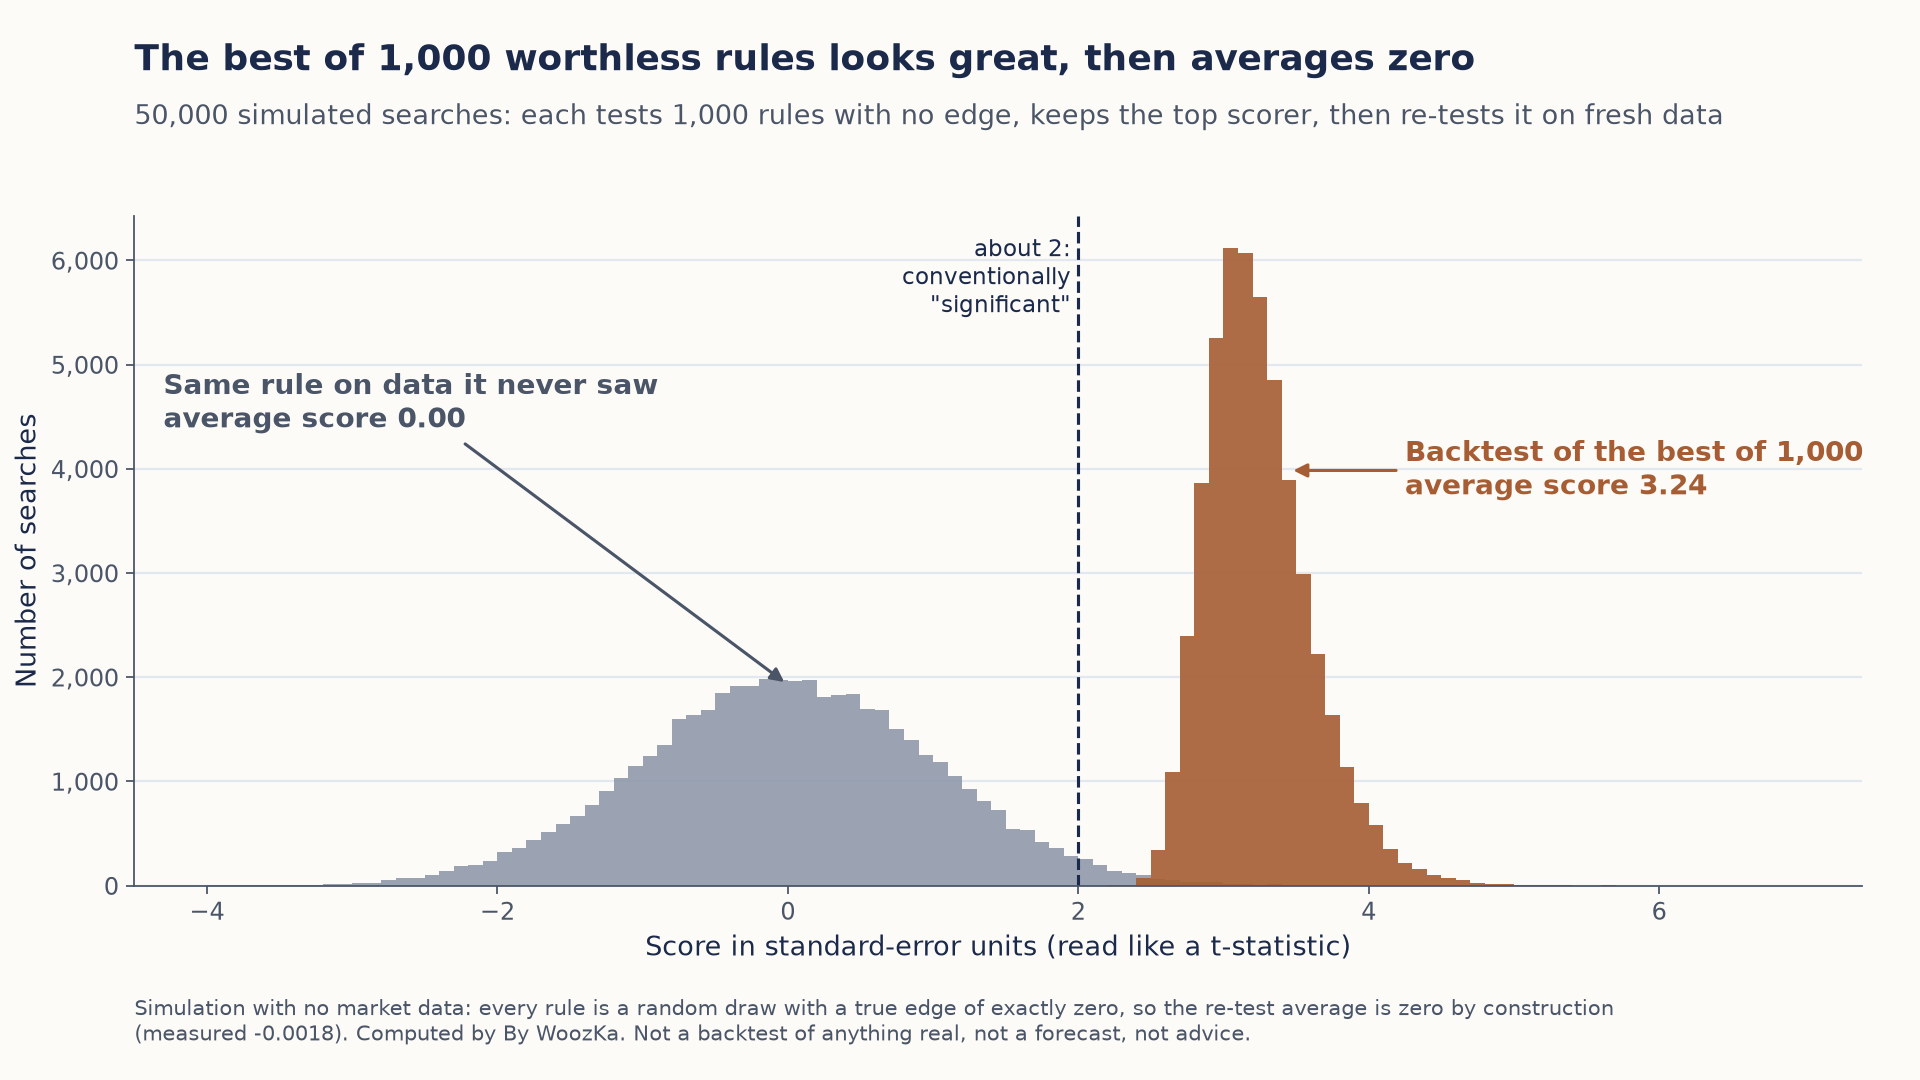
Every search finds a winner that clears the usual significance bar, and every one of those winners is an ordinary coin flip when it meets data it never saw.
This is not a backtest of anything real. No market data and no strategy is involved; the rules are draws from a distribution with no edge.
How casually you reach those numbers
N sounds like something you would have to work at. It is not. A parameter sweep multiplies:
| Parameters | 5 values each | 10 values each | 20 values each |
|---|---|---|---|
| 1 | 5 | 10 | 20 |
| 2 | 25 | 100 | 400 |
| 3 | 125 | 1,000 | 8,000 |
| 4 | 625 | 10,000 | 160,000 |
Combinations searched. Four parameters at ten settings each is ten thousand backtests — an afternoon’s work, and by the first table the winner of ten thousand coin flips scores about 3.9 while being worth precisely nothing.
This is why the section above insists the engine is searching rather than complexity. A two-parameter rule tested exhaustively can be more overfit than a five-parameter rule fitted once. What inflates the number is not how elaborate the rule is; it is how many you quietly rejected before showing this one.
Method, so it can be checked rather than taken on trust: in-sample scores are independent standard normals, so a score reads in standard-error units. The published column is exact — the expected maximum of N such draws, evaluated by numerical integration — and a 200,000-trial simulation at a fixed seed is run separately and must agree to within 0.02. The script also re-draws each winner’s score independently and confirms the out-of-sample mean is zero. A tempting shortcut, the classical sqrt(2 ln N), was tested and rejected: it overstates the small-N cases badly, and the assertion that caught it is kept in the file.
The Evidence: When “Working” Rules Met New Data
Formulas are one thing; a real out-of-sample test is another. The most famous one in this corner of finance is a two-study story that this whole silo is built to teach.
In 1992, Brock, Lakonishok, and LeBaron published an influential study finding that a set of simple technical trading rules — moving averages and trading-range breakouts — appeared to have predictive power on nearly a century of Dow Jones Industrial Average data [source: Brock, Lakonishok & LeBaron, “Simple Technical Trading Rules and the Stochastic Properties of Stock Returns,” Journal of Finance, 47(5): 1731–1764, 1992]. It looked like evidence that these rules “worked.”
Then, in 1999, Ryan Sullivan, Allan Timmermann, and Halbert White did the honest thing. They asked: how many rules would you have had to sift through to find those winners, and does the edge survive once you account for that search? Using White’s “Reality Check” bootstrap, they expanded the universe to nearly 8,000 technical trading rules and re-ran the analysis on about a century of DJIA data. Their finding is the whole lesson in one sentence: even after correcting for data snooping, the best rule looked good within the original 1992 sample — but it did not deliver superior performance in the subsequent roughly ten-year out-of-sample period, which they read as evidence of increasingly efficient markets [source: Sullivan, Timmermann & White, “Data-Snooping, Technical Trading Rule Performance, and the Bootstrap,” Journal of Finance, 54(5): 1647–1691, 1999]. The rules that “worked” were, to a large degree, the survivors of an enormous unreported search — and their edge evaporated on data nobody had mined.
The same disease shows up in academic finance itself, which is a useful humility check. Reviewing the published research on what predicts stock returns, Harvey, Liu, and Zhu documented at least 316 factors claimed in journals — and argued that the standard bar for “discovery,” a t-statistic above 2.0, is far too lenient once you account for how many factors the whole profession has tested. Their recommendation: a credible new factor should clear a t-statistic closer to 3.0, and by that standard a large share of published findings are likely false [source: Harvey, Liu & Zhu, “…and the Cross-Section of Expected Returns,” Review of Financial Studies, 29(1): 5–68, 2016]. If armies of PhDs peer-reviewing each other still manufacture spurious signals at scale, a solo trader optimizing on a laptop should assume the base rate of self-deception is very high.
How to Tell If You’ve Overfit: Detection
You usually cannot prove a strategy is overfit, but you can gather strong evidence — and the discipline of looking is itself protective. Some of these are gut checks; some are formal tools researchers built specifically for this problem.
The out-of-sample gap. The first and simplest test: how much worse is performance on data the strategy never touched during development? A modest, expected degradation is normal. A collapse — a great in-sample Sharpe falling to near zero or negative — is the signature of overfitting. This is exactly why you hold data back (see the defenses below).
The “only-one-setting” tell. Perturb the parameters slightly. If a strategy is brilliant at a 20-period lookback but mediocre at 18 or 22, its “edge” is balanced on a pin — it fits one precise slice of the past and nothing robust. A real effect degrades gracefully as you nudge the knobs; an overfit one falls off a cliff.
Count your trials, then haircut the result. Because searching inflates the best result, honest researchers discount a reported Sharpe by how many strategies were tried to find it. Campbell Harvey and Yan Liu built a framework to do exactly this — a “haircut” Sharpe ratio that adjusts for multiple testing using standard statistical corrections (Bonferroni, Holm, Benjamini-Hochberg-Yekutieli). Crucially, they show the correct haircut is nonlinear: a flat “cut it in half” rule of thumb is a serious mistake, because marginal strategies deserve a much heavier penalty than truly strong ones [source: Harvey & Liu, “Backtesting,” Journal of Portfolio Management, 2015]. The practical takeaway even if you never run the math: a Sharpe of 1.5 found on the 200th thing you tried is not the same as a Sharpe of 1.5 found on the first.
The Deflated Sharpe Ratio. Bailey and López de Prado turned that idea into a specific statistic, the Deflated Sharpe Ratio, which corrects an observed Sharpe for the number of trials, the length of the track record, and the non-normal (fat-tailed, skewed) shape of real returns — precisely the three things that make a raw Sharpe flatter to deceive [source: Bailey & López de Prado, “The Deflated Sharpe Ratio: Correcting for Selection Bias, Backtest Overfitting and Non-Normality,” Journal of Portfolio Management, 2014].
The Probability of Backtest Overfitting (PBO). The same group went further and built a way to estimate, for a given research process, the probability that the configuration you selected as best is in fact overfit — a numerical method called combinatorially symmetric cross-validation (CSCV). It repeatedly splits the history into in-sample and out-of-sample halves in many combinations and asks how often the in-sample winner underperforms out-of-sample. A high PBO is a red flag on the whole exercise, not just one strategy [source: Bailey, Borwein, López de Prado & Zhu, “The Probability of Backtest Overfitting,” Journal of Computational Finance, 2016].
You do not need to run all of these to benefit from them. Their shared message is the one to internalize: a Sharpe ratio, or any backtested number, means almost nothing until you know how many strategies were tried to produce it and how much history it rests on.
How to Avoid It: The Defenses
Detection tells you after the fact. These habits keep you out of the trap in the first place, and they are ordered roughly by how much they help.
1. Start with a hypothesis, not a search. The strongest protection is to have a reason a strategy should work before you ever run a backtest — an economic or behavioral rationale (a structural inefficiency, a risk premium, a known constraint on some market participant). A rule discovered by mining data has no prior claim to being real; a rule predicted in advance by a sound reason, and then confirmed by data, is far more credible. Data mining generates hypotheses; it does not confirm them.
2. Minimize parameters and degrees of freedom. Every optimizable knob you add is another dimension in which to fit noise. Robert Pardo, who popularized walk-forward testing, puts “keep the number of parameters to a minimum” as the first line of defense against overfitting [source: Robert Pardo, The Evaluation and Optimization of Trading Strategies, 2nd ed., Wiley, 2008]. Prefer the simple rule with two parameters over the elegant machine with nine, even if the machine backtests better — especially if it backtests better.
3. Hold out data and mean it. Split your history into an in-sample development set and an out-of-sample set you do not look at during design. Test on the held-out set once. The moment you tweak the strategy after peeking at out-of-sample results, that data is contaminated — it has become in-sample, and you have quietly resumed the search. This is the discipline the backtesting pillar describes in detail.
4. Use walk-forward analysis for anything serious. A single split is good; rolling the split forward is better. Walk-forward analysis optimizes on one window, tests on the next unseen window, then rolls both forward and repeats — stitching together a composite out-of-sample record that far better reflects how a strategy would have coped with changing conditions [source: Pardo, 2008]. The dedicated walk-forward analysis article covers the mechanics.
5. Correct for the number of things you tried. Keep an honest count of how many configurations you tested, and discount the winner accordingly — via a haircut Sharpe, a Deflated Sharpe, or simply a raised bar (recall Harvey-Liu-Zhu’s argument for a t-statistic near 3.0 rather than 2.0 once multiple testing is in play) [source: Harvey, Liu & Zhu, 2016]. The unreported trials are the hidden cost of every optimization.
6. Cross-validate carefully — naive k-fold is a trap in markets. Ordinary machine-learning cross-validation assumes observations are independent; financial time series are not, and labels overlap in time, so standard k-fold leaks information from the “test” set into the “training” set. López de Prado’s remedy is purged and embargoed cross-validation (and the combinatorial version, CPCV): remove training observations that overlap with test-set labels, and impose a gap so nothing bleeds across the boundary [source: Marcos López de Prado, Advances in Financial Machine Learning, Wiley, 2018]. If you are doing anything ML-flavored, this is not optional.
7. Demand robustness across settings and markets. Trust a strategy more if it works across a range of nearby parameters, across multiple instruments, and across different time periods — not one magic setting on one symbol in one decade. Broad, gentle competence beats one sharp peak every time.
8. Forward-test before you commit capital. Out-of-sample historical data is data the strategy hasn’t seen, but it is still the past. Paper-trading on live, incoming data — slow as it is — is the closest thing to a true test, because the market genuinely does not know your rules exist. Its slowness is the point: it enforces the patience overfitting punishes.
None of this makes a strategy safe. It makes your estimate of the strategy more honest, which is the most any backtest can give you. A rule that survives a hypothesis-first design, minimal parameters, an untouched hold-out, walk-forward testing, a multiple-testing haircut, and forward testing is not guaranteed to make money — but it is far less likely to be a mirage.
If you have ever spent a weekend optimizing a strategy until the equity curve gleamed, felt the certainty that you had finally found it, and then watched it bleed money the first month you traded it live, you have met overfitting personally. The backtest wasn’t broken. It was answering the question you actually asked — “what would have worked on this exact past?” — which is a different question from the one you needed answered.
The Bar, Priced Against the Search
Two of the recommendations above are claims about numbers, and neither is given one. The detection section says to discount a result by how many strategies were tried, and warns that a flat rule of thumb is a serious mistake because marginal strategies deserve a much heavier penalty than strong ones. Defense five says to raise the significance bar from a t-statistic of 2.0 to something nearer 3.0. The coin-flip table earlier on this page already contains everything needed to price both, and the two halves never meet. Joining them needs no market data at all — the same zero-edge setup answers how often a fixed bar is cleared by luck, and what bar would not be.
What a Stricter Bar Actually Survives
A significance threshold is a promise about how rarely you will be fooled. Whether it keeps that promise depends entirely on how many chances you gave it. Running the same worthless rules against both bars:
| Rules tested | Best score, on average | Clears 2.0 | Clears 3.0 |
|---|---|---|---|
| 10 | 1.54 | 20.6% | 1.3% |
| 50 | 2.25 | 68.4% | 6.5% |
| 100 | 2.51 | 90.0% | 12.6% |
| 1,000 | 3.24 | 100.0% | 74.1% |
| 10,000 | 3.85 | 100.0% | 100.0% |
The two cells reading 100.0% are rounded from 99.99999999% and 99.99986401%; nothing here is certain, it is merely close enough that the distinction stops mattering. Read the rows the way a researcher would. At a thousand attempts the stricter bar is not occasionally cleared by luck — it is cleared on average, because the expected best score, 3.24, is already above it. At ten thousand, the size this article calls an afternoon’s work, both bars are formalities. The conventional 2.0 is gone much earlier: it is already a two-in-three proposition at fifty attempts and effectively guaranteed by a thousand. A fixed threshold cannot survive a growing search, because the search moves and the threshold does not.
The Threshold That Is Not a Number
There is a bar that keeps its promise. It simply is not a constant. Solve for the score that holds the chance of any false winner among N worthless rules at one in twenty, and the answer is a function of N:
| Rules tested | The bar that holds | Against a fixed 3.0 |
|---|---|---|
| 10 | 2.57 | −0.43 |
| 50 | 3.08 | +0.08 |
| 100 | 3.28 | +0.28 |
| 1,000 | 3.88 | +0.88 |
| 10,000 | 4.41 | +1.41 |
Run it backwards and each fixed bar names the one search it is honest for. A t-statistic of 2.0 is the correct threshold for a search of 2.2 independent attempts, and 3.0 is the correct threshold for 38. That is the force of the stricter recommendation, measured rather than asserted: moving the bar from 2.0 to 3.0 buys a search seventeen times larger, and it is a real and useful gain. It is also a small absolute number. The sweep table earlier on this page brackets 38 between its own two-parameter cells — twenty-five at five settings each, a hundred at ten — so a single afternoon of tuning two knobs is already at or past the point where the stricter bar stops protecting anyone. The counterweight is in the first row and deserves saying: below about thirty-eight attempts, 3.0 is too harsh, and a careful researcher who tried ten things is being asked to discard real findings. A fixed bar is wrong in both directions; only the count fixes it.
Why Cutting It in Half Is Wrong Twice
The haircut claim is the sharper of the two, because it says something specific: the penalty is not proportional. Take the thousand-attempt row from this article’s own table and ask what a given result is worth once those thousand attempts are accounted for.
| Observed score | After the haircut | Haircut |
|---|---|---|
| 3.5 | 0.81 | 77% |
| 4.0 | 1.86 | 53% |
| 4.5 | 2.71 | 40% |
| 5.0 | 3.44 | 31% |
| 5.5 | 4.12 | 25% |
| 6.0 | 4.76 | 21% |
Cutting it in half is exactly right at one observed score, 4.10, and wrong everywhere else — far too gentle below it, needlessly brutal above it. Across these six rows alone the correct haircut runs from 77% to 21%, a spread of 3.7 times, and it keeps falling as the result gets stronger. The direction is the part worth carrying: a genuinely extraordinary result loses the least to the search that found it, and a merely good one loses nearly all of it. That is why the flat rule fails in both directions at once, and it is the article’s own warning turned into a number.
The table stops at 3.5 for a reason. Below about 3.20 there is nothing left to cut — the adjusted score turns negative, which means the best of a thousand coin flips beats that result more often than it loses to it. A backtested 3.0 found on the thousandth attempt is not a weakened finding but an unremarkable one, and the first table above already said so from the other side: the best of a thousand worthless rules clears 3.0 in 74.1% of searches. The two tables are the same fact read forwards and backwards.
Method and limits, so this can be checked rather than taken on trust. No calculator on this site computes a significance threshold, so nothing above comes from a shipped tool; every figure is a property of the normal distribution under the same zero-edge setup the earlier table uses, computed in code and checked before publication, with this article’s own five published scores, its 128-configuration example and its five-years-to-45-attempts pair all recomputed first and confirmed. Three limits are real, and the first is the largest. These are N independent attempts; a parameter sweep is correlated, so its effective number of independent trials is smaller than its raw count, and every penalty above is therefore an upper bound on what a correlated sweep of the same size deserves — the ranking and the shape hold, the exact haircut for a particular sweep does not. One in twenty is a choice, not a law; a stricter appetite moves every bar up and a looser one moves it down, without changing that the bar has to move with N at all. An adjusted score is a statement about evidence and never an expected return — nothing here estimates any strategy’s profit, and a negative one means only that the result is ordinary for the size of the search. And a note on this article’s own figure rather than a correction to it: the “above 2.6” at 128 configurations is what the cited paper’s own approximation returns, 2.62, where the exact expected maximum of 128 draws is 2.59. The article quotes its source correctly, the gap is 0.02, and it changes nothing in either direction.
The Habits That Manufacture Overfitting
- Judging a strategy by its in-sample numbers. The backtested Sharpe or return on the data you built on is the least trustworthy number in the whole exercise. What matters is how it holds up on data it never saw.
- Counting parameters but not trials. Even a two-parameter strategy is overfit if you tried three hundred two-parameter strategies and kept the best. The search is the risk, not just the complexity.
- Peeking at the hold-out, then “just one more tweak.” The instant you adjust after seeing out-of-sample results, that data is contaminated and you are back to searching. A hold-out works once.
- Loving the single best setting. If the edge lives at exactly 20 periods and dies at 18 or 22, it is balanced on noise. Robust effects degrade gently as you nudge the knobs.
- Mining first, explaining later. A pattern found by search and then rationalized (“it makes sense because…”) is still a mined pattern. A reason that predicts the pattern before the test is worth far more.
- Trusting one impressive study — including your own. The literature is full of “working” rules that failed out-of-sample (Sullivan-Timmermann-White) and published factors that were likely false (Harvey-Liu-Zhu). Assume the base rate of self-deception is high, and test accordingly.
Where This Sits in the Cluster
This article is the deep dive on the biggest failure mode in the Trading Systems cluster. The rest of the cluster builds the surrounding discipline:
- How to Backtest a Trading Strategy the Right Way — the pillar this article extends, covering the other three ways a backtest lies (look-ahead bias, survivorship bias, ignored costs) and the disciplined process.
- A Profit Factor of 70, and the Account Still Blew Up — the first-hand version of this failure mode, and an experiment you can reproduce: ranking 330 moving-average rules on Shiller’s 1871–2023 data and picking the backtest winner kept only about 17% of the edge it appeared to promise.
- Why Most Trading Systems Fail Out-of-Sample — the companion piece on what actually happens when a mined edge meets live markets.
- Walk-Forward Analysis: Testing a Strategy Like a Quant — the full mechanics of the rolling out-of-sample method that is defense #4 above.
- Moving Averages Explained: SMA vs EMA, RSI Explained: How to Use It Without the False Signals, MACD Explained, and Bollinger Bands Explained — each explains why optimizing an indicator’s settings on historical data is a textbook route to overfitting.
- Position Sizing Rules for Systematic Traders — because even a real edge can be destroyed by risking too much per trade.
If you want the plain-English, rigor-first read on building and testing systems — explained honestly, never hyped — that is what the newsletter is for. Subscribe below.
Disclaimer: This article is educational content, not financial advice. I am not a licensed financial advisor, and nothing here is a recommendation to buy or sell any security or asset. Investing and trading involve risk, including the possible loss of the money you invest. Do your own research and consider consulting a licensed financial professional before making investment decisions. Read the full Disclaimer.
Historical and backtested results are hypothetical, carry inherent limitations, and do not guarantee future results. Figures were accurate to the best of my knowledge as of this article’s last-updated date and may have changed.
