How Institutions Actually Manage Risk — And Which Parts You Can Steal
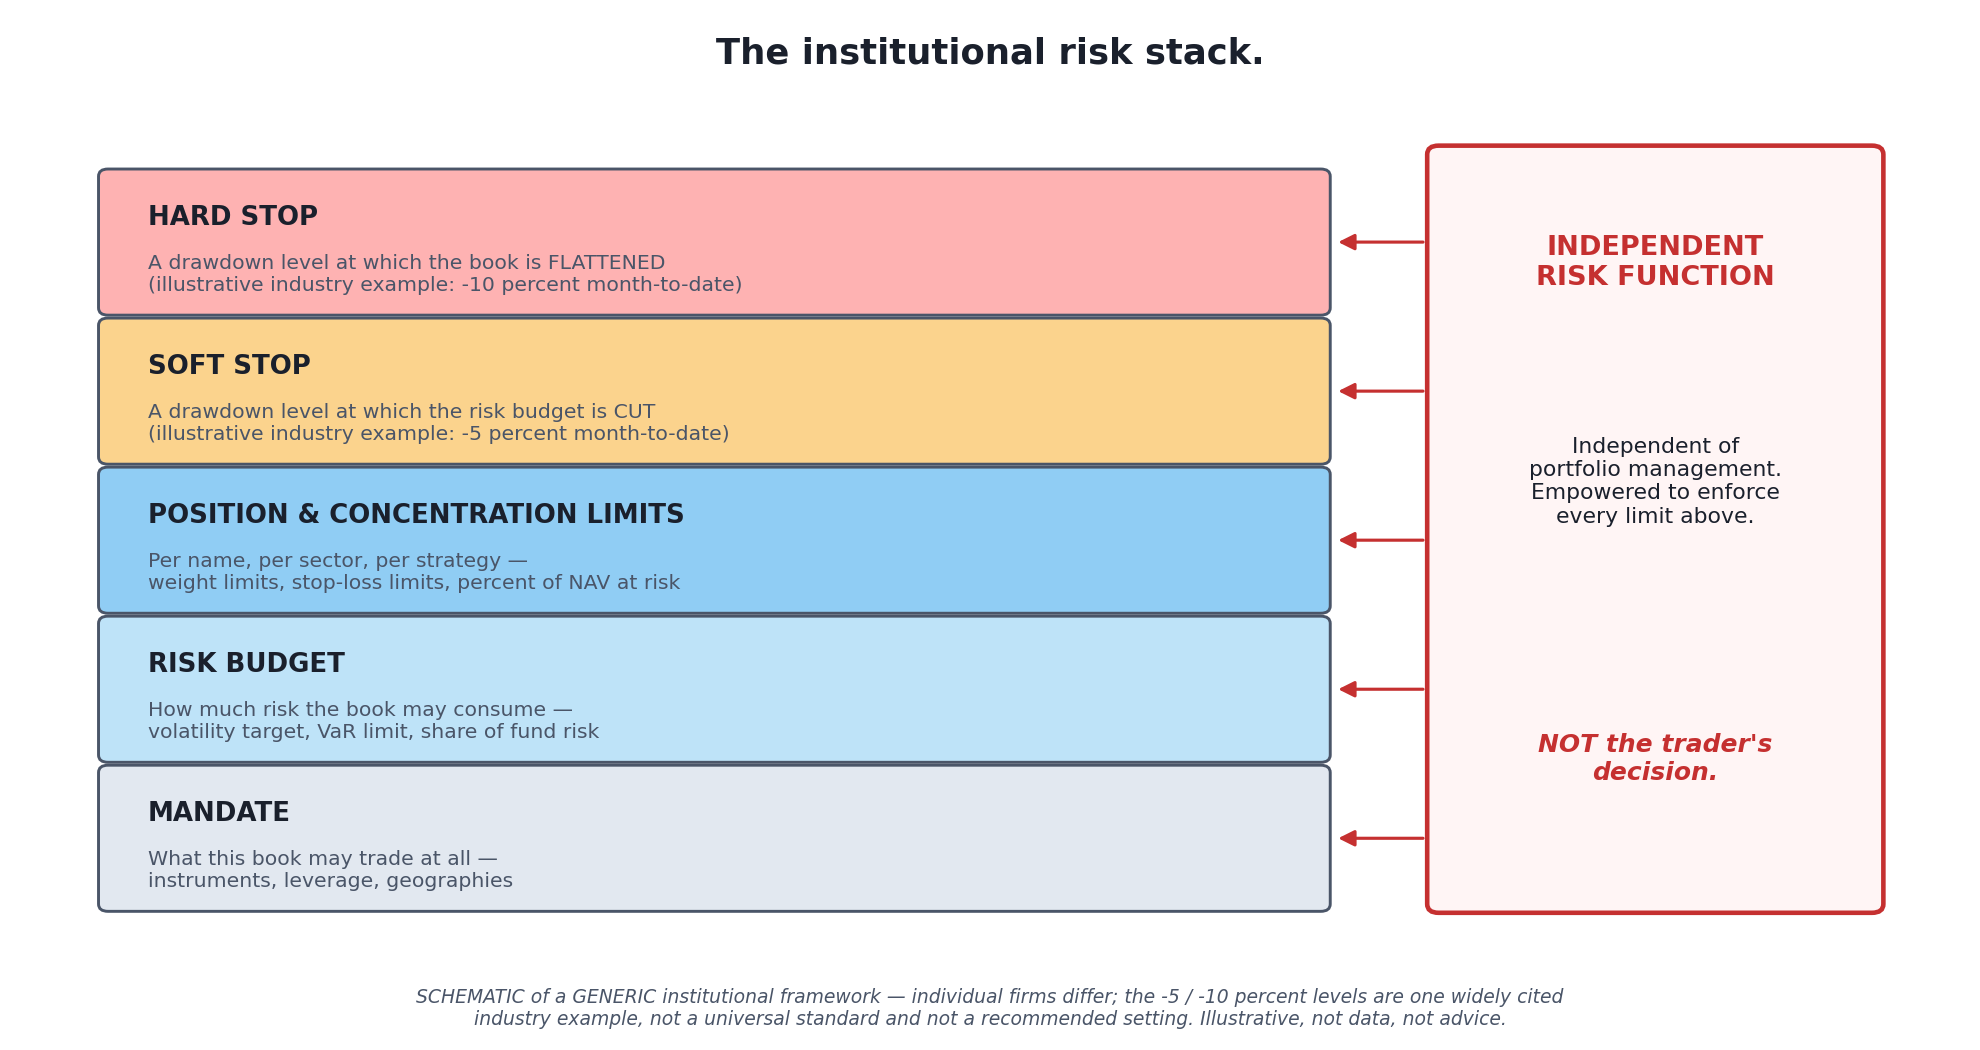 The institutional advantage is not better forecasts. It is this stack — and, above all, the box on the right. Schematic illustration of a generic framework; individual firms differ.
There is a fantasy about institutional trading that goes roughly: they have better data, better models, and better information, and that is why they win. Some of that is true at the margins. But sit down with how a professional desk is actually run and the striking thing is not the alpha. It is how much of the machinery exists to answer a completely different question:
not “how do I make money?” but “how do I make sure that when I am wrong, I am still here?”
That question is answerable without any edge at all. Which is precisely why parts of the institutional framework are portable to a retail account — and why the parts that are not portable are worth knowing too, so you stop pretending you have them.
This is a trading-systems article, and the silo’s non-negotiable rule governs every line: past performance does not predict future results. Nothing here is a recommendation to trade, to use leverage, or to adopt any strategy.
Level 1: The Machinery
Strip out the jargon and an institutional risk framework is five layers, each one a constraint that exists before any trade is put on.
The mandate. What this book is even allowed to touch. Instruments, geographies, maximum leverage, permitted derivatives. Notice what this is: a decision, made when calm, about what you will not do — enforced later, when you are not calm.
The risk budget. How much risk the book is permitted to consume, usually expressed as a volatility target, a Value-at-Risk (VaR) limit, or a share of the fund’s total risk. Institutional frameworks lean on VaR, Expected Shortfall and sensitivity limits precisely because they are portfolio-level — they constrain the whole book, not each trade [source: Signal Pilot, “Advanced Risk Management: Position Sizing, Correlation & VaR”; Traders MBA, “How Does Risk Management Differ for Institutions Versus Retail Traders?” — web-verified 2026-07-12]. The budget is a ceiling, not a target to be filled.
Position and concentration limits. Per name, per sector, per strategy, expressed as weight limits, stop-loss limits, or a percentage of NAV at risk [source: Resonanz Capital, “A Checklist for Assessing Hedge Fund Managers’ Risk Management Approach” — web-verified 2026-07-12]. These exist because the fastest way to die is not being wrong — it is being wrong in nine places that turn out to be the same place.
Soft and hard stops. This is the layer retail traders almost never have, and it is the most interesting one. A book with monthly liquidity is commonly subject to explicit soft and hard drawdown levels — for example, a soft stop at −5% month-to-date, at which the VaR limit is cut to 1%, and a hard stop at −10% month-to-date, at which the VaR limit drops to zero for the remainder of the month [source: Resonanz Capital, as above — web-verified 2026-07-12; an illustrative industry example, not a universal standard]. Read that carefully, because it is not a stop-loss on a trade. It is a stop-loss on the trader. As losses accumulate, the permission to take risk shrinks automatically — and at the hard stop it is gone entirely, regardless of how good the next idea looks.
The independent risk function. And here is the piece that makes all of the above real. The risk officer is independent from portfolio management and empowered to enforce controls across the portfolio [source: Resonanz Capital, as above; AlphaMaven, “Hedge Fund Risk Management Guide” — web-verified 2026-07-12]. The person who cuts you off does not have your position on, does not share your conviction, and is not paid to be right about the trade. They are paid to be right about the limit.
Level 2: What This Machinery Is Actually For
Here is the reframe that matters, and it is the reason this article exists.
Every one of those five layers is a pre-commitment device. Not a prediction. Not an edge. A decision made by a version of you who is calm, binding a version of you who will not be.
That is what the institution is really buying. It cannot make its traders less human. Instead it removes the moment of choice from the moment of pain. When the book is down 8% and the trader is certain — genuinely, sincerely certain — that this is the wrong time to cut, the limit does not care about their certainty. It was set before.
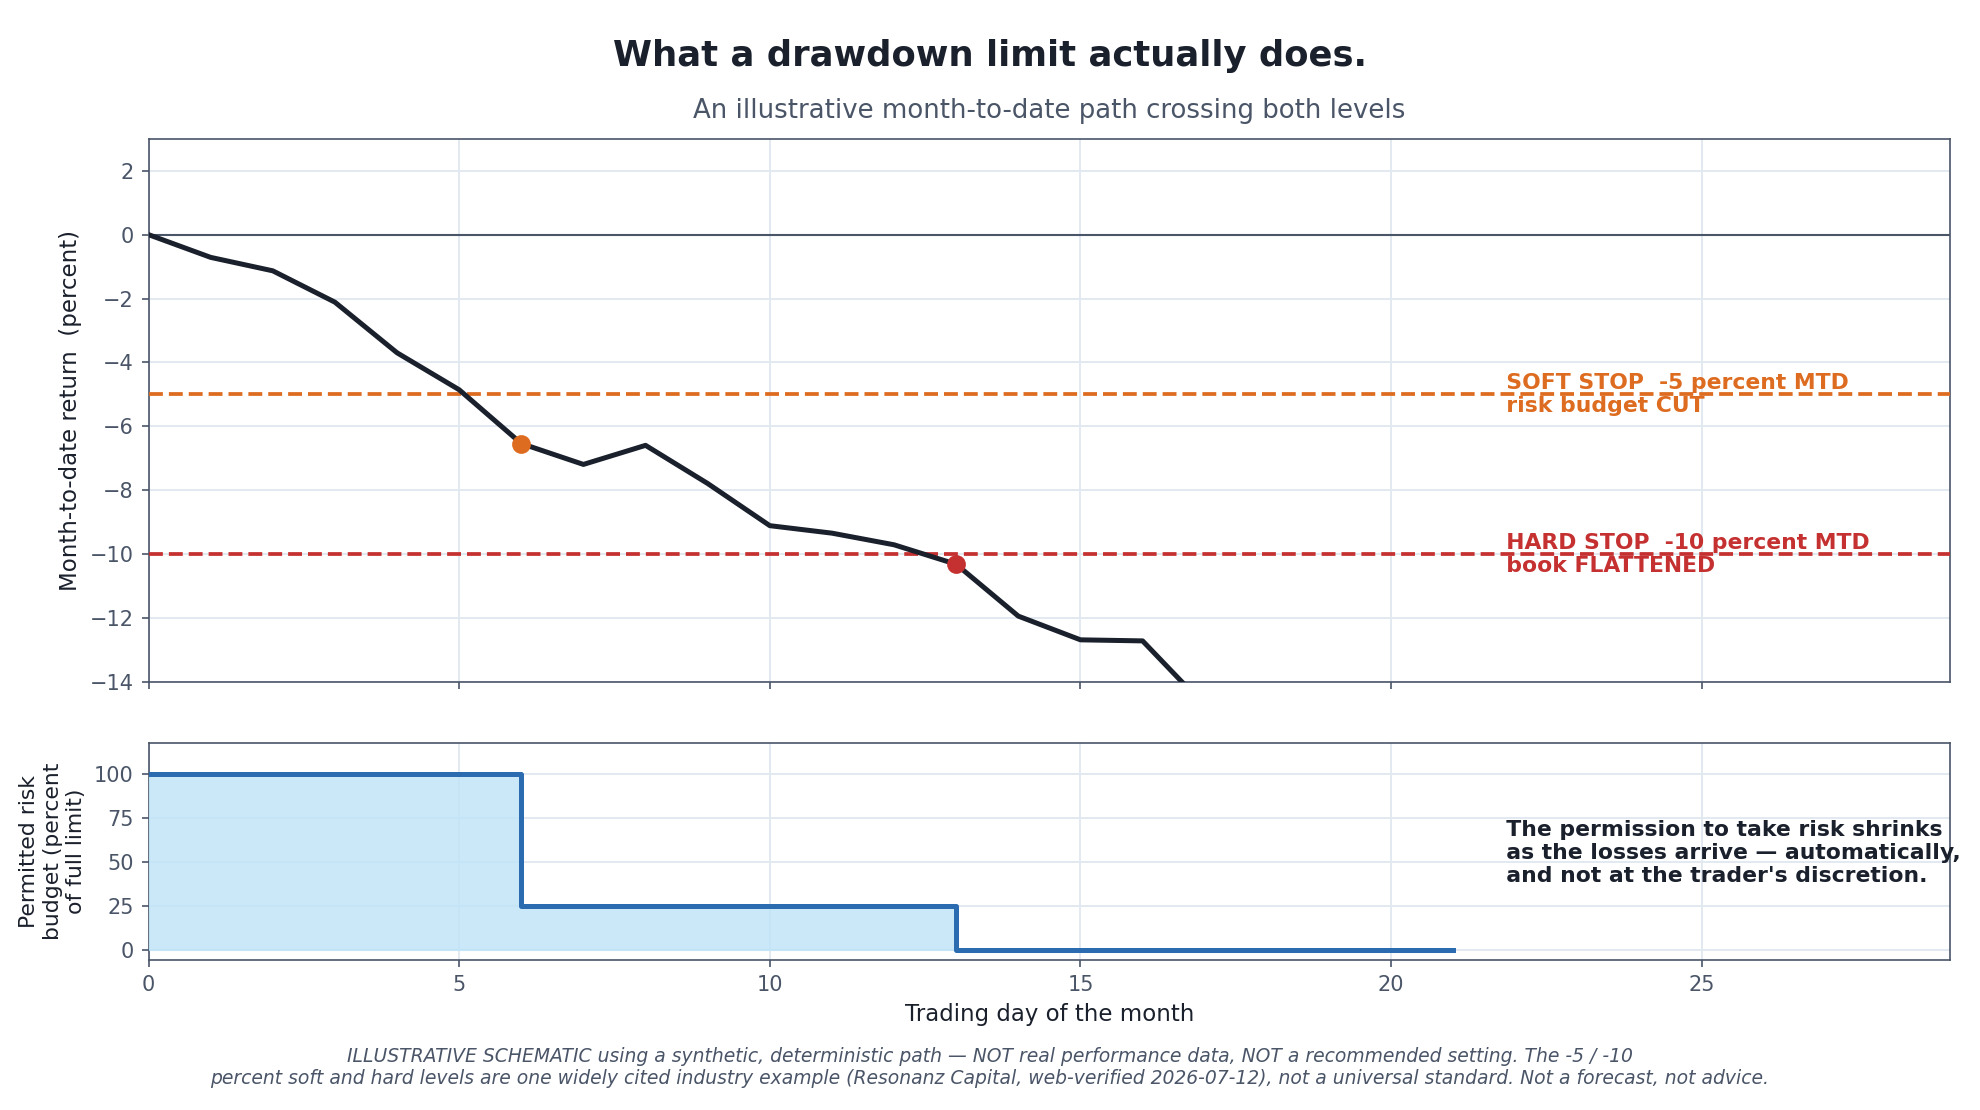 The mechanic in one picture. As the losses arrive, the permitted risk shrinks — automatically, without a conversation, and without the trader’s agreement. Illustrative schematic, not real performance data.
Compare this to the retail default. A retail account has none of these layers by default. Risk is decided at the moment of the trade, by the person who wants to make the trade, with no ceiling above them and nobody to turn them off. And it shows in the numbers: the practitioner rule of thumb is that institutional books run something like 5–10% of capital at total risk while retail traders often risk a large fraction of their capital on a single position [source: Traders MBA and Signal Pilot, as above — web-verified 2026-07-12; practitioner rules of thumb, not regulatory standards]. That gap is not a knowledge gap. It is a structure gap.
Level 3: What You Cannot Steal — And Why That Matters
An honest article about this style has to say what does not transfer. Copying institutional practice without institutional structure produces a costume, not a discipline.
You cannot make yourself independent. This is the big one, and no amount of rule-writing fully fixes it. The institutional risk officer works because they are a different person with different incentives. You will always be both the trader and the risk manager, which means every limit you set is a limit you can also revoke, quietly, at 2am, with a very good reason. The nearest honest substitutes are friction and pre-commitment — writing the limit down before the position exists, sizing with a calculator rather than a feeling, using platform-level tools that are annoying to override — and you should be clear-eyed that these are weaker than the real thing, not equivalent to it.
VaR is not a safety net. VaR answers “how bad is a normal bad day?” It is close to silent about the abnormal one — the tail, the gap, the day the correlations all go to one. Institutions know this; it is why they run stress tests and Expected Shortfall alongside it. A retail trader who adopts a VaR-shaped mental model without the stress tests has adopted the false comfort and left the cure behind.
The leverage context is completely different. In a multi-manager fund, capital allocated to a portfolio manager is already levered — so a 2% drawdown at the book level can be a 20% loss on the manager’s own allocated capital [source: Wall Street Oasis practitioner discussion of multi-manager risk limits — web-verified 2026-07-12; an industry practitioner claim, not an audited figure]. The tight-looking drawdown limits are tight because of the leverage sitting underneath them. Lifting the number without the structure is meaningless.
And the limits will cost you. This is the part almost nobody says out loud, so let’s say it clearly: a hard stop that flattens your book at −10% will, sometimes, flatten it at the exact bottom. The rule that saves you in the drawdown that keeps going is the same rule that hurts you in the drawdown that was about to reverse. You cannot have one without the other. Institutional risk limits are not free protection — they are a deliberate trade: you give up some of your best recoveries in exchange for surviving your worst declines. The institution takes that trade because a blown-up fund is an extinction event and a missed rebound is a bad quarter. Whether the same asymmetry applies to your account is a question only you can answer — but you should answer it knowing what you are giving up, not by pretending the limit is costless.
Level 4: The Four Pieces That Do Transfer
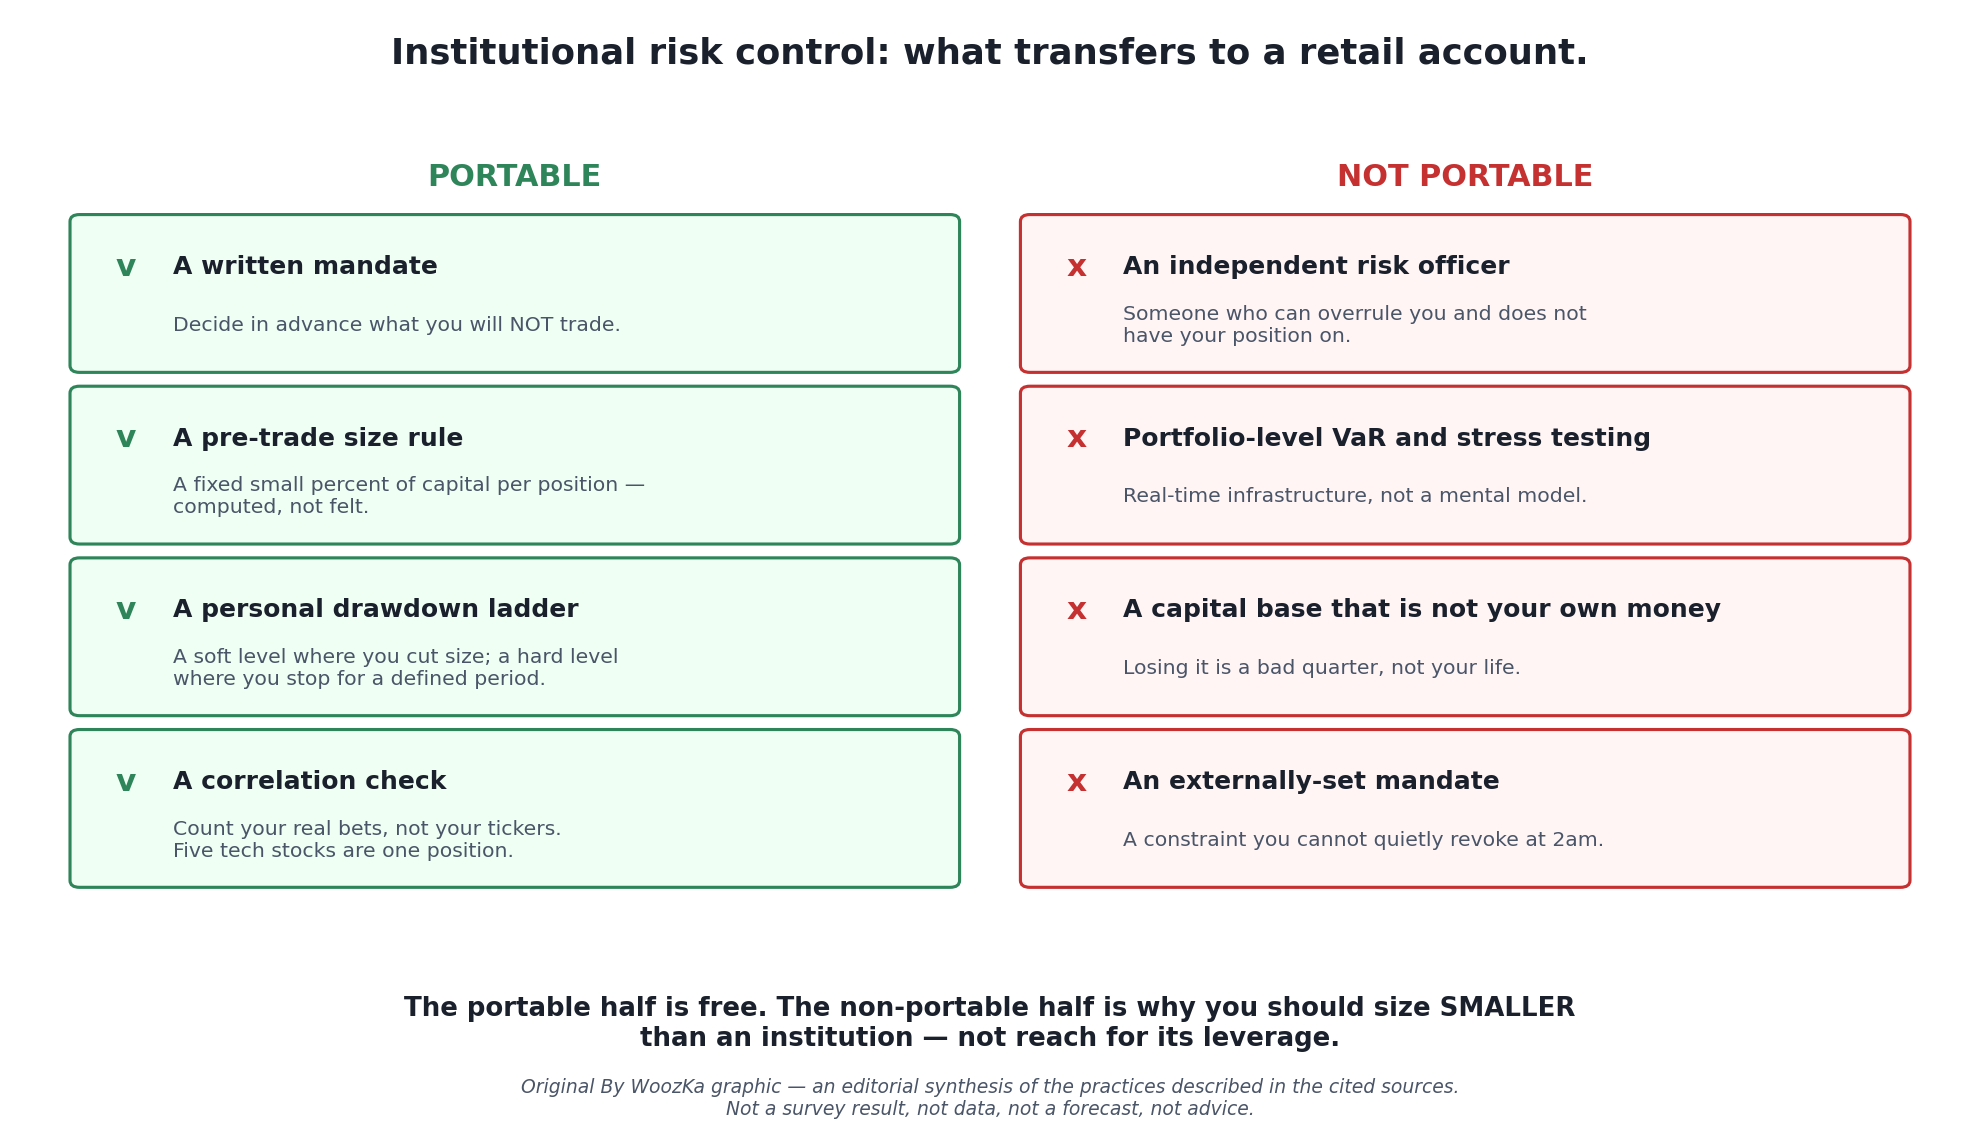 The honest split. The four things on the left cost nothing but discipline. The four on the right are why a retail trader’s correct response to institutional practice is to be more conservative than the institution, not less.
1. A written mandate. One paragraph, written when nothing is going on, saying what you trade and — more importantly — what you do not. Instruments you have decided are not yours. Leverage you have decided not to use. The value of it is entirely in the fact that it was written before.
2. A pre-trade position-size rule. Risk per position defined as a fixed, small percentage of capital, and computed — not estimated in the moment by the part of you that wants the trade. This is the single most portable institutional habit there is, and it is the one the position-size calculator exists for. See Position Sizing Rules for Systematic Traders and Risk of Ruin for why the size, not the edge, is what decides survival.
3. A personal drawdown ladder. Your own soft and hard stops, chosen in advance and written down: at drawdown X, size is cut; at drawdown Y, you stop trading for a defined period and review. Not because the numbers are magic — they are not, and the −5%/−10% example above is one industry illustration, not a prescription — but because the existence of a pre-set ladder is what removes the decision from the worst possible moment to be making it. Drawdown Explained covers the arithmetic of why the deep ones are so hard to come back from.
4. A correlation check. Before adding a position, ask what it is really a bet on. Five tech stocks are not five positions; they are one position wearing five hats. Institutions enforce this with sector and factor limits. You can enforce it with a question, honestly asked.
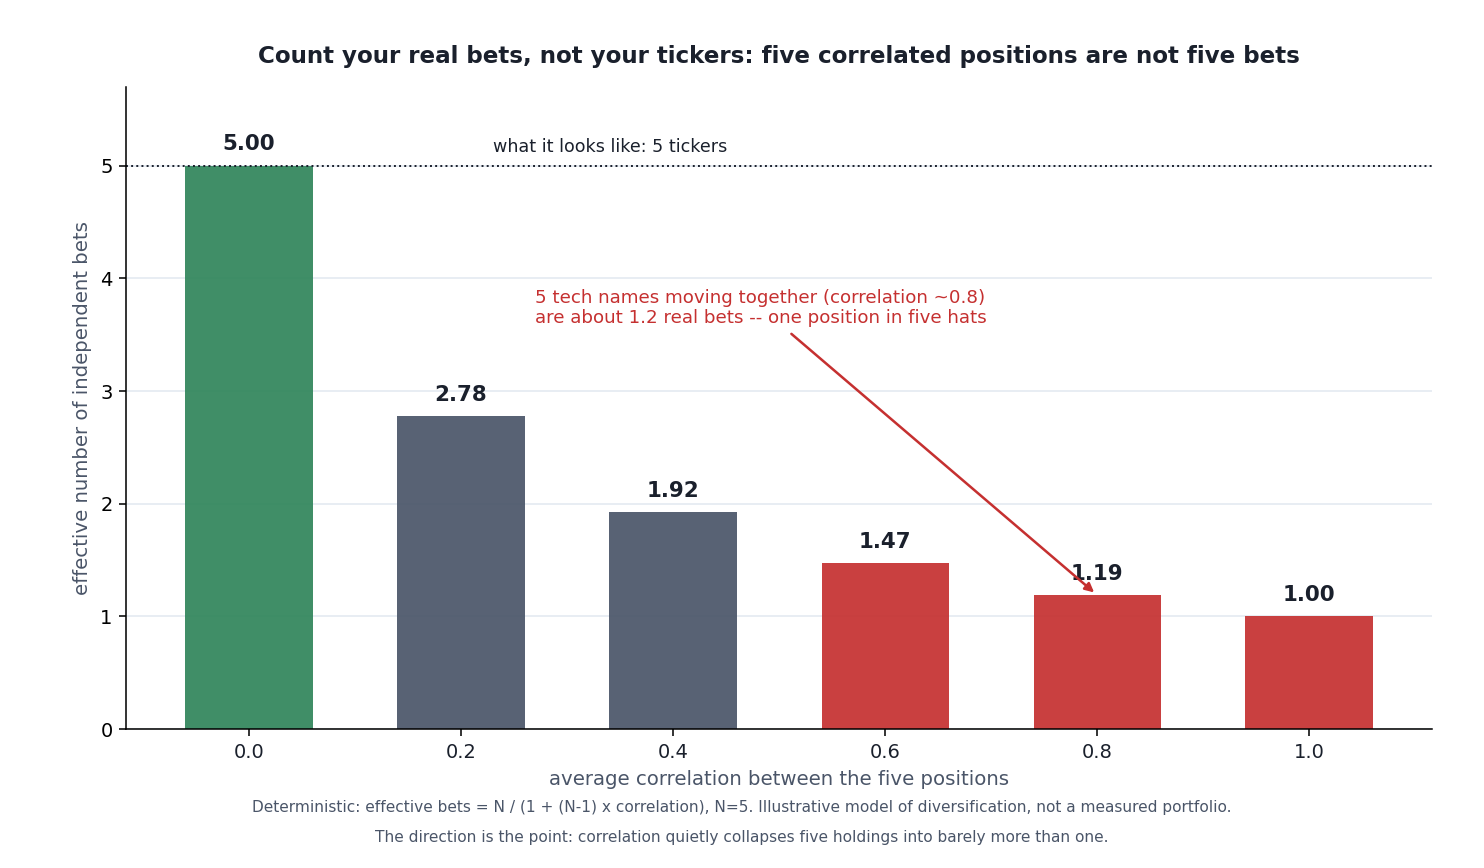 Why the correlation question is not pedantry. Diversification is measured in independent bets, not tickers, and correlation collapses the two fast: five names that move together at a correlation near 0.8 are barely more than one position. This is the arithmetic behind “one position wearing five hats” — and it’s why a portfolio that feels diversified can carry the concentration risk of a single trade. Deterministic model, not a measured portfolio.
That is the whole portable set. None of it predicts anything. All of it is about what happens after you are wrong.
I have been on the wrong side of my own rule often enough to know what it costs. Trading a funded account, I had a maximum loss written down before I started, and the stage where I failed was never the evaluation — it was later, with the rule in front of me, deciding that this particular trade was the exception. The rule feels stupid in that moment. It feels external, written by someone with less information than you have right now. That is precisely the moment it exists for. The version I run now is systematic, which removes the argument but not the arithmetic: a strategy that backtests at around a 1.4 to 1.5 profit factor is not comfortably inside a funded account’s drawdown limit, and even a stronger one can end a session badly if the risk side slips. The rule is not the thing capping the upside. It is the thing keeping there being an account at all.
What transfers, and what does not. The portable half is free. The non-portable half is why you should size smaller than an institution, not larger.
| Portable | Not portable |
|---|---|
| A written mandate — decide in advance what you will not trade | An independent risk officer who can overrule you |
| A pre-trade position-size rule — a fixed small percentage per position, computed not felt | Real-time portfolio-level VaR and stress-testing infrastructure |
| A personal drawdown ladder — a soft level where you cut size, a hard level where you stop for a defined period | A capital base that is not your own money |
| A correlation check — count your real bets, not your tickers | Someone else’s mandate constraining your discretion |
The Ladder, Priced
Three things sit on this page and are never joined to each other. Level 1 quotes a working example of the mechanic — a soft stop at −5% month-to-date where risk is cut back, a hard stop at −10% where it goes to zero — and calls it the most interesting layer here. Level 3 concedes that the rule which rescues one drawdown will, in another, flatten the book a few days before it would have turned. And the closing note carries a complete illustrative system: 55% wins at 1:1, an edge of +0.10R a trade, 2% of capital per position. The mechanic, the objection to it, and a system to run it on. Joining them costs nothing but arithmetic, and it turns the honest warning above from an assertion into a price.
One translation has to be made explicitly rather than quietly. The institutional soft stop cuts a VaR limit; the portable version in the table just above cuts position size. Those are different quantities and they are not mixed here — everything below models the portable version, the one a reader can actually operate, and k is simply the fraction the position size is cut to when the soft level is touched. A book that never cuts is k = 1.
How Much of the Brake Leaks Through
The first question is not how much the ladder helps but how often it is asked to. On this system the soft level is touched 60.551% of the time — and that figure is the same in every row below, because the cut only begins after the soft stop fires. What the cut changes is the share that carries on down to the hard stop.
The brake, at five settings. Middle column is the pass-through: of the books that touch −5%, the share that goes on to −10%.
| Size cut to | Risk per position | Pass-through | Ever reaches −10% |
|---|---|---|---|
| k = 1 (no ladder) | 2.000% | 60.551% | 36.665% |
| k = 3/4 | 1.500% | 51.227% | 31.019% |
| k = 1/2 (halved) | 1.000% | 36.665% | 22.201% |
| k = 1/3 | 0.667% | 22.201% | 13.443% |
| k = 1/4 | 0.500% | 13.443% | 8.140% |
Halving the size at −5% takes the pass-through from 60.551% to 36.665%, and the chance of ever reaching −10% from 36.665% to 22.201%. That is a real reduction and it is nothing like a rescue: even after halving, more than a third of the books that touch the soft level keep going to the hard one. The article’s judgment about self-enforcement — weaker than the real thing, not equivalent to it — turns out to describe the mechanic as well as the person operating it.
A Ladder Is a Deeper Stop Wearing a Disguise
There is an exact equivalence hiding in those numbers, and it is the most useful thing on this page. Cutting to half at −5% leaves the book with precisely the odds of reaching its hard stop that a book with no ladder at all and a hard stop at −15% would have. Not approximately: computed both ways the two agree to twelve decimal places, and they agree at every cut tested, not merely at the halving.
What each cut is worth, in depth. Last column is the same probability arrived at from the other direction — a plain stop at that depth, no ladder.
| Size cut to | Same odds as a plain stop at | Net losing trades to get there | Probability |
|---|---|---|---|
| k = 1 (no ladder) | −10.000% | 5.00 | 36.665% |
| k = 3/4 | −11.667% | 5.83 | 31.019% |
| k = 1/2 (halved) | −15.000% | 7.50 | 22.201% |
| k = 1/3 | −20.000% | 10.00 | 13.443% |
| k = 1/4 | −25.000% | 12.50 | 8.140% |
Read the halving row slowly, because it is the whole argument of this article expressed as a number. The laddered book is as hard to stop out as a book whose limit sits five points deeper — and when it does stop out, it has lost ten points, not fifteen. It buys the survival odds of the looser limit while keeping the loss cap of the tighter one. That is what a pre-commitment device is for, and it is why the institution bothers with two levels instead of one.
A second result follows from the same algebra and is worth more than it first appears: the multiplier depends only on where the soft level sits relative to the hard one and on how hard you cut — never on the depths themselves. A −3%/−6% ladder, a −5%/−10% ladder and a −10%/−20% ladder all return the identical figure of 1.500000 for a halving. So the article’s caution that the −5%/−10% pair is one industry illustration and not a prescription is stronger than it sounds. The shape is doing the work. The levels are free to be fitted to the account.
What the Trade Costs
Now the half the article insists on and does not price. Once the soft stop fires, the book climbs out of the hole at the reduced size too, so the ladder lengthens the recovery exactly as it lengthens the fall. Both effects have closed forms on a ladder whose soft level sits halfway to the hard one: protection scales as (1 + k) divided by 2k, recovery cost as 1 divided by k.
Two multipliers and the space between them. Both are counted in net trades, not in percent.
| Size cut to | Protection gained | Recovery lengthened | Gap |
|---|---|---|---|
| k = 1 (no ladder) | 1.0000× | 1.0000× | 0.0000 |
| k = 3/4 | 1.1667× | 1.3333× | 0.1667 |
| k = 1/2 (halved) | 1.5000× | 2.0000× | 0.5000 |
| k = 1/3 | 2.0000× | 3.0000× | 1.0000 |
| k = 1/4 | 2.5000× | 4.0000× | 1.5000 |
The gap is (1 − k) divided by 2k, and it is positive for every cut short of no cut at all. So the recovery penalty always exceeds the protection gain on this measure, and by an amount you can read off before you ever set the ladder rather than discovering it at −5%. That is the sentence in Level 3 — you give up some of your best recoveries in exchange for surviving your worst declines — with a number attached, and the number says the exchange is genuinely a cost rather than a wash dressed up as one.
Which does not make the trade a bad one, and the arithmetic says why. What you buy is a bound: the hard stop makes the loss finite by construction. What you pay is time, measured in trades. A bounded loss against a slower climb is a good exchange whenever the unbounded outcome ends the account, which is the article’s own framing of an extinction event against a bad quarter — and the reason a retail trader, whose capital cannot be topped up by an allocator, should read the exchange as more attractive rather than less.
One figure that could have gone here was left out deliberately. Level 3 reports that a 2% book-level drawdown can be a 20% loss on a portfolio manager’s own allocated capital, and it would be easy to run that ten-to-one factor through the −5%/−10% ladder and print a dramatic number. It comes from a different source describing a different structure, and neither source reports the combination, so the product would be a figure nobody measured. The article joins those two facts in words on purpose. They are not multiplied here.
Method and limits, so this can be checked rather than taken on trust. Nothing was supplied from outside the article: the two ladder levels come from the industry example quoted in Level 1, reading them as a size cut comes from row three of the portable table, and the 55%-at-1:1 book risking 2% a position comes from the closing note. The probabilities were read off the Risk of Ruin Simulator that ships on this site, and separate code rebuilds every one of them from the characteristic equation, reporting nothing unless its own values, the deeper-stop equivalence at each of the five cuts, and the 13.4% and 0.03% this article publishes for itself all agree to twelve places. What comes with that calculator is its model: fixed risk units, trades that do not influence one another, and no clock. A percentage here is therefore the chance of a depth being touched ever, while the ladder it describes resets monthly, and those are not the same question. Trades are counted net, wins against losses, which the 1:1 payoff makes exact; what percentage gain repairs a percentage loss is a different subject and belongs to Drawdown Explained. No backtest was run, no market data entered any of it, and no account’s future is being forecast.
The Summary
The institutional edge in risk is not that professionals are less emotional. It is that professionals are structurally prevented from acting on their emotions, by limits set in advance and enforced by someone else.
You cannot fully reproduce that alone. What you can do is take the half that is free — write the mandate, compute the size, set the ladder, count the real bets — and be honest about the half that is not. And the correct conclusion from the honest half is the uncomfortable one: given that you have no independent risk officer, no stress-testing infrastructure, and no capital but your own, the rational response to institutional practice is to be more conservative than an institution, not to reach for its leverage.
The style, in one line: institutional risk management is not a way to win. It is a way to still be playing.
Keep Going
- Position Sizing Rules for Systematic Traders — the mechanics of the single most portable institutional habit.
- Risk of Ruin: The Math Every Leveraged Trader Should Know — why size, not edge, decides survival, and the arithmetic behind the drawdown ladder.
- Drawdown Explained — the recovery asymmetry that makes a hard stop rational in the first place.
- What Makes a Trading System Robust? A Checklist — the system-level companion: risk framework and robustness are the same conversation from two angles.
- How to Backtest a Trading Strategy the Right Way — because a risk limit set from an over-optimistic backtest is a limit set on a fantasy.
If you want the plain-English, rigor-first read on building and judging trading systems — including the parts that cost you something — that’s what the newsletter is for. Subscribe below.
What a risk limit actually buys: a modest edge — 55% wins at 1:1, +0.10R a trade — carried at 2% of capital per position has a 13.4% chance of a 20% drawdown. Cut the per-position risk to 0.5% and it falls to 0.03%. Nothing about the strategy improved. This is the piece that transfers from the institutional side: the limit is not caution, it is what keeps a small edge alive long enough to compound. The Risk of Ruin Simulator runs the same arithmetic on your own numbers.
Disclaimer: This article is educational content, not financial advice. I am not a licensed financial advisor, and nothing here is a recommendation to buy or sell any security or asset. Investing and trading involve risk, including the possible loss of the money you invest. Do your own research and consider consulting a licensed financial professional before making investment decisions. Read the full Disclaimer.
Historical and backtested results are hypothetical, carry inherent limitations, and do not guarantee future results. Figures were accurate to the best of my knowledge as of this article’s last-updated date and may have changed.
