The Power of Compounding Explained: Why Time Beats Timing
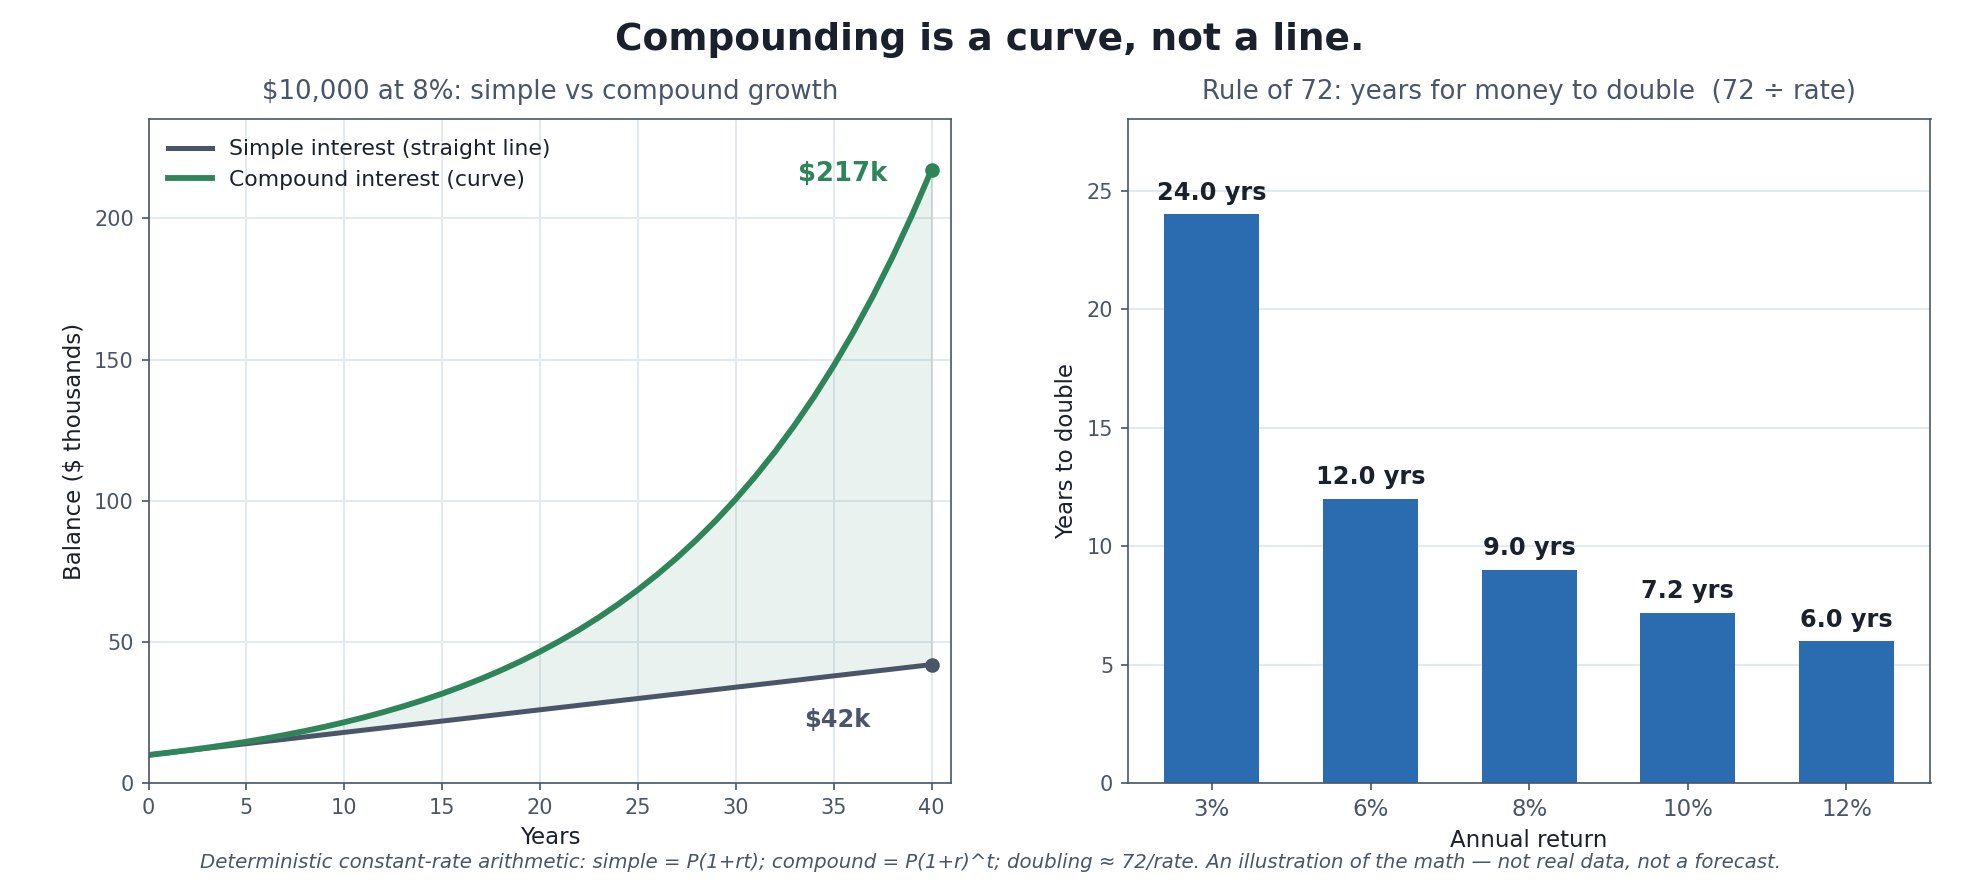
The single idea behind every “start early” lecture, drawn out. Simple interest is a straight line — you earn the same amount every year. Compounding curves, because each year’s return is earned on a larger base that includes all the previous returns. The two lines start together and look almost identical for years; the drama is almost all in the back half. That shape is why time in the market matters more than the exact rate — and why the caveats in the second half of this article matter just as much.
Compounding gets called the eighth wonder of the world so often that the phrase has lost its meaning. Strip away the mystique and it’s a simple, exact mechanism: you earn returns not just on your original money, but on the returns your money has already earned. That’s it. But that small recursion — returns earning returns earning returns — is the difference between a straight line and a curve, and over a working lifetime the curve pulls so far away from the line that it looks like magic. It isn’t magic. It’s arithmetic, and understanding exactly how it works (and, just as importantly, how it can quietly work against you) is one of the highest-leverage things a beginner can learn about money.
Simple vs. Compound: The Whole Idea in One Contrast
Start with the thing compounding is not, because the contrast is the entire lesson. Simple interest pays you a fixed amount each period based only on your original principal. Put $10,000 in at 8% simple interest and you collect $800 every year — year one, year ten, year forty, always $800, because the interest is always computed on the original $10,000. After 40 years you’ve added 40 × $800 = $32,000, for $42,000 total. That’s the straight line in the chart: steady, predictable, linear.
Compound interest pays you a return on your current balance — principal plus all the returns you’ve already earned. Year one you earn 8% on $10,000 = $800, same as before. But year two you earn 8% on $10,800, not $10,000 — so you earn $864. Year three, 8% on $11,664 = $933. Each year the base is bigger, so each year’s return is bigger, and the growth accelerates. After 40 years that same $10,000 at 8% compounded becomes about $217,000 — more than five times what simple interest produced, from the identical starting amount and the identical rate. The only difference is that compounding let each year’s earnings go back to work.
The formula is exact and worth carrying in your head:
Future value = Principal × (1 + rate)^number of periods
The $217,000 figure is just $10,000 × (1.08)^40. The exponent — the number of compounding periods — is where the power lives, because it’s an exponent, not a multiplier. That’s the mathematical reason the compound line curves while the simple line stays straight: linear growth adds, exponential growth multiplies.
The Rule of 72: Compounding Math You Can Do in Your Head
You don’t need a calculator to get an intuition for compounding, thanks to a shortcut that’s been around for centuries. The Rule of 72 estimates how long an investment takes to double at a given constant rate:
Years to double ≈ 72 ÷ annual return (in %)
At 8% a year, money doubles in roughly 72 ÷ 8 = 9 years. At 10%, about 7.2 years. At 3%, about 24 years. The rule is an approximation — it’s most accurate for rates in the rough 5–10% range and drifts a little at the extremes — but it’s close enough to reason with instantly [source: the Rule of 72 estimates doubling time as 72 ÷ rate, assuming a constant compounded return; the shortcut traces back to the study of compound interest in Renaissance Europe and is often linked to Luca Pacioli’s 1494 Summa de arithmetica, with 72 favored because it divides evenly by so many common rates — see Wikipedia “Rule of 72” and Saxo, verified via web search 2026-07-10].
The Rule of 72 makes two things vivid. First, small differences in rate compound into enormous differences in outcome, because they change how many times your money doubles over a lifetime. Over 40 years, money doubles about 1.7 times at 3% but about 4.4 times at 8% — and each doubling is applied to an already-doubled base, so the ending gap is vast, not proportional. Second, it reframes fees and inflation correctly: a 1% annual fee doesn’t cost you “1%,” it stretches every doubling out longer, quietly stealing whole doublings over a lifetime (the subject of the expense ratios explainer). The rule is the fastest way to feel why the rate matters — and why anything nibbling at the rate matters more than it looks.
Why Most of the Growth Arrives Late
Here’s the property of compounding that trips up almost everyone, and it’s written all over the left panel of the chart: the curve is nearly flat for years and then bends sharply upward — most of the growth happens at the end. This is not a quirk of the example; it’s inherent. Each year’s dollar gain is a percentage of the current balance, so the biggest dollar gains necessarily come when the balance is biggest, which is late. In the $10,000-at-8% example, the account grows by about $800 in the first year — but by its final year it grows by roughly $16,000, twenty times as much, because it’s 8% of a far larger number.
Two consequences follow, and they’re the practical heart of the “power of compounding.”
Time is the dominant lever — more than the rate, and far more than timing. Because the exponent is what drives the curve, adding years to the front of the process is worth more than almost anything else you can do. An investor who starts at 25 and stops contributing at 35 can easily end up ahead of one who starts at 35 and contributes for thirty straight years, purely because the early money had more doublings to work through. This is the real, defensible version of “time in the market beats timing the market”: you cannot reliably control the rate or predict the market’s turns, but you can control how early you start and how long you stay invested — and those are the inputs the exponent rewards most.
The early, boring years are the price of admission. The flat part of the curve is where most people quit, because the visible progress is small relative to the effort of saving. But that flat stretch is not compounding failing to work — it’s compounding loading the base that the later, dramatic growth is computed on. Skipping it isn’t skipping a slow phase; it’s forfeiting the large phase, because the big numbers at the end only exist because of the small numbers at the beginning.
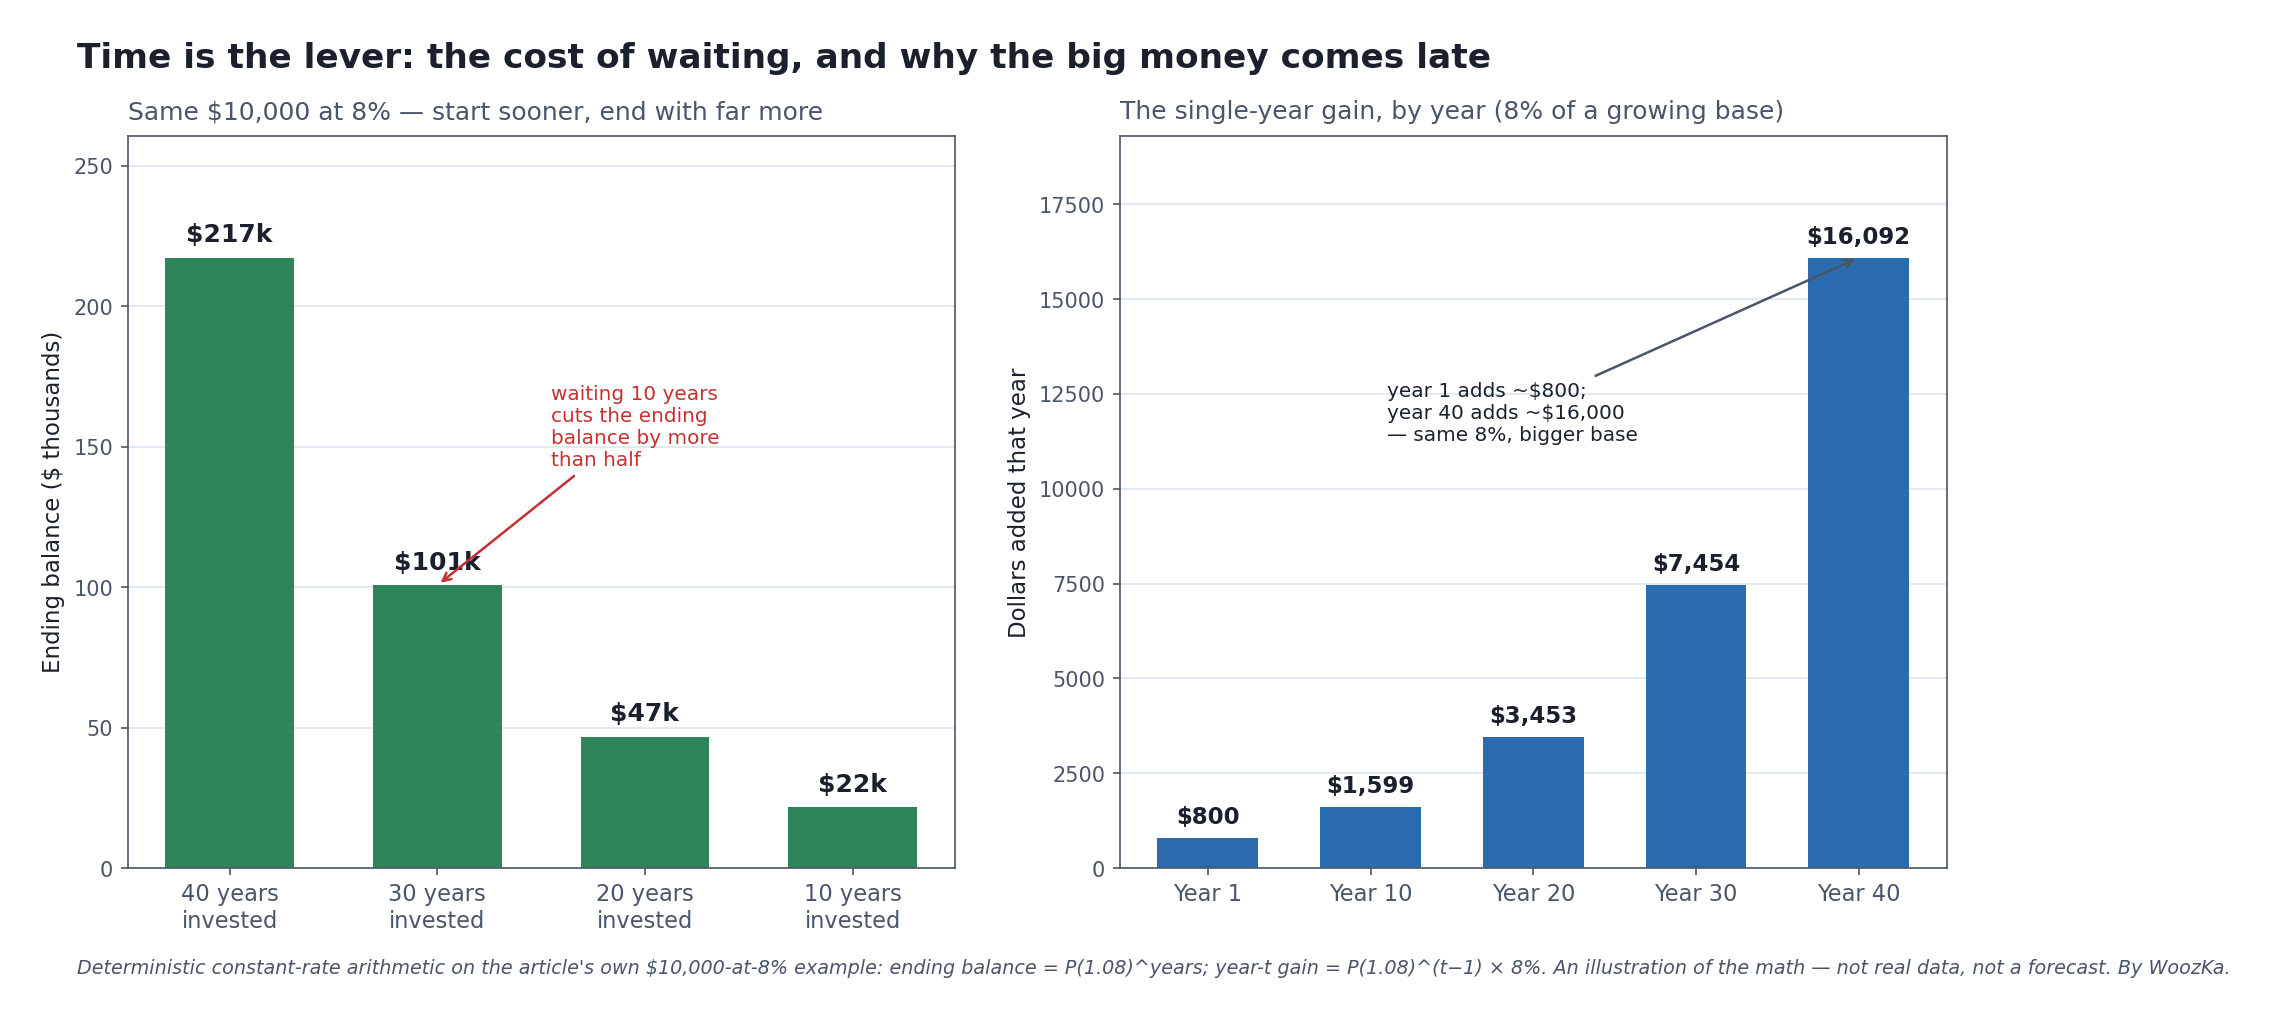
The same lesson from two angles, both deterministic. On the left, the cost of waiting: fewer years left to compound means a dramatically smaller ending balance. On the right, why the growth arrives late: because each year’s gain is 8% of a bigger base, the year-40 gain (~$16,000) dwarfs the year-1 gain (~$800). An illustration of the mechanism, not a forecast.
Contributions vs. Growth: Where the Money Comes From
If you keep adding money over time — the normal way people actually invest — compounding produces a satisfying crossover worth understanding. Early on, your balance is almost entirely the money you contributed; the growth is a thin slice on top. But because contributions add linearly while growth compounds exponentially, there comes a point where the growth overtakes the contributions, and eventually the account is mostly earnings you never deposited. In a decades-long plan, the majority of the final balance is typically growth, not principal — the account ends up made mostly of money that money earned. Watching when that crossover happens for your own numbers is one of the most motivating things you can do, and it’s exactly what the companion calculator visualizes.
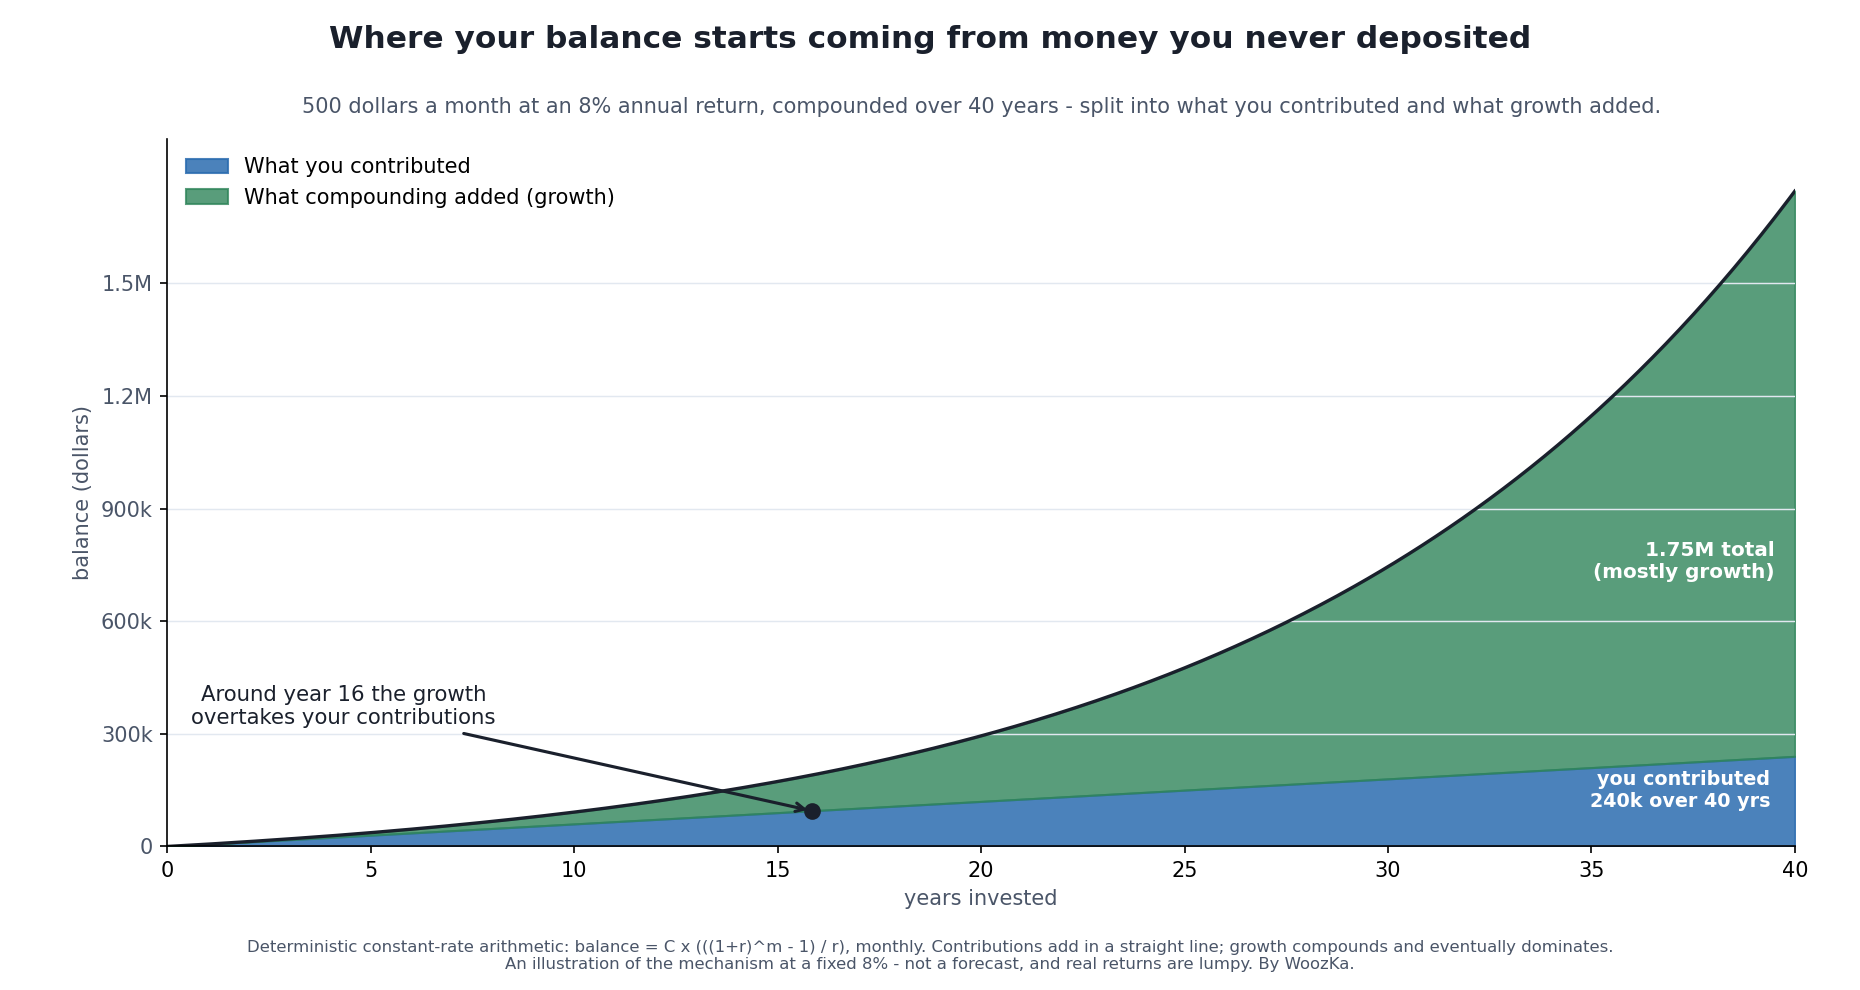
The crossover, drawn out. Contributions are a straight line; growth is a curve. For years the balance is mostly your own deposits, then the growth catches up (here around year 16) and eventually dwarfs them — which is why the boring early years are the price of admission, not a phase to skip.
The Early Starter, the Rule of 72, and When the Growth Lands
This article makes three quantitative claims and settles none of them. It says an investor who starts at 25 and stops at 35 “can easily end up ahead” of one who contributes for thirty straight years. It says the Rule of 72 is most accurate between 5% and 10% and “drifts a little at the extremes.” And its heading promises that most of the growth arrives late, then evidences that with two annual gains rather than a share of the total. Each one has an exact answer, and the answers are more specific than the claims.
Starting ten years earlier, priced
Take the article’s own sentence literally. One investor contributes from 25 to 35 and then never adds another dollar; the other starts at 35 and contributes every year to 65. Both are valued at 65. Because each balance is a straight multiple of the yearly contribution, the contribution amount cancels out of the comparison completely — checked at $1, $500, $6,000 and $25,000 a year, all four give the ratio 1.286804162. So the table below is per $1 a year, and it is the same table at any deposit you like.
| Annual return | Early starter | Late starter | Early ÷ late |
|---|---|---|---|
| 3% | $27.83 | $47.58 | 0.585× |
| 4% | $38.94 | $56.08 | 0.694× |
| 5% | $54.36 | $66.44 | 0.818× |
| 6% | $75.70 | $79.06 | 0.958× |
| 7% | $105.17 | $94.46 | 1.113× |
| 8% | $145.77 | $113.28 | 1.287× |
| 9% | $201.57 | $136.31 | 1.479× |
| 10% | $278.10 | $164.49 | 1.691× |
At the 8% this article uses throughout, the early starter finishes 28.7% ahead while putting in a third as much money — ten deposits against thirty. That is the claim, and it holds. But the table also shows the part the claim leaves out: the advantage is not a property of starting early, it is a property of starting early at a high enough return. The two strategies cross at 6.283%. Above that line the ten early deposits win; below it the thirty later ones do, and at 3% the early starter ends with barely more than half. The sentence “can easily end up ahead” is true at the rate the article assumes and false at a rate a conservative portfolio might actually earn — and nothing about the saver changes in between.
How wrong the Rule of 72 is, and where it is exactly right
The exact time to double at a constant return is ln 2 ÷ ln(1 + r). The rule divides 72 by the percentage. Setting the two equal has one solution, and it sits at 7.847% — which is why the article’s headline example is so clean: at 8% the shortcut is wrong by about two and a half days.
| Annual return | Exact doubling | Rule of 72 | Overstated by |
|---|---|---|---|
| 1% | 69.661 yr | 72.000 yr | +2.339 yr |
| 2% | 35.003 yr | 36.000 yr | +0.997 yr |
| 3% | 23.450 yr | 24.000 yr | +0.550 yr |
| 5% | 14.207 yr | 14.400 yr | +0.193 yr |
| 8% | 9.006 yr | 9.000 yr | −0.006 yr |
| 10% | 7.273 yr | 7.200 yr | −0.073 yr |
| 12% | 6.116 yr | 6.000 yr | −0.116 yr |
| 15% | 4.959 yr | 4.800 yr | −0.159 yr |
| 20% | 3.802 yr | 3.600 yr | −0.202 yr |
The article’s accuracy claim survives measurement, which is worth saying plainly because it did not have to. Swept across every tenth of a point, the rule’s worst error between 5% and 10% is 1.36%, against 3.36% anywhere in 1–5% and 5.31% in 10–20%. So the band it names is genuinely the good one. Two details the band hides: the error changes sign at 7.847%, so below that the rule is pessimistic and above it optimistic, and the damage is lopsided — the rule is roughly one and a half times worse at the top end than the bottom. At 20% it understates the doubling by about two and a half months, which is the direction that flatters.
“Most of the growth” is 56% of it
The article demonstrates late-arriving growth with the year-40 gain (~$16,000) against the year-1 gain ($800). That is a comparison of two single years. The claim it is used to support is about the whole run, so here is the whole run, on the same $10,000 at 8%.
| Years | Balance at end | Growth in that decade | Share of all growth |
|---|---|---|---|
| 1–10 | $21,589.25 | $11,589.25 | 5.59% |
| 11–20 | $46,609.57 | $25,020.32 | 12.07% |
| 21–30 | $100,626.57 | $54,017.00 | 26.06% |
| 31–40 | $217,245.21 | $116,618.65 | 56.27% |
“Most of the growth arrives late” turns out to be literally true rather than loosely true: 56.27% of the entire forty-year gain lands in the last ten years, and the final decade carries 10.06 times the share the first one does. The first decade contributes 5.59% — one dollar in eighteen of everything the account ever earns.
There is a stronger version of this, and it is an identity rather than an example. That 56.27% is not a fact about 8% or about forty years; it is fixed by the number of doublings alone. Forty years at 8% is 4.4413 doublings. Hold that constant and vary the rate — 4% over 78.490 years, 6% over 52.832, 12% over 27.164 — and the share of growth arriving in the final quarter of the horizon is 56.271% in every case, with a spread across all six pairs of two parts in a hundred trillion of a percentage point. That is what makes the article’s point about the “flat part” defensible in general and not just in its own example: the shape of the curve is set by how many times the money doubles, and a low return does not change the shape, only how long you have to stand there for it.
Every balance above was produced twice, once in separate code and once by the site’s Compound Growth Calculator, and the two agree to the cent. Inputs are the article’s own — $10,000, 8%, forty years, the 3%/8%/10% rates it uses with the Rule of 72, and the ages 25, 35 and 65 from its own sentence. Deposits are end-of-year, returns are constant, and taxes, fees and inflation are all excluded, so these are the arithmetic ceiling rather than an expectation; the caveats that follow apply to every number above. The article’s own published figures — $42,000 of simple interest, about $217,000 compounded, $800/$864/$933, the ~$16,000 final year and its “twenty times”, and the 1.7 and 4.4 doublings at 3% and 8% — were recomputed and are correct.
The Honest Caveats: What the “Miracle” Story Leaves Out
Compounding is real, but the breezy version of the story — pick a rate, run the formula, retire rich — hides four things that decide whether the curve in the chart resembles your actual result. Leaving them out isn’t optimism; it’s how people end up disappointed or, worse, misled.
A constant rate is a fiction. Every clean compounding curve, including the one above and the one your calculator draws, assumes the same return every single year. Real markets don’t do that. They deliver a lumpy sequence of gains and losses — up 20%, down 15%, up 8% — that averages out to something, but the path is jagged, and the order of those returns matters (a bad stretch early or right before you need the money — “sequence-of-returns risk” — can leave you worse off than the smooth average implies). The formula gives you the average destination assuming a straight road; the real road has potholes, and some of them are deep. Treat every constant-rate projection as an illustration of the mechanism, never a prediction of your balance.
Inflation quietly lowers the real rate. The $217,000 in the chart is a nominal number — dollars, not purchasing power. If prices roughly triple over 40 years (historically ordinary), that ending balance buys far less than $217,000 buys today. Compounding still wins in real terms at reasonable rates, but the honest comparison is always after subtracting inflation, which is the entire subject of the nominal vs. real return explainer. A “10% return” in a 3%-inflation world is really closer to a 7% gain in what your money can buy — a big difference over decades.
Fees compound against you, too. The same exponential math that grows your money grows the cost of any percentage skimmed off it. A 1% annual fee doesn’t cost you 1% once; it compounds every year on a shrinking-relative-to-what-it-could-have-been base, and over a lifetime it can consume a startling fraction of your final balance — often far more than the small-sounding number suggests. Compounding is neutral about direction: it magnifies whatever it’s applied to, including drag. (The expense ratios explainer and its calculator show exactly how much.)
Debt is compounding pointed the wrong way. This is the caveat that turns compounding from a feel-good story into a genuinely useful mental model, because the exact same mechanism runs in reverse on money you owe. Credit card balances compound against you — interest on interest — and often at rates far higher than any investment reliably earns, which is why carrying high-interest debt while trying to invest is usually a losing race (see the cost of carrying credit card debt and APR vs. APY). The single most reliable “investment” available to most people isn’t a fund at all — it’s paying off a high-interest balance, because it stops a guaranteed, high-rate compounding loss. Compounding is a force, not a friend; whether it builds you up or grinds you down depends entirely on which side of it you’re standing.
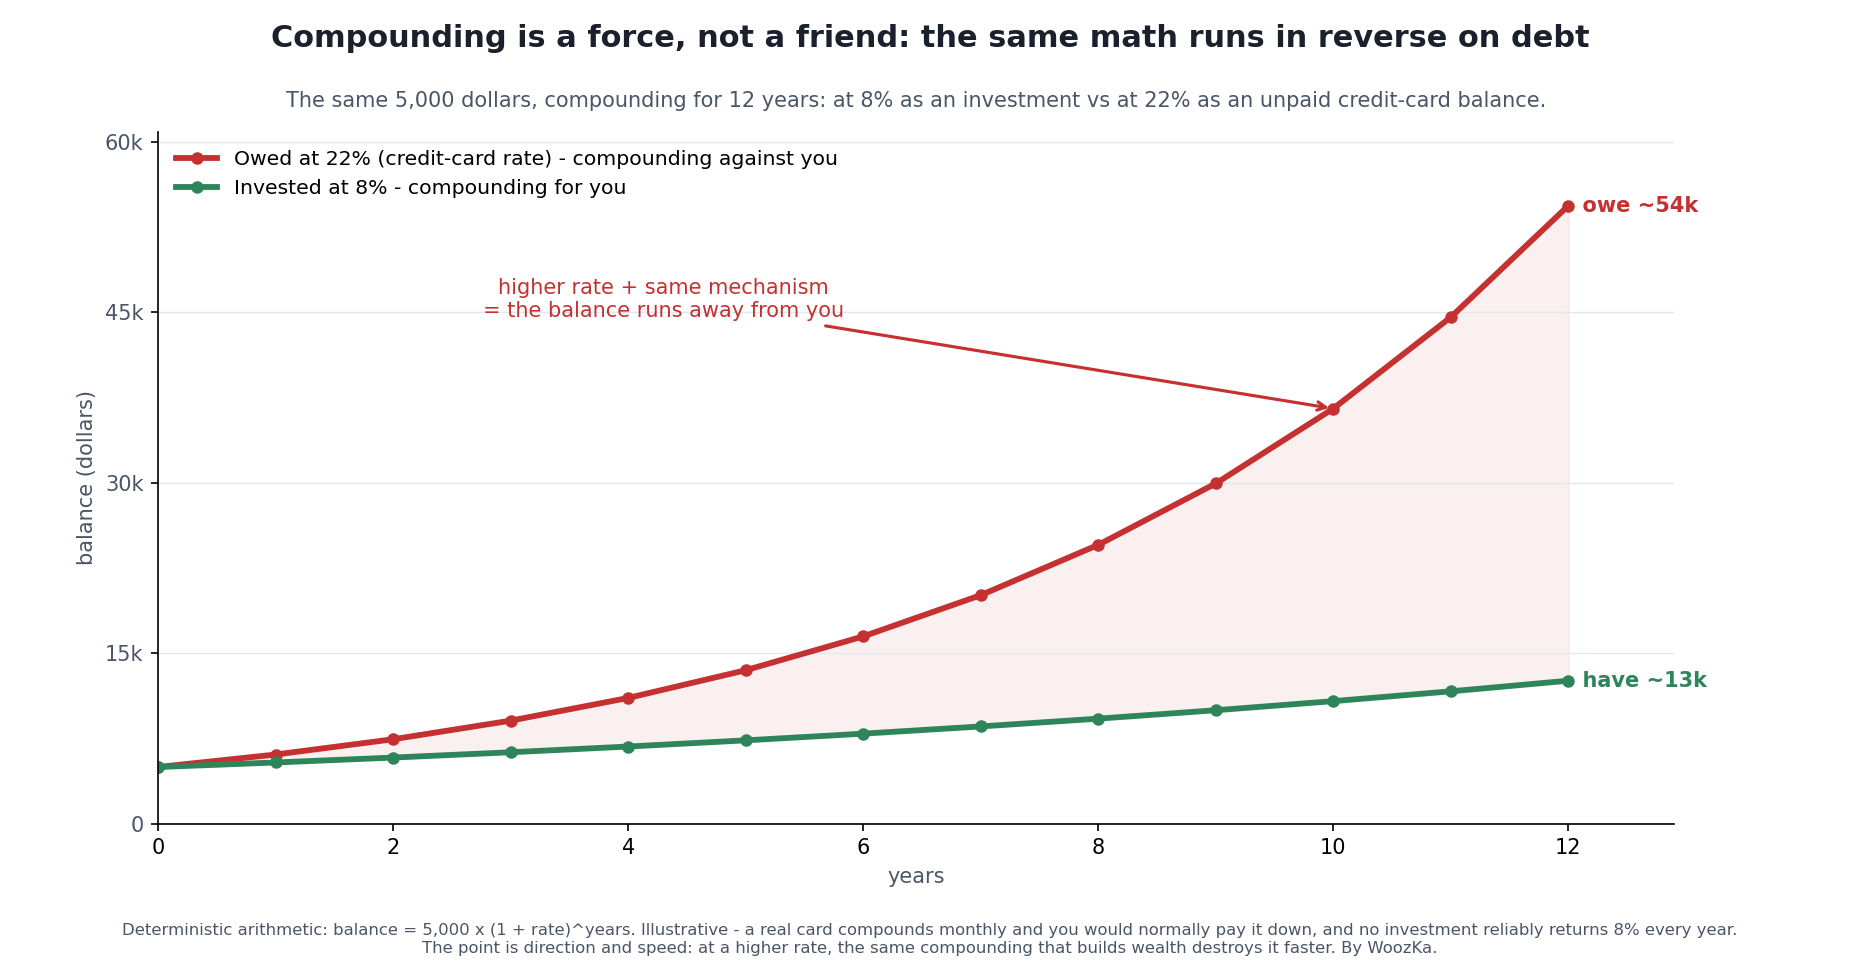
The mental model in one picture. Compounding does not care which side of it you are on — at the higher rates typical of credit-card debt, the same force that slowly builds wealth destroys it much faster. That is why clearing a high-interest balance is often the highest-return move available.
If compounding hasn’t clicked for you yet, it usually clicks the first time you run your own numbers far enough into the future to see the curve bend. The common version of the experience goes like this: someone assumes that saving is basically linear — put in X per month, end up with X times the months — and then they extend the projection over thirty or forty years and are startled, because the ending number is several times larger than everything they contributed. The startle is the exponent doing its work. And the flip side lands just as hard: the first time you look at what a lingering high-interest balance actually costs over years, you feel compounding from the losing side, and it reorganizes your priorities fast. The people who build wealth slowly aren’t usually the ones who found a spectacular rate. They’re the ones who started early, kept the drag low, avoided compounding debt, and left the curve alone long enough to reach its steep part.
Run It on Your Own Numbers
The Compound & DCA Calculator turns all of this from a story into your story. Enter a starting amount, a regular contribution, a rate, and a horizon, and it projects the balance forward and — the part that makes compounding real — splits the ending total into what you contributed versus what growth added, so you can see the crossover happen. It’s an educational model, not a forecast: it assumes the constant rate this article just warned you about, ignores inflation, taxes, and fees unless you account for them, and shows the smooth curve rather than the jagged real path. Use it to build intuition about how time, rate, and contributions trade off — not to predict your balance on a specific future date.
Where to Go Next
Compounding is the engine under most of personal finance; these pieces show where it shows up and where it bites:
- Nominal vs Real Return: Why Your 7% Isn’t 7% — the inflation adjustment that turns a nominal compounding curve into what it can actually buy.
- Expense Ratios Explained — compounding pointed at fees: how a fraction of a percent a year eats a large slice of the final curve.
- The Real Cost of Carrying Credit Card Debt and What Is APR vs APY? — compounding running in reverse, on money you owe, usually at a rate no investment reliably beats.
- How to Automate Your Investing — the practical way to guarantee you actually stay invested through the flat years the exponent needs.
- The Economic Machine Explained — the pillar. The same compounding logic at the scale of a whole economy’s credit and growth.
If you want the plain-English, rigor-first read on money and markets — the honest version, where every number comes with what it can’t tell you attached — that’s what the newsletter is for. Subscribe below.
Disclaimer: This article is educational content, not financial advice. I am not a licensed financial advisor, and nothing here is a recommendation to buy or sell any security or asset. Investing and trading involve risk, including the possible loss of the money you invest. Do your own research and consider consulting a licensed financial professional before making investment decisions. Read the full Disclaimer.
Historical and backtested results are hypothetical, carry inherent limitations, and do not guarantee future results. Figures were accurate to the best of my knowledge as of this article’s last-updated date and may have changed.
