The Lever You Actually Control: Why Your Savings Rate Beats Your Return for Years
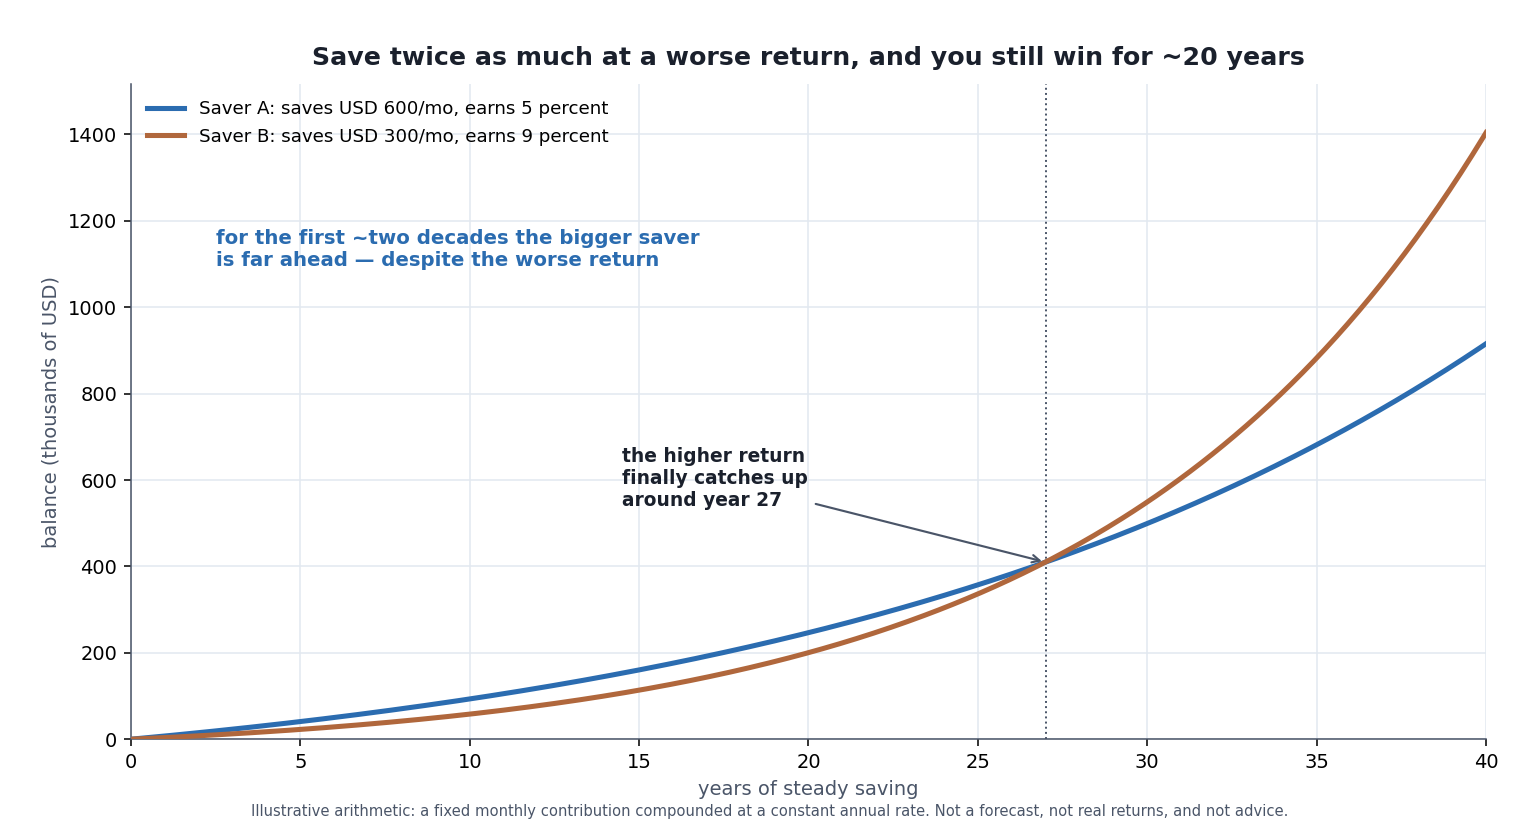 The whole argument in one frame. Saver A saves twice as much as Saver B but earns four points less on it, and still comes out ahead for roughly the first 27 years. Almost everyone reading this is inside that window. This article is about why the boring lever — how much you feed the account — beats the exciting one for so long, and, just as honestly, when that stops being true.
Most investing writing is about return. Which fund, which allocation, which strategy, how to squeeze another point or two out of the market. It’s the fun part, and it’s the part that fills the internet. But for the first decade or two of actually building wealth, return is not where the action is. The size of your pile is set almost entirely by a variable nobody finds glamorous: how much money you put into it.
Here’s the part that makes it worth an article. That variable — your savings rate — is also the one you actually control. You can decide, this month, to move another hundred dollars from spending to investing, and it happens. You cannot decide to earn 9 percent instead of 5. So the lever that matters most early is also the only one with your hand on it. That’s a rare and useful alignment, and it’s worth understanding precisely, including where it breaks down.
The Arithmetic Nobody Wants to Hear
Start with the least exciting chart I could draw, because it settles the argument before we’ve had it.
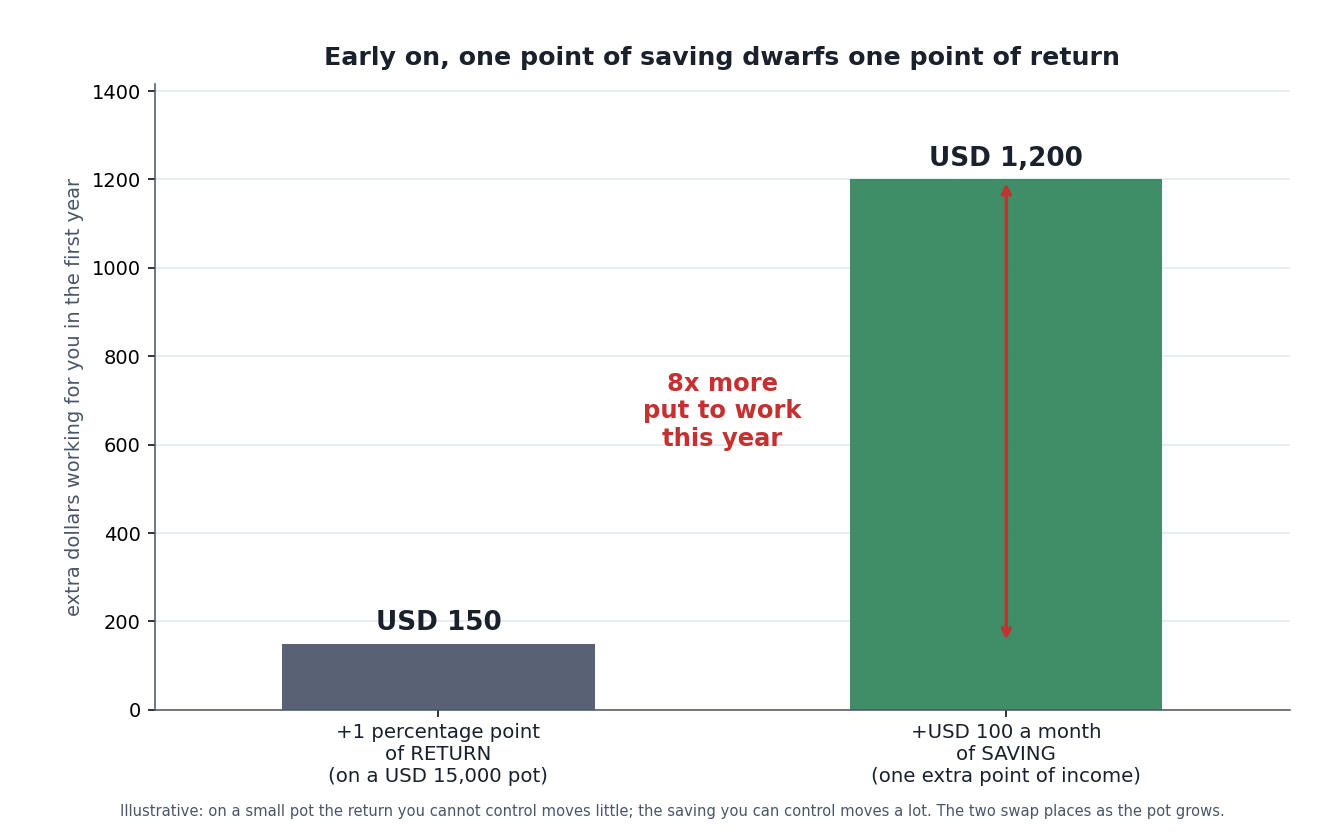 The reason the featured chart looks the way it does. When your pot is small, a point of return is applied to a small number, so it’s a small number. A point of income redirected into saving is applied to your whole income, so it’s a big number. That gap is the entire early game.
Say you’ve got 15,000 dollars invested — a realistic figure a year or two in. Earning one extra percentage point on it, say 6 percent instead of 5, is worth 150 dollars that year. Now suppose instead you find another hundred dollars a month to invest — for a lot of people, roughly one extra point of their take-home pay. That’s 1,200 dollars going to work this year. Eight times more, from a decision you can make today, versus a return improvement you mostly can’t engineer and definitely can’t count on.
That ratio isn’t a quirk of the numbers I picked. It falls out of the structure. A return is a percentage of what you already have; when what you have is small, the percentage is small. Your savings is a slice of your income, which for most people early on is much larger than their portfolio. So the two levers aren’t close, and they won’t be close until the portfolio grows large enough to rival a year’s income. That takes years.
Save More at a Worse Return, Still Win
The featured chart makes the same point the slow way, and I want to sit on it because it surprises people every time.
Two savers. Saver A puts away 600 dollars a month and earns a mediocre 5 percent. Saver B puts away half as much — 300 a month — but is a better or luckier investor and earns 9 percent. On the internet, Saver B is the hero: higher return, smarter picks, the whole aspirational package. And Saver B does eventually win. But “eventually” is doing enormous work in that sentence. Saver A, the plodding over-saver with the worse return, stays ahead for about 27 years.
Think about who’s actually inside that 27-year window. Someone who started at 25 is ahead of the higher-return version of themselves until 52. Someone who started at 35 is ahead until they’re past retirement age. For the entire stretch of life when most people are anxiously optimizing their portfolio, the person who simply saved more — even at a distinctly worse return — has more money. The return gap is real and it compounds, which is why B wins in the end; it just takes almost three decades for four percentage points of annual return to overcome a 2x difference in contributions.
I’m not telling you return doesn’t matter. It obviously does, and I’ll spend the back half of this piece on exactly when it takes over. I’m telling you that if you’re early, and you have finite attention, and you spend it agonizing over whether to hold this fund or that one while your savings rate sits untouched, you’re optimizing the small lever and ignoring the big one.
Why the Levers Trade Places
They do trade places, though. This is the honest core of the idea, and skipping it would make the whole thing a slogan.
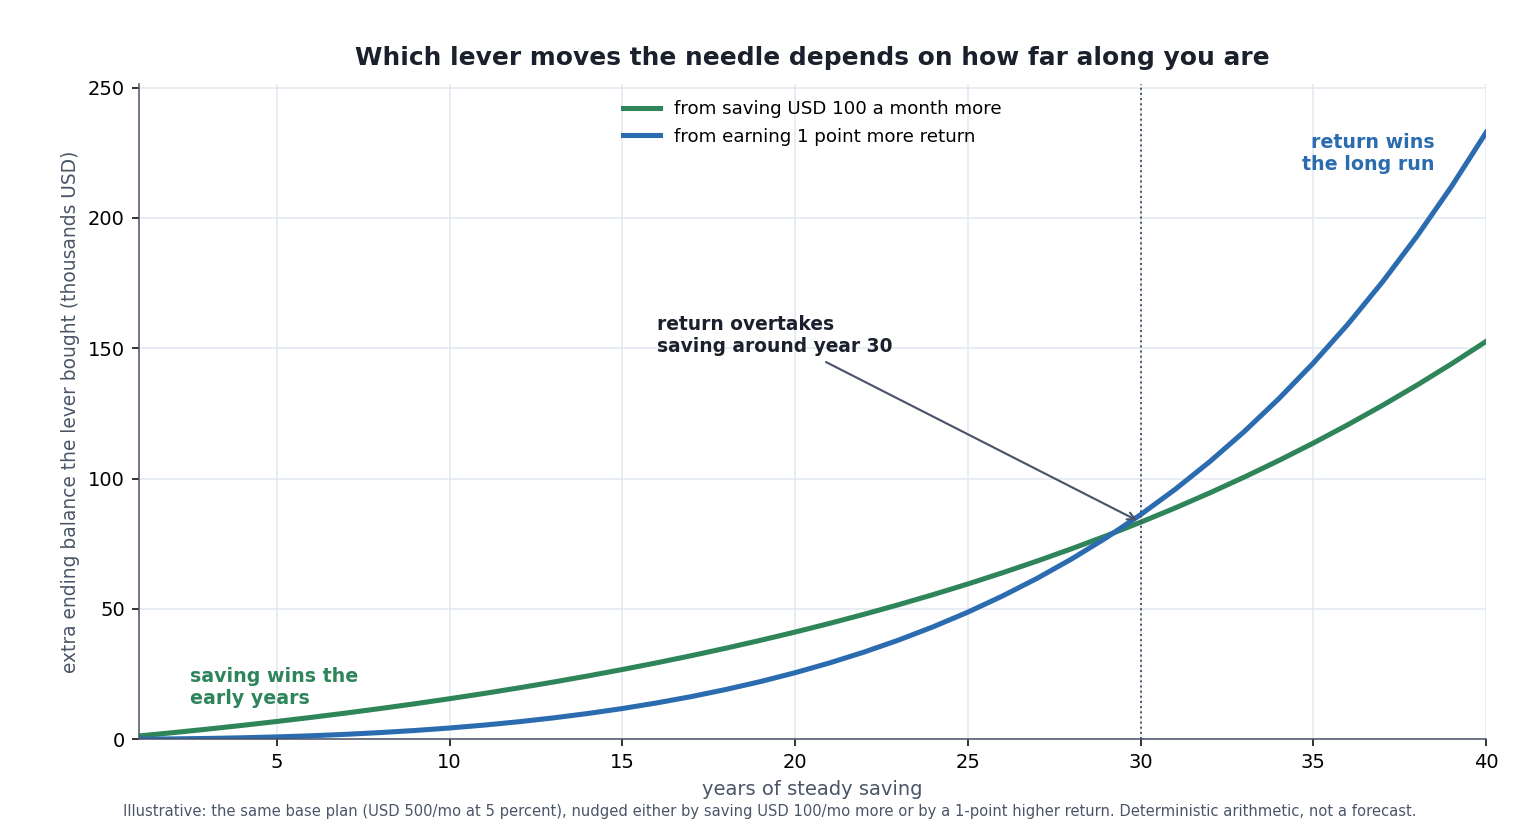 The same two concrete nudges — a hundred more a month, or one more point of return — tracked over a working lifetime. Early, the extra saving wins comfortably, because it’s a big number applied immediately. Late, the extra return wins, because it’s a percentage applied to a pile that has finally gotten big. The crossover here lands around year 30.
Take a base plan — 500 a month at 5 percent — and nudge it two ways: save a hundred more a month, or earn one point more return. For roughly the first 30 years, the extra saving buys you more ending wealth. Then the return nudge overtakes it, and after that it isn’t close, because now it’s compounding on a large balance and pulling away exponentially.
So the picture isn’t “saving good, return bad.” It’s that the two levers have different shapes over time. Saving is a big immediate deposit that then grows quietly. Return is a small early trickle that becomes a flood once the balance is large. Which one to obsess over is a question of where you are on the curve — and the honest answer for most working-age people, most of the time, is: you’re on the left side, where saving wins.
There’s a well-worn version of this observation. Charlie Munger, Warren Buffett’s late partner, used to tell people the hardest part of building wealth is the first hundred thousand dollars — “a long struggle,” he called it, precisely because at that stage your money isn’t doing much for you and almost all the progress has to come from your own contributions. That’s the left side of this chart described in one blunt sentence. The market doesn’t start carrying you until you’ve dragged the balance up to a size worth compounding, and the only tool for that drag is your savings rate.
The Part Where I Stop Selling It
Every approach has a failure mode, and treating “just save more” as the whole answer has a real one. Naming it is the difference between a useful idea and a motivational poster.
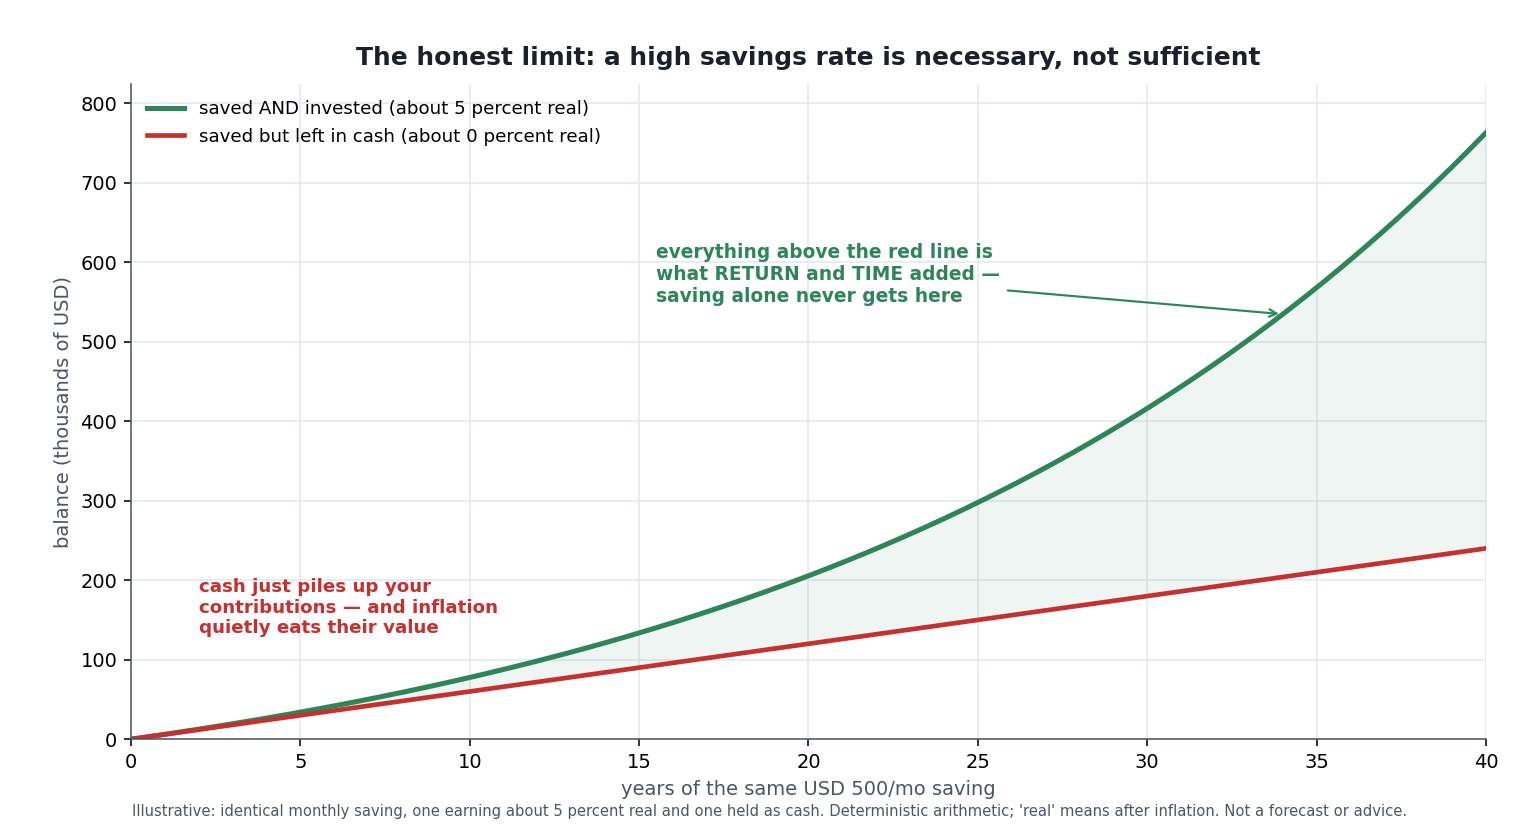 The counterweight to the whole article. A high savings rate gets you started and it’s the lever you control — but if that saved money just sits, it only ever equals what you put in, and inflation quietly drains its buying power. Everything in the shaded region is the work of return and time, and no amount of saving discipline substitutes for it.
First: saving is necessary but not sufficient. The same 500 a month, held as cash earning nothing after inflation, just piles up to equal your contributions — 240,000 over 40 years — while inflation eats the purchasing power the whole way. Invested at a modest real return, it becomes more than triple that. The shaded gap in the chart is the part saving can never produce on its own; it’s return and time. So “save aggressively” is the first half of a sentence whose second half is “and then actually invest it in something that grows.” A high savings rate parked in a checking account is a slow loss, not a plan.
Second: the savings lever has a floor you hit, and a hard wall past it. You can cut spending, but not below what your life costs, and each additional point of savings is harder-won than the last. Somebody earning very little cannot save their way to a comfortable retirement no matter how disciplined they are — the arithmetic simply doesn’t have enough income in it, and pretending otherwise turns a structural problem into a personal failing. Return isn’t a substitute for that either, but income growth eventually has to be part of the answer. The savings-rate lever is powerful and it’s yours, but it isn’t infinite.
Third: once the balance is large, the math flips, and clinging to the early-years mindset costs you. A person with a 700,000-dollar portfolio who is still pouring all their attention into trimming another 50 dollars a month from the grocery bill, while ignoring a fee that’s quietly skimming a percentage point off the whole balance, has the priorities exactly backwards. Past the crossover, a point of cost or return on the big pile dwarfs a point of income. The discipline that built the wealth becomes the wrong tool for managing it.
So the honest version is narrower than the slogan: early, and for a surprisingly long time, your savings rate is both the biggest lever and the only one you control — so that’s where the attention belongs. Later, as the balance grows, return and cost take over, and the attention should move with them. The mistake isn’t caring about return. It’s caring about it first, when it can’t yet do much, at the expense of the thing that can.
I know that mistake from the inside, because I made it for years. I started with very little money, decided a long-term plan was too slow to matter at that size, and concluded the answer was to learn to trade my way to a bigger number faster. What followed is the ordinary sequence. There is a run of early luck that you read as skill. The confidence out of it gets you sized larger than you should be. Then a loss arrives and, rather than take it, you decide it will come back — mostly because admitting otherwise means admitting the decision was wrong — and you hold until the loss is big enough that you have no choice left. Repeat that a few times and it’s the losses that compound, not the money. Had I put a fixed amount into an index fund across those same years — or, honestly, just saved it — I would be well ahead of where all that effort actually left me.
The Crossover, Sized: What Sets the Year the Levers Trade Places
This article names a crossover three separate times and gives a different year each time — about 27 in one section, around 30 in the next, year 34 in the closing caption — without ever saying what moves it. It also reports that the two levers sit eight to one apart on a $15,000 portfolio, and separately that they will not be close “until the portfolio grows large enough to rival a year’s income,” and never puts those two sentences together. All four numbers recompute. What follows is what they are made of.
The eight-to-one has a break-even, and the article walks past it
One extra point of return is worth one percent of the portfolio. One hundred more dollars a month is worth $1,200 a year and does not care how big the portfolio is. Those two are equal at one number.
| Portfolio | +1 pt of return | $100 more a month | Saving ÷ return |
|---|---|---|---|
| $15,000 | $150 | $1,200 | 8.00 |
| $30,000 | $300 | $1,200 | 4.00 |
| $60,000 | $600 | $1,200 | 2.00 |
| $100,000 | $1,000 | $1,200 | 1.20 |
| $120,000 | $1,200 | $1,200 | 1.00 |
| $240,000 | $2,400 | $1,200 | 0.50 |
The levers are level at a $120,000 portfolio, and that figure does not depend on anybody’s income — it is $1,200 divided by one percent. Two things follow. The article’s “eight times more” is not a property of $15,000; it is the ratio $120,000 ÷ $15,000, and it halves every time the portfolio doubles. And the qualitative claim about rivaling a year’s income is exactly right, as an identity rather than an approximation: save s points of income against g points of return and the two are equal precisely when the portfolio is s/g times income, so at one point against one point they are equal when the portfolio equals a year of it, at any income at all.
Which is worth holding next to the Munger line the article quotes two sections later. The hardest part being the first hundred thousand dollars is, on this article’s own arithmetic, the point at which the two levers have very nearly finished trading places: at $100,000 the extra saving still leads, but only 1.20 to 1, where on a $15,000 portfolio it led eight to one. The anecdote and the arithmetic land within twenty percent of each other, and the article never puts them side by side.
The three crossovers are one calculation at three settings
| The pairing | Return gap | Article says | Measured |
|---|---|---|---|
| $600/5% vs $300/9% | 4 pt | about 27 years | year 27.00 |
| $600/5% vs $500/6% | 1 pt | around year 30 | year 29.25 |
| $750/3% vs $500/5% | 2 pt | not until year 34 | year 33.58 |
All three hold, the closest of them exactly: the 5%-and-9% pair crosses in month 324, which is the last month of year 27 to the month. The second is a contribution ratio of 1.2 to 1 against a single point of return, the third 1.5 to 1 against two points. And the dollar amounts are decoration. Only the ratio of the contributions and the two rates enter the calculation, so 27 years is equally the answer for $600 against $300 and for $6,000 against $3,000. A reader on a smaller income than the example does not get a shorter window.
The gap does the work; the level of returns barely matters
Holding the contribution ratio at two to one — the article’s own headline pairing — and varying both the gap between the returns and the level they sit at:
| Return gap | Base 3% | Base 5% | Base 7% |
|---|---|---|---|
| 1 pt | 94.7 | 87.2 | 83.1 |
| 2 pt | 52.6 | 48.8 | 46.3 |
| 3 pt | 36.8 | 34.7 | 33.0 |
| 4 pt | 28.5 | 27.0 | 25.9 |
| 5 pt | 23.2 | 22.2 | 21.3 |
| 6 pt | 19.7 | 18.8 | 18.2 |
Read down a column and the crossover moves 4.63-fold, from 87.2 years to 18.8. Read across a row and it moves 13.9 percent, from 94.7 to 83.1, while the whole rate environment shifts by four points. The year the levers trade places is a fact about the difference between the two returns and almost nothing else — the level they sit at is nearly irrelevant, which is why the article’s three examples, spread across 3%, 5% and 9%, still line up so neatly by gap.
That reframes the article’s own headline. Twenty-seven years is what a four-point return advantage buys, and four points is a large edge to assume for the higher-return saver. Halve it to two points and the crossover goes to 48.8 years; take it to one point and it is 87.2, which is longer than an investing life. The narrower the return advantage actually available, the longer the saving lever wins — so the article’s dramatic example is, if anything, the conservative case for its own argument.
Crossover years are unforgiving of a changed input, so here is every one of them. The compounding convention is the one the site’s own Compound Growth Calculator ships: monthly deposits, the annual rate divided by twelve, no starting balance, deposit at period end. Each balance was computed in code and then again by that calculator, and the two agree to the cent; the article’s four dated balances reproduce to the cent as well, one of them ($246,226.50) sitting on a rounding boundary. A crossover is reported as the first month the trailing plan is ahead, so year 33.58 means the pass happens inside year 34. Returns are held constant, which no real return is, and nothing here is adjusted for tax, fees or inflation — the rates should be read as whatever is left after all three. The identity in the first section is arithmetic and holds for any income; the crossover years are not an identity and move with the inputs, which is the whole point of the last table.
How to Actually Use This
The practical takeaways are unglamorous, which is fitting for the whole idea.
If you’re early — portfolio smaller than a year or two of income — put your effort into the savings rate. Automate a fixed amount so the decision isn’t remade every month; raise it by a point of income whenever your pay rises, before the lifestyle absorbs it; and treat the size of the deposit, not the cleverness of what you bought, as the number that matters. The autopilot plan is built on exactly this, and automating the recurring buy is how you make the lever pull itself.
Then, so the saved money isn’t quietly wasted, get it invested in something broad and low-cost rather than left as cash — the failure mode from the chart above. And as the balance grows past the crossover, shift your attention accordingly: costs, allocation, and the behavior that protects a large pile through a bad year start to matter more than the marginal dollar of saving. That’s when the compounding you’ve been waiting for finally does the heavy lifting — the mechanics of which are their own article, the power of compounding.
The Summary
For the first decade or two of building wealth, how much you save swamps what you earn on it — one extra point of income redirected into saving does roughly eight times the work of one extra point of return on a small pot, and a saver putting away twice as much at a worse return stays ahead for nearly 27 years. That early lever is also the only one you actually control: you can raise your savings rate this month, but you can’t dial up your market return. The honest caveats are three — saved money has to be invested, not hoarded as cash that inflation erodes; the savings lever has a floor and can’t rescue too-low an income on its own; and once the balance is large the math flips, so return and cost, not the marginal dollar saved, become what deserves your attention. But almost everyone reading this is on the left side of that crossover, where the boring lever is the powerful one — and it’s the one with your hand already on it.
Keep Going
- The Power of Compounding Explained: Why Time Beats Timing — what happens on the right side of the crossover, once the balance is big enough for return to carry you.
- How to Start Investing With $10 a Day: The Autopilot Plan — the plan built entirely on making the savings lever pull itself.
- How to Automate Your Investing: Recurring Buys on Every Major Brokerage — the actual settings screen that turns “save more” into a standing instruction.
- What Is Inflation, Really? — why the cash version of saving quietly loses, and what “real” return means.
- Dollar-Cost Averaging: The Evidence, the Math, and the Limits — the behavioral half of steady, unglamorous investing.
If you want the plain-English, evidence-first read on building wealth — including the boring levers most guides skip past on the way to stock picks — that’s what the newsletter is for. Subscribe below.
The crossover, dated: saver A puts away $500 a month and earns 5%. Saver B saves $750 and earns only 3%. At ten years B is ahead, $104,806 to $77,641. At twenty years B is still ahead, $246,226 to $205,517. A does not pass B until year 34. For almost the whole of a working life the contribution is the bigger lever, and the return only takes over near the end — which is the argument of this article, with a date on it. The Compound Growth Calculator lets you find your own crossover year.
Disclaimer: This article is educational content, not financial advice. I am not a licensed financial advisor, and nothing here is a recommendation to buy or sell any security or asset. Investing and trading involve risk, including the possible loss of the money you invest. Do your own research and consider consulting a licensed financial professional before making investment decisions. Read the full Disclaimer.
Historical and backtested results are hypothetical, carry inherent limitations, and do not guarantee future results. Figures were accurate to the best of my knowledge as of this article’s last-updated date and may have changed.
