The Fed’s Dot Plot vs. Reality: 44 Rate Projections Checked Against What Happened
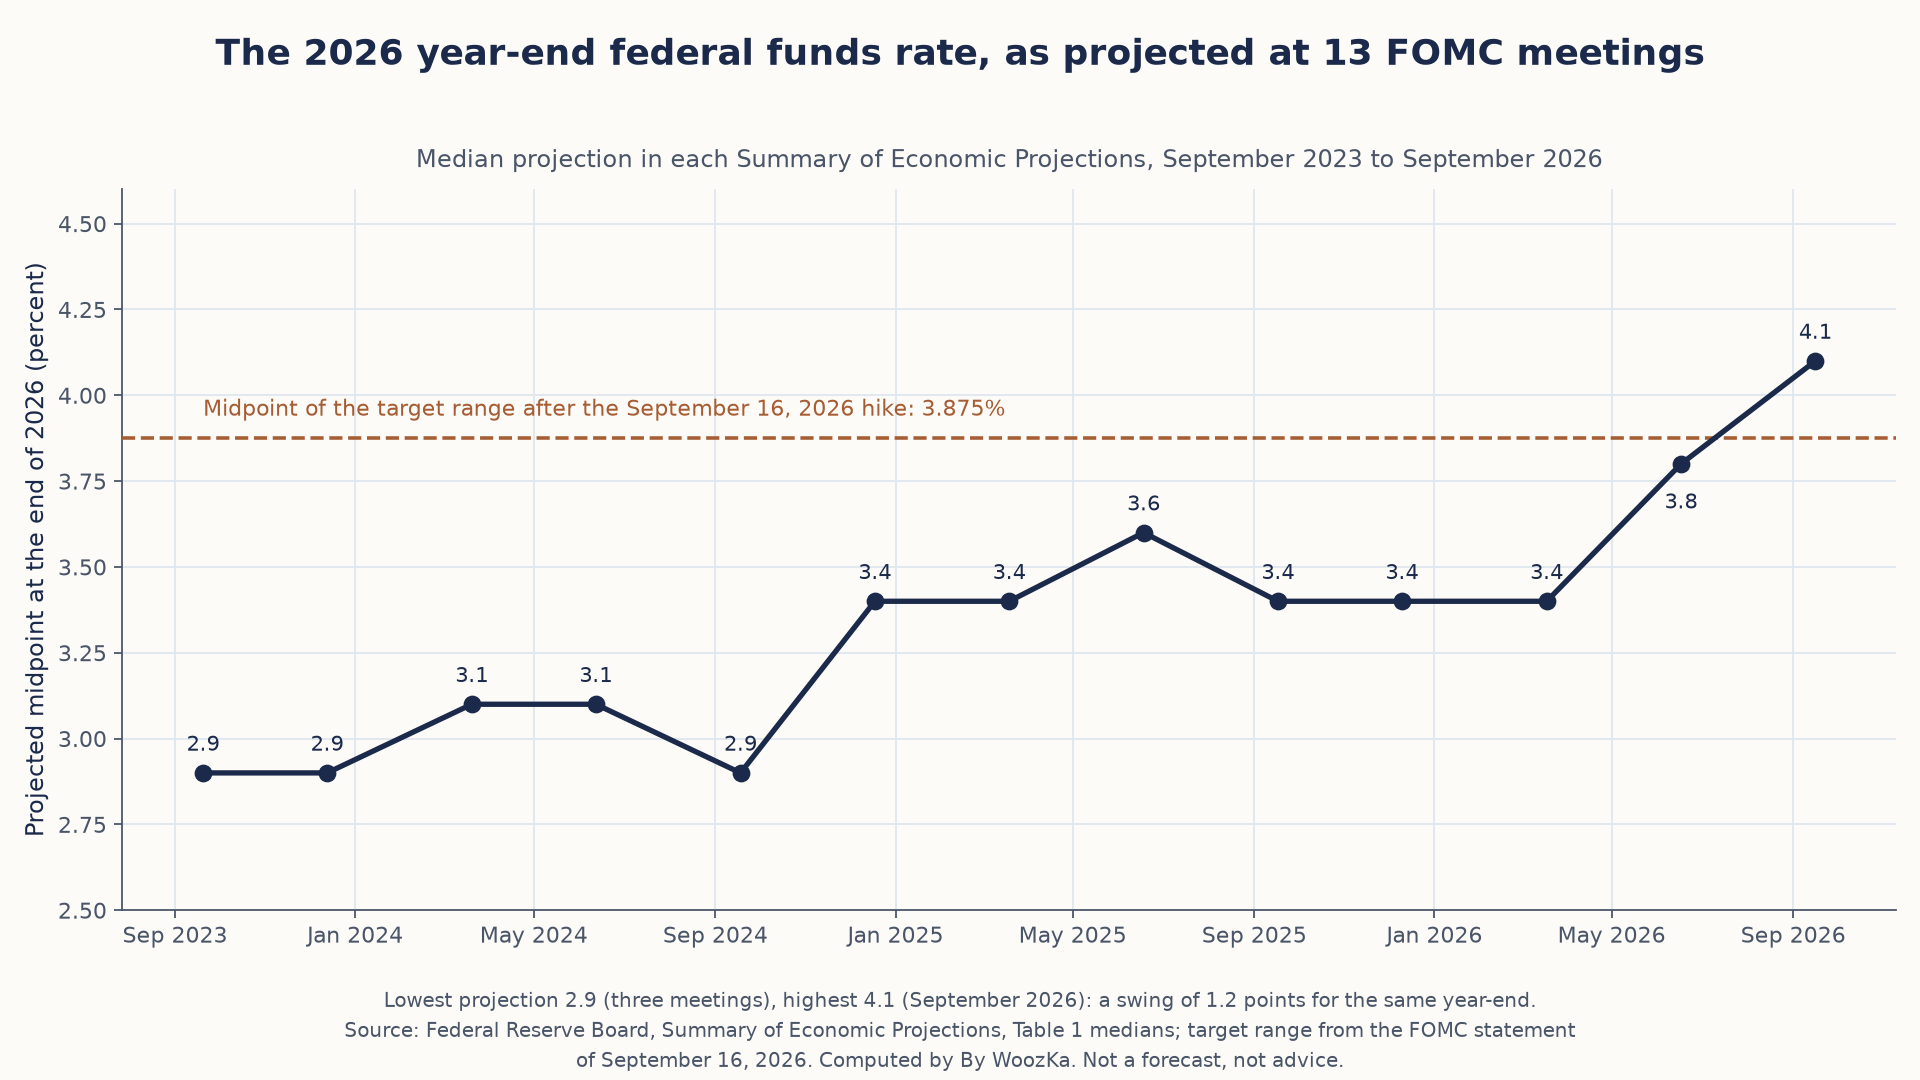
One year-end, thirteen answers. Three years ago the committee’s median put the end of 2026 at 2.9%. This week it put it at 4.1%, after raising the target range to 3.75% to 4.00%.
On September 16, 2026, the Federal Open Market Committee voted 12 to 0 to raise the federal funds target range by a quarter point, to 3.75% to 4.00%. Its statement gave the reason in three words: “Inflation remains elevated” [source: Federal Reserve Board, FOMC statement, September 16, 2026].
Twenty-one months earlier, the same committee’s median projection for the end of 2026 was 3.4%. Three years earlier it was 2.9%. Neither was a promise, and the Fed never said it was. But the dot plot is the most quoted chart in rate markets, and it has a public track record. This article scores that record: every median federal funds projection the Fed has published since September 2015, checked against where the rate actually ended the year.
What the Dot Plot Is, and What It Is Not
Four times a year, at the March, June, September and December meetings, each Board governor and each Reserve Bank president submits projections for growth, unemployment, inflation and the federal funds rate [source: Federal Reserve Board, FAQs on the Summary of Economic Projections]. The rate projections have been part of the package since January 2012. The chart of them, one dot per participant, is the dot plot.
- Each dot is one person’s view of appropriate policy. It is the rate that participant judges most consistent with the Fed’s mandate, conditioned on their own forecast. It is not a vote and not a commitment.
- The number is a year-end midpoint. The Fed’s tables state that each projection is the midpoint of the appropriate target range at the end of the calendar year [source: Federal Reserve Board, FOMC Projections materials, September 16, 2026]. A 3.75% to 4.00% range has a midpoint of 3.875%.
- The horizon is short. March and June projections cover the current year and the next two; September and December add a third year.
- The median is what gets quoted. The Fed’s summary table has printed a median since September 2015. Earlier tables did not. Every table also shows the full range and a “central tendency,” which drops the three highest and three lowest projections.
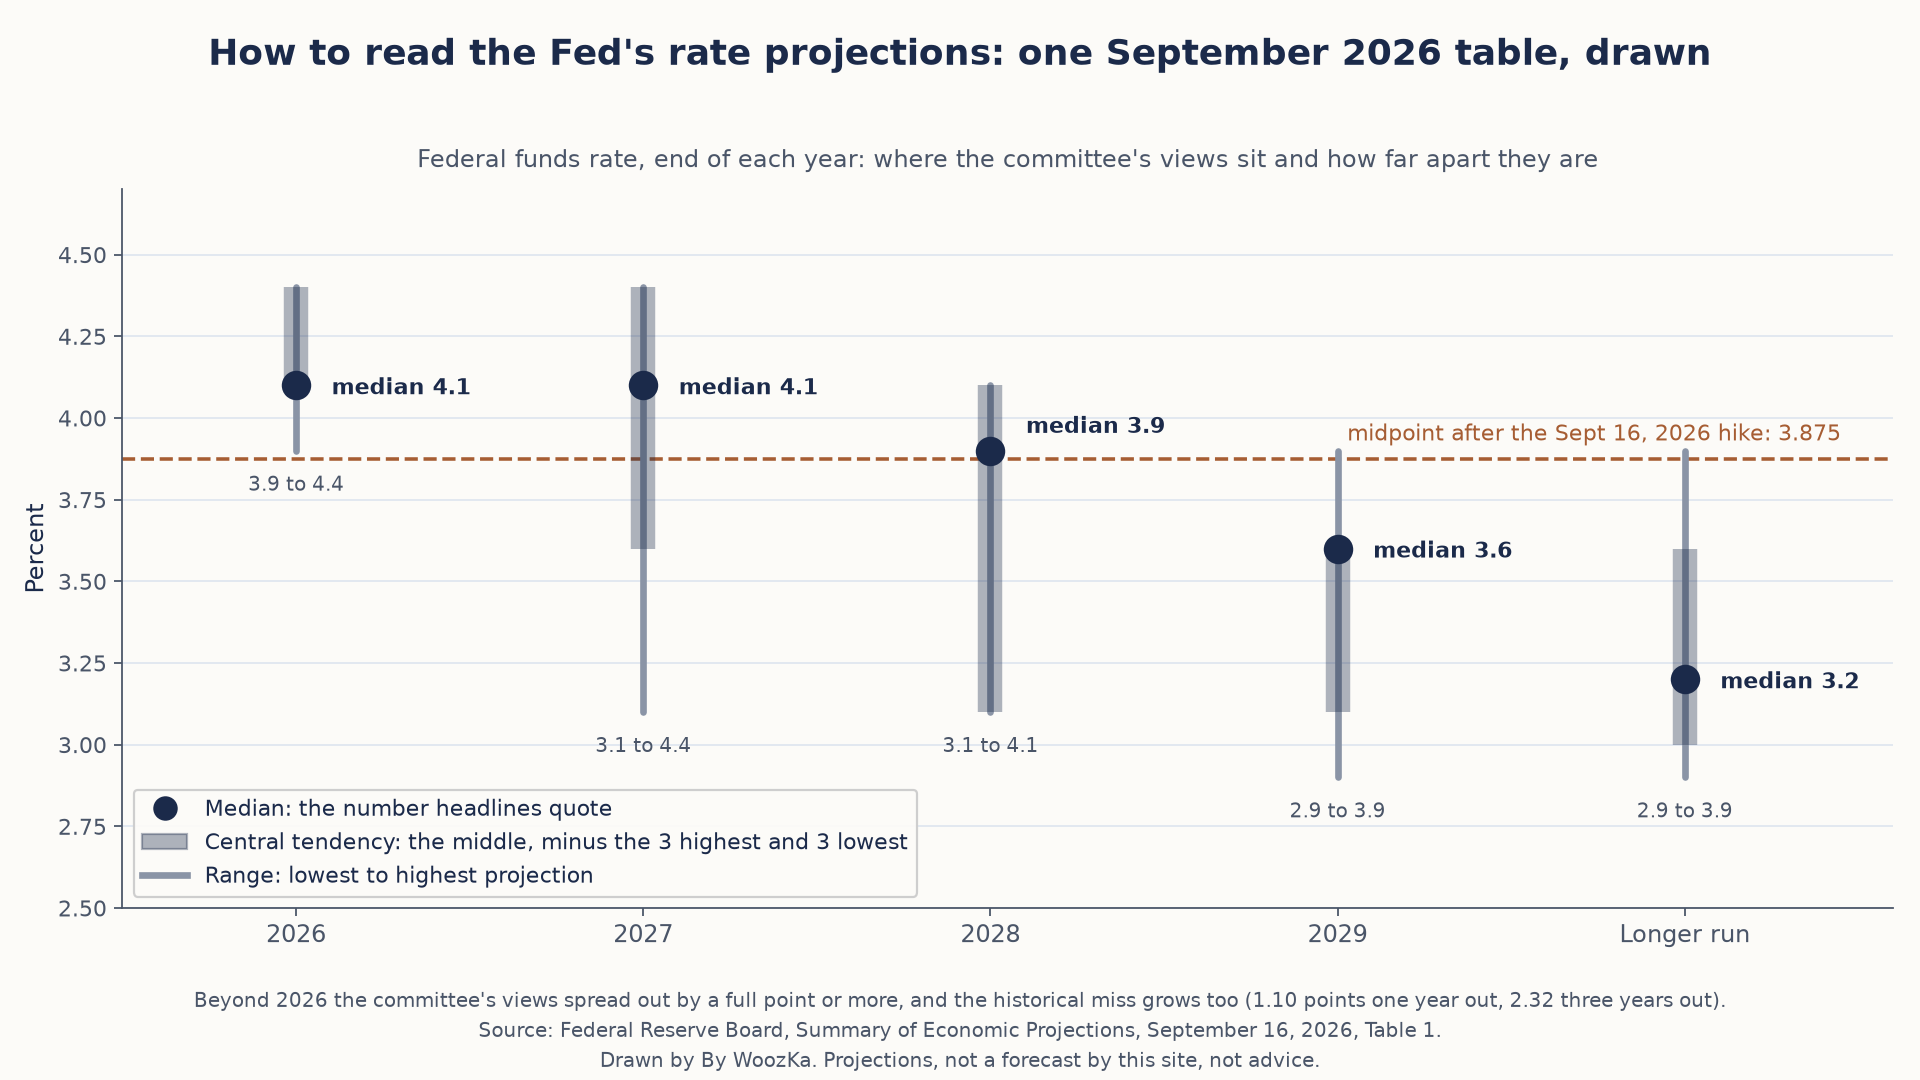
One table, drawn. The dot is the number the headlines quote; the bars show how much the committee disagrees behind it. This week the whole 2026 range sits at or above the rate the Fed just set.
That last point sets the sample. From September 2015 through this week there are 44 projection tables with a published median, and 127 projections whose target year has already ended.
The Test: Every Median Since 2015, Scored Against the Actual Rate
The scoring is deliberately plain.
- The actual value for a year is the midpoint of the target range in force on December 31, taken from the Fed’s own rate history [source: Federal Reserve Board, Open Market Operations]. That is the same quantity the projection describes.
- The miss is actual minus projected. A positive miss means the Fed ended the year higher than it had projected.
- The horizon is how far ahead the projection looked: zero for the same year, one for next year, and so on.
- The rounding is the Fed’s. Medians are printed to one decimal, so 0.375 appears as 0.4, and every miss carries up to 0.05 points of rounding. No conclusion below depends on a gap that small.
Next Year, Ten Times: The December Projections
The cleanest single test is the one most people actually use: in December, what does the committee expect for the end of next year?
| Year | Projected (Dec before) | Actual midpoint | Miss (pts) |
|---|---|---|---|
| 2016 | 1.4 | 0.625 | −0.8 |
| 2017 | 1.4 | 1.375 | 0.0 |
| 2018 | 2.1 | 2.375 | +0.3 |
| 2019 | 2.9 | 1.625 | −1.3 |
| 2020 | 1.6 | 0.125 | −1.5 |
| 2021 | 0.1 | 0.125 | 0.0 |
| 2022 | 0.9 | 4.375 | +3.5 |
| 2023 | 5.1 | 5.375 | +0.3 |
| 2024 | 4.6 | 4.375 | −0.2 |
| 2025 | 3.9 | 3.625 | −0.3 |
Two things are true at once.
- The direction was usually right. In 8 of the 10 years, the December median pointed the right way: hike, hold or cut. The two wrong calls were 2019, when the median expected more hikes and the Fed cut three times, and 2020, when it expected a hold and the pandemic brought the range to zero.
- The size was often wrong. The average miss was 0.81 points, more than three quarter-point moves. The one that mattered most was 2022: in December 2021 the median saw 0.9% for the end of 2022, and the year ended at 4.375%, a miss of 3.5 points.
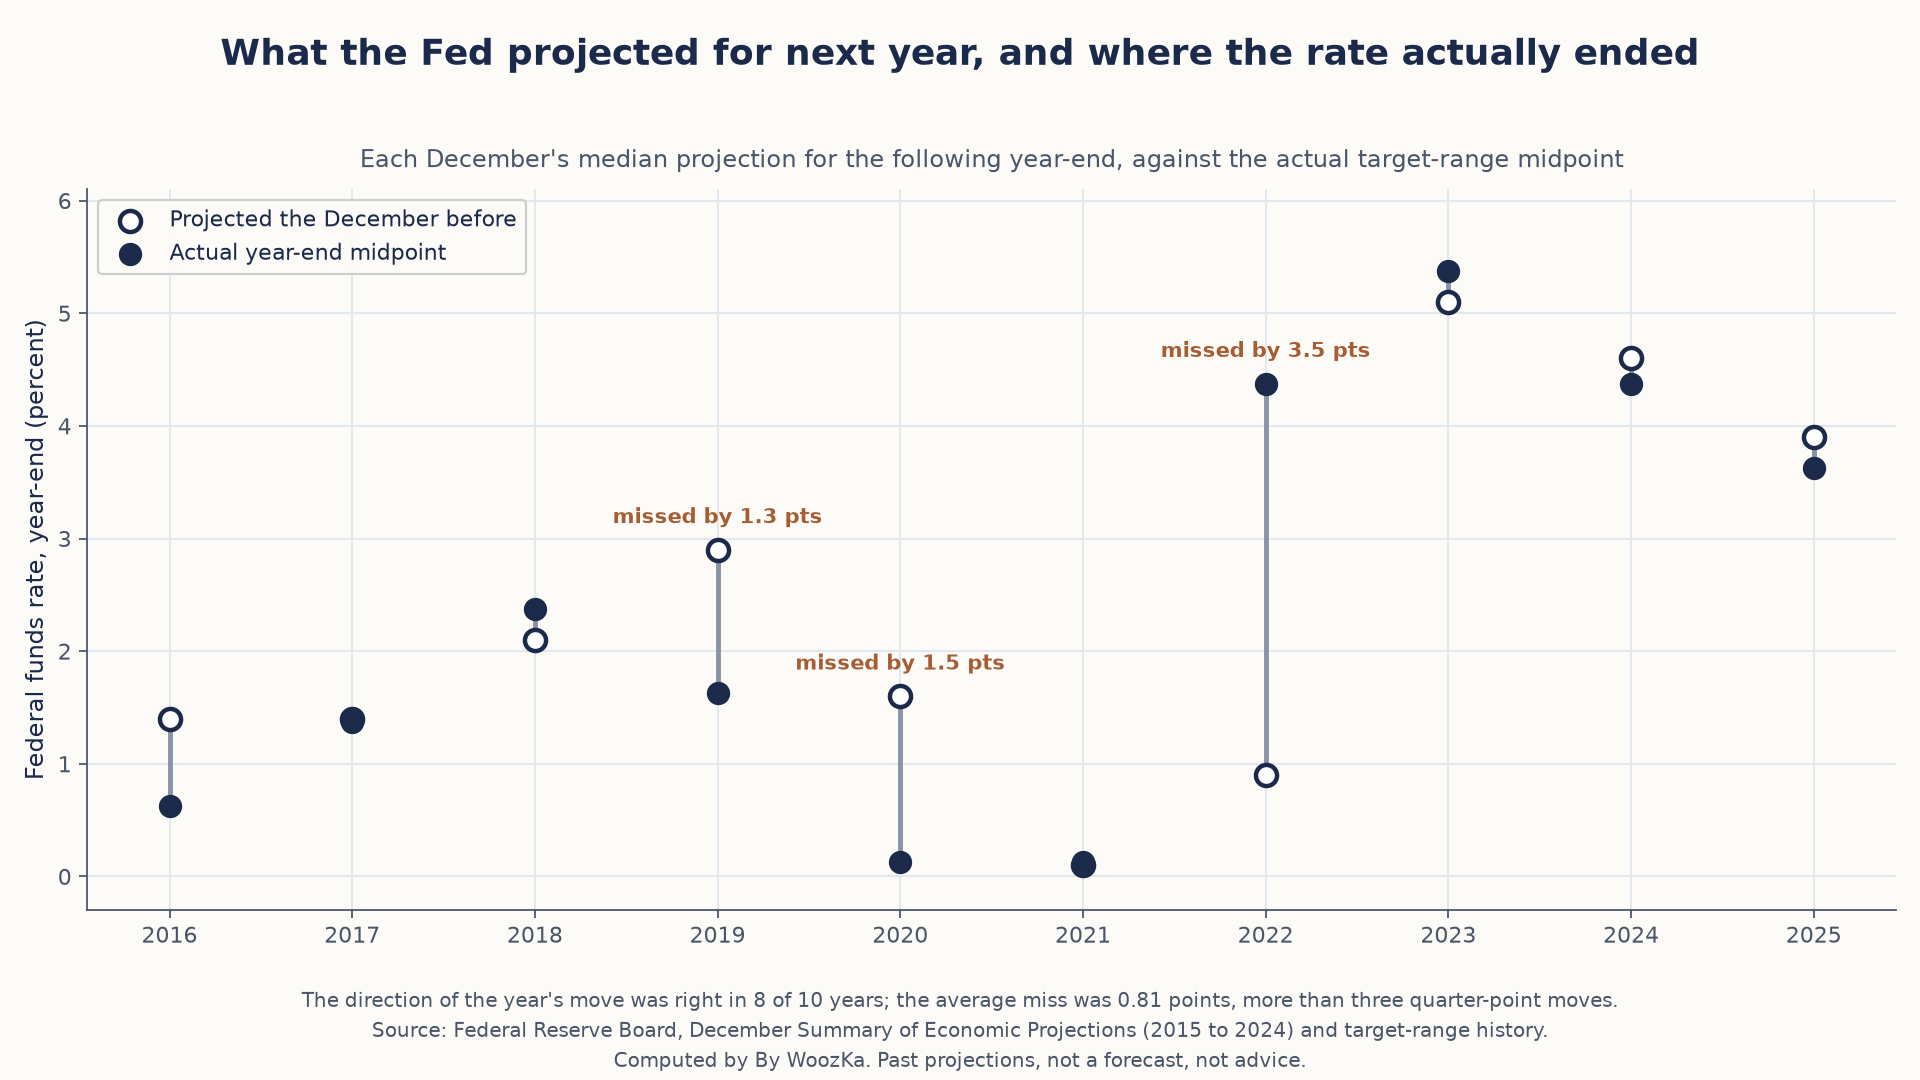
Mostly the right direction, often the wrong distance. The three long gray lines are the years the economy changed faster than the committee’s median did.
The Further Out It Looks, the Wider It Misses
Scoring all 127 projections, grouped by how far ahead each one looked:
| Horizon | Projections | Average miss (pts) | Average signed miss | Too high | Too low | Largest miss |
|---|---|---|---|---|---|---|
| Same year | 41 | 0.22 | −0.01 | 11 | 4 | +2.48 |
| Next year | 37 | 1.10 | +0.14 | 18 | 14 | +4.28 |
| Two years out | 33 | 1.97 | +0.20 | 16 | 15 | +5.28 |
| Three years out | 16 | 2.32 | +0.29 | 8 | 8 | +5.28 |
“Too high” and “too low” count misses larger than an eighth of a point in each direction.
- The error grows fast with distance. A same-year projection misses by about a fifth of a point on average. A three-year projection misses by 10.6 times as much.
- One year out, the typical miss is about four quarter-point moves. That is the horizon most headlines quote.
- There is no reliable lean. The signed averages sit close to zero, and the “too high” and “too low” counts are nearly even beyond the current year. The misses run in both directions, so there is no fixed correction a reader could apply to the median.
- Even the same year can miss badly. In March 2022 the median saw 1.9% for the end of that year. The year ended at 4.375%, a miss of 2.48 points inside nine months.
The Largest Misses Were All Pointing the Same Way
The five largest misses in the whole sample are about one year:
- In September 2020, December 2020 and March 2021, the median projection for the end of 2023 was 0.1%. The rate ended 2023 at a 5.375% midpoint, a miss of 5.28 points each time.
- In June 2021 the median for 2023 had moved only to 0.6%, and in September 2021 to 1.0%.
Those projections were not careless. In the same three tables, the median projection for 2023 PCE inflation was 2.0% to 2.1%, essentially the Fed’s 2% goal. The inflation that arrived instead led the committee to raise the range 11 times between March 2022 and July 2023, by 5.25 points in total. For that part of the story, see What Is Inflation, Really? and the 2022 case study in Why Interest Rates Move Markets. The lesson for reading the chart is narrower: a dot plot built in one regime says little about the next one.
One Year, Projected 13 Times: The 2026 Path
The chart at the top follows a single target: the end of 2026. The Fed began projecting it in September 2023.
| Meeting | Median for end of 2026 |
|---|---|
| Sep 2023 | 2.9 |
| Dec 2023 | 2.9 |
| Mar 2024 | 3.1 |
| Jun 2024 | 3.1 |
| Sep 2024 | 2.9 |
| Dec 2024 | 3.4 |
| Mar 2025 | 3.4 |
| Jun 2025 | 3.6 |
| Sep 2025 | 3.4 |
| Dec 2025 | 3.4 |
| Mar 2026 | 3.4 |
| Jun 2026 | 3.8 |
| Sep 2026 | 4.1 |
- The swing is 1.2 points, from 2.9 at three meetings to 4.1 this week, for the same calendar date.
- The median has now moved above the rate. After this week’s hike the midpoint is 3.875%, and the September median for the end of 2026 is 4.1%. On the committee’s own numbers, the typical participant expects policy to be tighter by December than it is today.
- That is still a projection with this track record. With about three months left, the relevant row in the scorecard is “same year,” where the average miss has been 0.22 points and the largest 2.48.
The September table also carries medians of 4.1% for 2027, 3.9% for 2028, 3.6% for 2029 and 3.2% for the longer run. Those sit at horizons where, historically, the average miss has run between 1.1 and 2.3 points.
How to Read the Next Dot Plot
None of this makes the dot plot useless. It makes it a specific kind of information.
- Read it as the committee’s current reasoning, not as a forecast of the rate. It tells you what policymakers think is appropriate given what they know today, which is exactly what the Fed says it is.
- Weight the direction more than the level. The next-year median got the direction right in 8 of 10 years, and missed the size by 0.81 points on average.
- Discount the far years hard. Beyond the current year the average miss has been more than a full point, and it widens with every year added.
- Watch the changes between meetings. The 2026 median moved at seven of its twelve steps. A median that moves is the committee updating in public, and that is often more informative than the level it lands on.
- Remember what breaks it. The biggest misses came from shocks the committee had not priced in, a pandemic and an inflation surge. The median cannot see those in advance, and nothing else can either.
Method and limits, so this can be checked rather than taken on trust. Every figure was computed in code that reads the Federal Reserve Board’s own pages: the “Federal funds rate” median row of Table 1 in each of the 44 projection tables from September 2015 to September 2026, and the target-range history on the Board’s Open Market Operations page. Each result is checked before it is reported. The actual value for a year is the midpoint of the range in force on December 31, which is the quantity the projections describe. Medians before September 2015 are not published in the table, so they are excluded rather than reconstructed from the dot charts, and there was no projection table in March 2020. Medians are printed to one decimal, which adds up to 0.05 points of rounding to each miss. This is a record of past projections. It is not a forecast of any future rate and not a recommendation.
The Takeaway
- The Fed raised its target range to 3.75% to 4.00% on September 16, 2026, and its median now sees 4.1% for the end of the year.
- Across 127 scored projections since 2015, the average miss was 0.22 points in the same year, 1.10 one year out and 2.32 three years out.
- The December median for the following year got the direction right 8 times in 10 and missed the level by 0.81 points on average.
- The worst misses came together: three meetings in 2020 and 2021 put the end of 2023 at 0.1%, and it ended at 5.375%.
- The dot plot is best read as the committee’s current reasoning, and least reliable exactly where people lean on it most: a year or more out.
Where to Go Next
- Why Interest Rates Move Markets: A Beginner’s Guide to the Fed: what the Fed controls, and how one rate reaches your portfolio.
- Quantitative Easing and Tightening Explained: the Fed’s other lever, its balance sheet, measured round by round.
- The Yield Curve Inversion, Explained Without the Jargon: what the bond market was saying while these projections were being made.
- What Is Inflation, Really? A Plain-English Breakdown: the variable behind the largest misses above.
Disclaimer: This article is educational content, not financial advice. I am not a licensed financial advisor, and nothing here is a recommendation to buy or sell any security or asset. Investing and trading involve risk, including the possible loss of the money you invest. Do your own research and consider consulting a licensed financial professional before making investment decisions. Read the full Disclaimer.
Historical and backtested results are hypothetical, carry inherent limitations, and do not guarantee future results. Figures were accurate to the best of my knowledge as of this article’s last-updated date and may have changed.
