What Is Inflation, Really? A Plain-English Breakdown
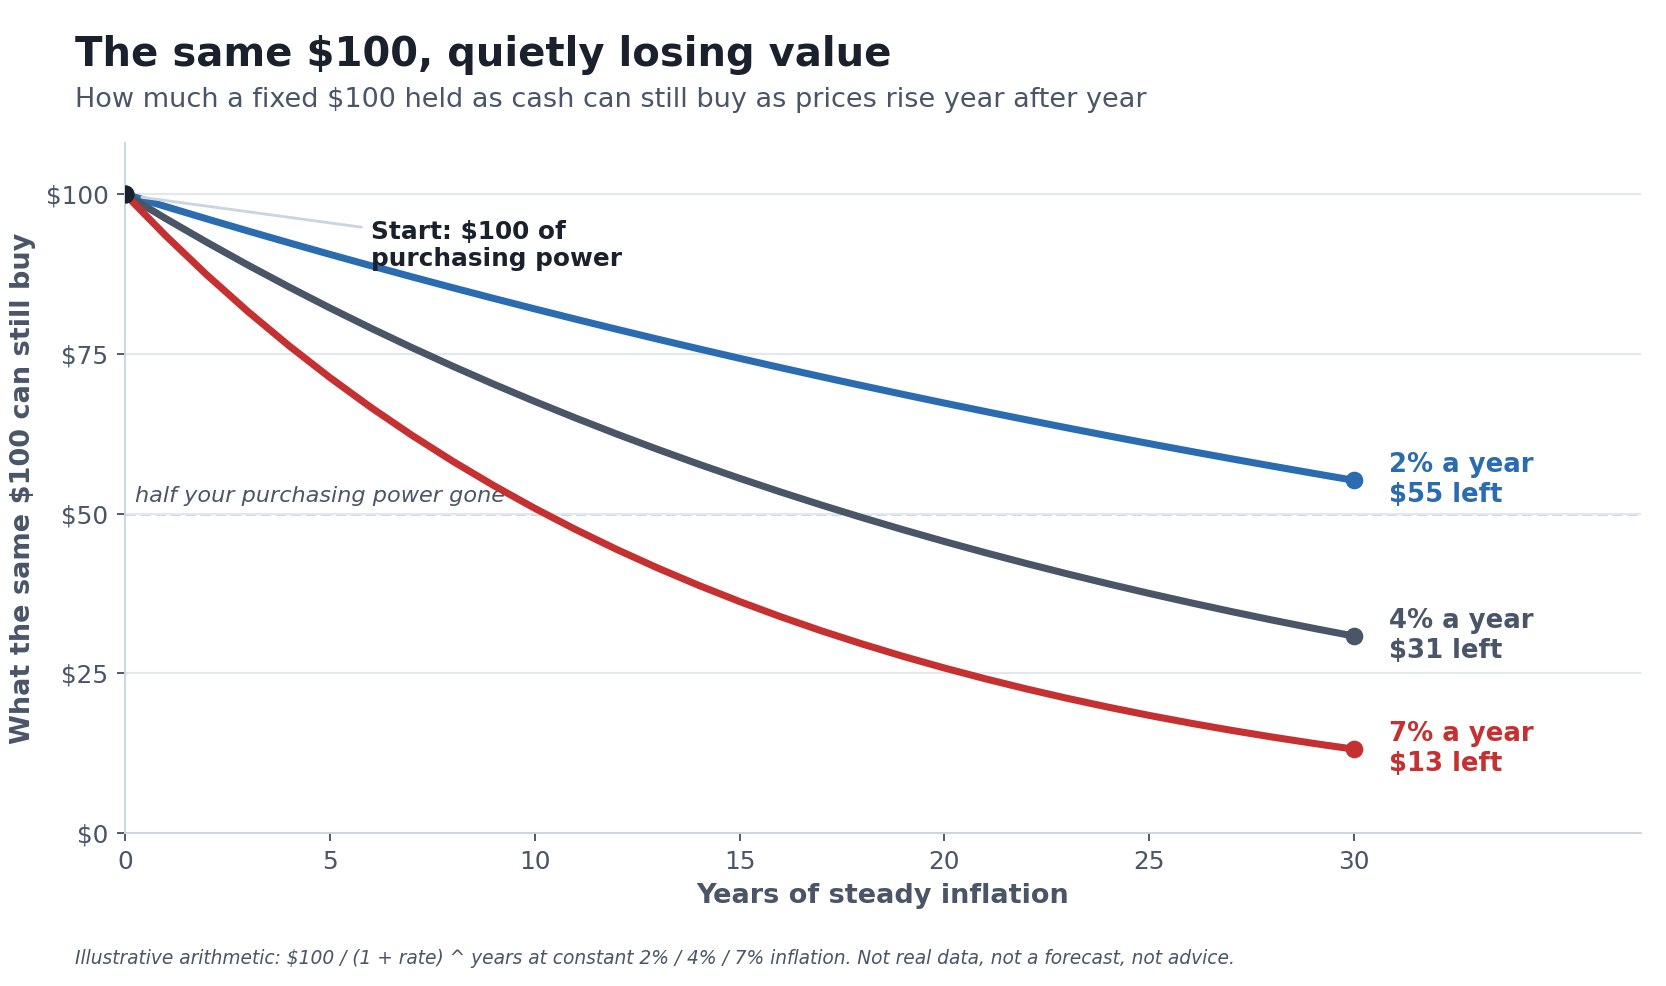 The same $100, year after year. The number of dollars never changes — what those dollars can buy does. This is an illustrative calculation using round inflation rates to make the mechanism concrete; it is not real data, not a forecast, and not investment advice.
Ask ten people what inflation is and most will say some version of “everything’s expensive right now.” That’s a symptom, not a definition — and the gap between the two is exactly what trips beginners up. Inflation isn’t a single high price or a rough month at the grocery store; it’s a sustained, broad rise in the overall level of prices over time, and its mirror image is the slow decline in what each of your dollars can buy. This article explains what inflation really is, how it’s measured, where it comes from, and why it matters to your money — in plain English, and without pretending anyone can tell you what the next inflation report will say.
The one-sentence version: inflation is the rate at which money loses purchasing power, and understanding it is less about predicting prices than about seeing why a fixed pile of cash quietly shrinks in value even when the number on it never changes. If you want the larger system this idea sits inside, this is a companion to the section’s foundation, The Economic Machine Explained.
What Inflation Actually Is (and Isn’t)
Economists define inflation as a general and sustained increase in the prices of goods and services across an economy [source: standard macroeconomics; U.S. Bureau of Labor Statistics, “Consumer Price Index Frequently Asked Questions”]. Two words in that sentence do a lot of work.
“General” means broad. If the price of one thing jumps — eggs during a bird-flu outbreak, gasoline during a supply disruption — that’s a relative price change, not inflation. Inflation is when prices are rising across the whole basket of what a typical household buys, so the change shows up in food, housing, transportation, medical care, and more at the same time.
“Sustained” means ongoing, not a one-time step. A single tax that raises prices once and then stops isn’t inflation in the meaningful sense; inflation is a continuing process, measured as a rate — usually the percentage change in prices over the past twelve months.
The most useful way to hold the concept in your head is to flip it around. Every time prices rise, the purchasing power of money falls. If a basket of groceries that cost $100 last year costs $103 this year, then $100 no longer buys that basket — your dollar bought less than it did a year ago. That is the whole idea, and the featured chart above makes the long-run consequence visible: a fixed amount of cash buys steadily less as the years pass, even though you never lost a single dollar of it.
It’s also worth naming inflation’s relatives, because the words get mixed up constantly. Disinflation is when inflation is still positive but slowing (prices rising 3% instead of 6% — still going up, just less quickly). Deflation is the opposite of inflation: prices actually falling, which sounds pleasant but brings its own serious problems, covered below. And hyperinflation is inflation gone catastrophic — prices spiraling so fast that money becomes nearly worthless in weeks or days.
How Inflation Is Measured
You can’t manage what you can’t measure, so a lot of the “what is inflation, really” question comes down to how we count it — and the honest answer is that measurement involves genuine choices, not a single physical constant.
The Consumer Price Index (CPI). The best-known gauge in the U.S. is the CPI, published monthly by the Bureau of Labor Statistics. The CPI tracks the average change over time in the prices paid by urban consumers for a “market basket” of goods and services, built from detailed surveys of what families actually buy and sorted into more than 200 categories across eight major groups — food and beverages, housing, apparel, transportation, medical care, recreation, education and communication, and other goods and services [source: U.S. Bureau of Labor Statistics, “Consumer Price Index Frequently Asked Questions”; CPI overview]. Housing is the heavyweight: the shelter component, much of it captured through owners’ equivalent rent (an estimate of what a homeowner would pay to rent their own home), is one of the largest single pieces of the basket [source: BLS, “Measuring Price Change in the CPI: Rent and Rental Equivalence”].
The PCE price index — and the Fed’s 2% target. The Federal Reserve actually prefers a different measure: the Personal Consumption Expenditures (PCE) price index, produced by the Bureau of Economic Analysis. When the Fed says it aims for 2% inflation over the longer run, that target is defined on PCE, not CPI [source: Federal Reserve, monetary-policy goals; U.S. Bureau of Economic Analysis, PCE price index]. PCE and CPI usually tell a similar story but differ in their weights and methods, so their numbers don’t match exactly — one reason you’ll see slightly different “inflation rates” quoted depending on the source.
Headline vs. core. You’ll also hear about “core” inflation, which strips out food and energy prices. That isn’t because food and gas don’t matter — they obviously do — but because their prices swing so sharply month to month that they can obscure the underlying trend. Economists watch core inflation to gauge where prices are heading once the noisiest components are set aside [source: BLS CPI; standard central-banking practice].
Where do things stand as of this writing? As of the most recent report available (the May 2026 CPI, released in June; the June figure is due July 14, 2026), all-items CPI was up 4.2% over the prior twelve months, with core CPI (excluding food and energy) up 2.9% [source: U.S. Bureau of Labor Statistics, Consumer Price Index, May 2026]. Core PCE — the Fed’s preferred gauge — was running about 3.4% for the twelve months ended May 2026 and had been above the Fed’s 2% target every month since March 2021 [source: U.S. Bureau of Economic Analysis / Federal Reserve, PCE inflation]. (Inflation readings change with every monthly release — always confirm the current figures at bls.gov or federalreserve.gov before relying on them; the concepts in this article are what last, not the specific numbers.)
One last point that gets at the “really” in the title: how inflation is measured is itself a set of methodological choices. The standard CPI prices a mostly fixed basket, which can overstate inflation because it doesn’t fully capture how people substitute toward cheaper alternatives when something gets pricey — which is why the BLS also publishes a “Chained CPI” that adjusts for that substitution [source: Brookings Institution, “How does the government measure inflation?”; BLS]. And statistical agencies periodically revise their methods: in 2026 the BEA announced changes to how it calculates prices in a few PCE subcategories, which analysts expect to modestly lower measured core PCE going forward [source: U.S. Bureau of Economic Analysis, PCE methodology update, 2026]. None of this means the numbers are fake — it means “the inflation rate” is a carefully constructed estimate, and reasonable methods can land a few tenths of a percent apart.
Where Inflation Comes From
At the simplest level, prices rise when the demand for goods and services outruns the economy’s ability to supply them, or when the cost of supplying them goes up. Economists usually group the causes into a few buckets — and the honest framing is that real-world inflation is almost always a mix, with the weights hard to pin down even after the fact.
Demand-pull inflation happens when total spending grows faster than the economy can produce — “too much money chasing too few goods.” When households and businesses collectively want to buy more than is available, sellers raise prices.
Cost-push inflation comes from the supply side: when the cost of producing things rises — an oil shock that raises energy and shipping costs, a disrupted supply chain, a jump in wages — those costs get passed through into higher prices even if demand hasn’t changed.
The monetary and expectations dimension. Over long horizons, sustained inflation is closely tied to the growth of the money supply relative to the economy’s output — the old idea that persistent inflation is, in part, a monetary phenomenon. Just as important, expectations can be self-fulfilling: if workers and businesses come to expect 5% inflation, they build 5% into wage demands and price increases, which helps produce 5% inflation. This is a big reason central banks care so much about keeping expectations “anchored.”
The 2021–2022 episode is a useful, honest illustration of how tangled the causes usually are. That burst of inflation is generally attributed to a combination — snarled global supply chains coming out of the pandemic, a spike in energy prices, and strong demand supported by pandemic-era fiscal and monetary stimulus — and economists still debate the relative weight of each factor [source: general economic reporting and research on the 2021–2022 inflation; treated as contested, not settled]. That debate is the point: anyone who tells you they know exactly which lever caused a given inflation is overselling. To see how these forces fit into the broader machine of credit and cycles, the pillar for this section walks through the whole system: The Economic Machine Explained.
Which Money Supply? The Aggregates, and the One That Does Not Exist
The section above says sustained inflation is closely tied to the growth of the money supply relative to output. That sentence carries a lot of weight on an undefined noun: there is no single “the money supply.” The Federal Reserve publishes several measures, they are different sizes, and one of the terms people reach for most often is not a Federal Reserve series at all. Before the sentence can be checked against anything, it helps to know what is actually being counted.
| Measure | July 2026 | Status |
|---|---|---|
| Monetary base | $5,523.9B | Published |
| M1 | $19,886.4B | Published |
| M2 | $23,218.0B | Published |
| M0 | no such series | Not a Fed measure |
| M3 | last published 2006 | Discontinued |
The monetary base is currency in circulation plus the reserve balances banks hold at the Fed. M1 adds the deposits you can spend immediately; M2 adds small time deposits and retail money market funds. “M0” is not a Federal Reserve aggregate — it is a Bank of England term for narrow money, and the Bank of England itself retired it. When an American chart is labeled “M0,” what it almost always means is the monetary base, reconstructed by whoever drew it. M3 was genuinely published once and was discontinued on March 23, 2006 [source: Federal Reserve H.6, Money Stock Measures, released August 25, 2026; Federal Reserve M3 discontinuance notice, 2006]. So of the four aggregates people commonly name, the Fed publishes two.
The Largest Jump in M1’s History Created No Money
There is a specific reason to be careful with money-supply charts around 2020, and it has nothing to do with inflation. It is a definitional change.
| Measure | May 2020 | Why |
|---|---|---|
| M1 | + about $11.2 trillion | Savings deposits moved in |
| M2 | no change at all | They were already inside it |
On April 24, 2020 the Board deleted Regulation D’s six-per-month transfer limit on savings deposits, which removed the regulatory distinction that had kept them out of M1. Savings deposits were then folded into M1 through a new “other liquid deposits” line, retroactive to the May 2020 observation. The Fed’s own technical notes put the size of it plainly: M1 “will increase by the size of the industry total of savings deposits, which amounted to approximately $11.2 trillion” [source: Federal Reserve H.6 Technical Q&As, on the May 2020 revisions and the April 24, 2020 Regulation D interim final rule]. Because those deposits were already counted inside M2, M2 did not move. Not one dollar was created. The money was reclassified from one compartment of the same box into another.
The practical consequence for anyone reading a chart: any M1 series spanning 2020 is discontinuous, and the step is definitional rather than economic. A chart of that break, presented as evidence of money printing, is showing an accounting decision. M2 is the series that stayed on consistent footing across it. None of this settles whether money growth drives inflation — that argument is above, and it is genuinely contested — but it does mean the most dramatic-looking exhibit in the debate is not evidence of anything.
Over Half of M1 Is the Deposits That Moved
That reclassification is not a historical footnote. It still dominates the measure.
| Component of M1 | July 2026 | Share |
|---|---|---|
| Currency | $2,383.2B | 12.0% |
| Demand deposits | $7,087.7B | 35.6% |
| Other liquid deposits | $10,415.5B | 52.4% |
| M1 total | $19,886.4B | 100.0% |
“Other liquid deposits” — the line created for the 2020 reclassification — is 52.4% of M1 today. More than half of the narrow money measure consists of the deposits that were moved into it by a rule change. That is also why M1 now sits at 85.7% of M2, only $3,331.6 billion below it, which surprises anyone taught that M1 is a small slice of M2. It was, until a specific date. One smaller detail worth knowing if you ever reconcile these yourself: currency in circulation is $2,472.3B while the currency counted inside M1 is $2,383.2B. The $89.1 billion difference is vault cash sitting in banks, which the base counts and M1 does not.
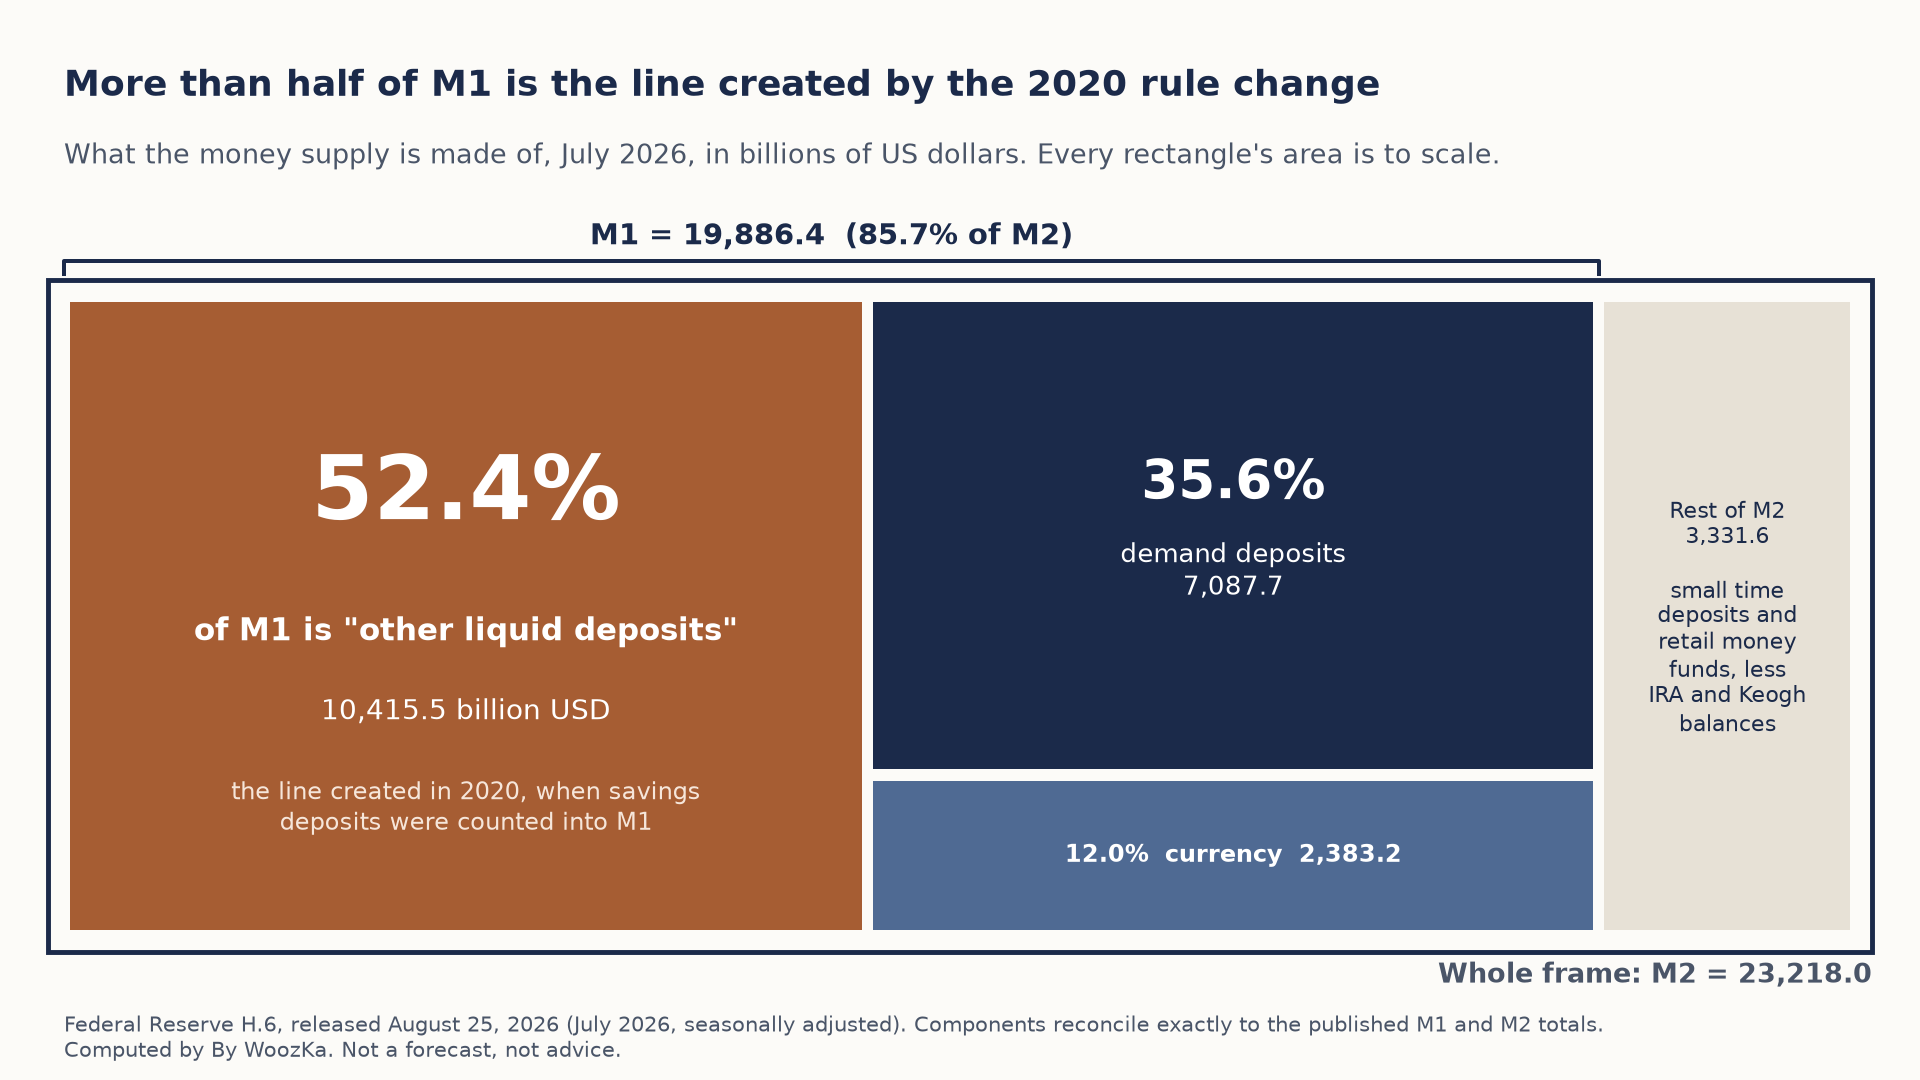 The biggest block inside M1 is the line the 2020 reclassification created, and M1 now fills most of M2. That is why M1 and M2 sit so close together today.
Dates, units and verification for the levels above. Every level is from the H.6 release dated August 25, 2026, for July 2026, seasonally adjusted, in billions of dollars. Only two things are computed from them: shares of a total, and the M2-minus-M1 gap. Each published level was reconciled against an identity in the release before use — currency in circulation plus reserve balances reproduces the monetary base, M1’s three components sum exactly to M1, and M1 plus small time deposits plus retail money funds less IRA and Keogh balances reproduces M2 exactly. These are a dated snapshot and the Fed revises them, so treat the levels as of that release rather than as current forever; the relationships are the durable part. Nothing here claims a causal link between any aggregate and inflation — the honest version of that argument is in the section above, and the limits of it are in “Where the Honest Explanation Stops.” The tables themselves come from code that halts if any identity check fails.
Why the Target Is 2%, Not Zero
Here’s a question that stumps most beginners: if inflation erodes your money, why does the Federal Reserve deliberately aim for 2% inflation instead of 0%? Wouldn’t stable prices be better?
The short answer is that a small, steady amount of inflation is treated as a feature, not a bug. Central banks aim for a low positive number — 2% in the U.S. — for a few reasons the Fed states directly: it provides a buffer against deflation, and it keeps the economy operating with a little breathing room [source: Federal Reserve, “Why does the Federal Reserve aim for inflation of 2 percent over the longer run?”]. Deflation — falling prices — is dangerous precisely because it can feed on itself: if people expect things to be cheaper next month, they delay spending, which weakens demand, which pushes prices down further, and meanwhile the real burden of existing debts rises (you owe the same dollars, but each one is now harder to earn). A small inflation cushion keeps the economy a safe distance from that trap, and it gives the Fed more room to cut interest rates in a downturn without hitting zero. This is one of the tightest links between inflation and your portfolio — the machinery of exactly how the Fed leans on rates to steer inflation is the subject of a companion piece, Why Interest Rates Move Markets.
Why It Matters to Your Money
Now the part that actually touches your wallet. If inflation is the slow erosion of purchasing power, then holding a fixed amount of cash is a quietly losing position over long stretches of time — not because you ever lose dollars, but because each dollar buys less.
Inflation stopped being a concept for me the first time I noticed I was narrating prices out loud — this used to be cheaper, so did that. It’s a small feeling, and a slightly funny one, and it’s also the entire argument compressed into a sentence. The statement balance goes up. The things the balance buys go up faster. Nothing about that shows up as a loss anywhere you’d normally look for one.
The featured chart shows this with simple arithmetic. Take $100 and imagine prices rising at a steady rate while that cash just sits there. At 2% inflation, after 30 years your $100 buys only about $55 worth of what it used to. At 4%, it’s down to roughly $31. At 7%, only about $13 of purchasing power survives. The dollars are all still there; their power isn’t.
A handy shortcut for feeling this in your gut is the “rule of 72”: divide 72 by the inflation rate to estimate how many years it takes for prices to double (and for a dollar’s purchasing power to roughly halve). At 3% inflation, prices double in about 24 years; at 6%, in about 12. That’s why “just keep it all in cash” is riskier over decades than it feels in the moment — the erosion is invisible day to day and enormous over a lifetime.
This is not an argument that cash is bad or that you should pour savings into risky assets to “beat” inflation — every investment carries its own risks, and the right amount of cash for emergencies and near-term needs is genuinely valuable. It’s simply the reason that long-term savers have historically tried to hold at least some assets that can keep pace with rising prices rather than leaving everything in a form that steadily loses purchasing power. Which assets, in what mix, and with what risk tolerance is a personal decision far beyond this article — and one where the honest default is a steady, unglamorous plan rather than a reaction to headlines. The distinction between what builds your wealth and what drains it is the subject of a companion piece, Assets vs Liabilities.
The Historical Extremes: From the 1970s to Hyperinflation
Inflation in a healthy economy is a low hum. But history shows what happens at the edges, and those cases are the best teachers of why price stability matters.
The U.S. “Great Inflation” (1965–1982). For a stretch of American history that anyone over 55 lived through, inflation was the defining economic problem. It climbed through the 1970s and peaked at 14.8% in March 1980 — a world in which prices were rising fast enough to reshape everyday financial decisions [source: U.S. Bureau of Labor Statistics, Consumer Price Index; Federal Reserve History, “The Great Inflation”]. The causes were a now-familiar mix: loose monetary policy, the breakdown of the postwar Bretton Woods currency system, heavy federal spending, and two oil shocks (the 1973 OPEC embargo and the 1979 Iranian revolution) [source: Federal Reserve History, “The Great Inflation”]. Ending it was brutal: under Chairman Paul Volcker the Fed pushed its policy interest rate to around 20% by mid-1981, and inflation fell to roughly 3% by 1983 — but at the cost of a sharp recession and unemployment approaching 11% [source: Federal Reserve History, “The Great Inflation” and “Recession of 1981-82”; BLS]. The episode is the reason central bankers treat high inflation as something to stop early, before it becomes entrenched.
Hyperinflation — the far tail. At the extreme, inflation can spiral into hyperinflation, where a currency loses value so fast it stops functioning as money. Economists point to episodes like Weimar Germany in the early 1920s, Zimbabwe in the late 2000s, and Venezuela in the 2010s, where prices doubled over impossibly short periods and people rushed to spend cash the moment they received it. These are rare, catastrophic cases tied to specific breakdowns — not something a stable, developed economy slides into casually — but they show the endpoint of what unanchored inflation can become.
Deflation — the opposite danger. The mirror image is just as instructive. During the Great Depression, falling prices deepened the collapse as spending froze and debts grew heavier in real terms; Japan spent much of the 1990s and 2000s fighting persistently falling or flat prices. This is why “prices going down” is not the unambiguous good it first appears, and why the Fed aims for a small positive number rather than zero.
Every example here is history, cited with dates and sources — not a forecast. Naming these episodes explains the range of what inflation can do; it says nothing about what inflation will do next.
Where the Honest Explanation Stops
Understanding inflation is genuinely useful. Believing that understanding lets you predict it is where people get into trouble, so here are the limits, stated plainly.
No one reliably forecasts inflation. The next CPI print, next year’s average rate, and the path from here are the subject of enormous professional effort — and the professionals are wrong routinely. This article deliberately makes no claim about where inflation is headed; per the guardrail for this whole section, the job is to explain the machine, not to forecast it.
The causes are debated even in hindsight. As the 2021–2022 episode shows, economists argue about why a given inflation happened long after it’s over. If the causes are contested after the fact, confident predictions before the fact deserve deep skepticism.
The measures are imperfect and get revised. Inflation is an estimate built from surveys, imputations, and methodological choices that change over time. Treat any single number as a well-constructed approximation, not a precise readout of reality — and be wary of anyone who leans on one decimal place to sell you something.
If you filled a grocery cart or a gas tank during the 2021–2022 price surge, you got a visceral education in inflation that no chart fully captures — the same list of items ringing up noticeably higher month after month, and the uneasy sense of your paycheck not stretching as far. That lived experience of watching prices climb in real time teaches something the definition can’t: inflation isn’t an abstraction on a government spreadsheet, it’s the quiet reason a fixed income or an idle savings balance feels tighter every year.
The Beginner’s Takeaway
You don’t need to predict inflation to make sensible decisions about your money — you need to understand that it’s the slow tide your finances sit in. Prices, on average, tend to rise over time; the number on a pile of cash stays put while what it can buy drifts downward. That single fact reframes a lot: why leaving everything in cash for decades carries a hidden cost, why “how much am I really earning after inflation” (your real return) matters more than the headline number, and why the financial news obsesses over every CPI release.
The practical response isn’t to trade around inflation reports or to chase whatever asset is “beating inflation” this quarter. It’s the opposite: because inflation is steady and hard to forecast, the durable answer is a steady plan — keeping enough cash for safety and near-term needs, and, for long-term money, holding assets suited to your own goals and risk tolerance rather than letting savings quietly erode. A simple, rules-based habit like dollar-cost averaging is one way people keep investing through every inflation environment without trying to guess the next print. Inflation will keep doing what it does; your job is to build something that accounts for it instead of being surprised by it.
To see how inflation fits into the larger story of credit, debt, and economic cycles, the pillar for this section — The Economic Machine Explained — is the natural next read. For the weekly plain-English read on what the economy is actually doing, the newsletter is below.
Inflation is one phase of a larger loop. The Economic Cycles Explorer shows where spending outrunning production sits in that loop, and what usually happens next.
Disclaimer: This article is educational content, not financial advice. I am not a licensed financial advisor, and nothing here is a recommendation to buy or sell any security or asset. Investing and trading involve risk, including the possible loss of the money you invest. Do your own research and consider consulting a licensed financial professional before making investment decisions. Read the full Disclaimer.
Historical and backtested results are hypothetical, carry inherent limitations, and do not guarantee future results. Figures were accurate to the best of my knowledge as of this article’s last-updated date and may have changed.
