Risk of Ruin: Why a Winning System Can Still Blow Up
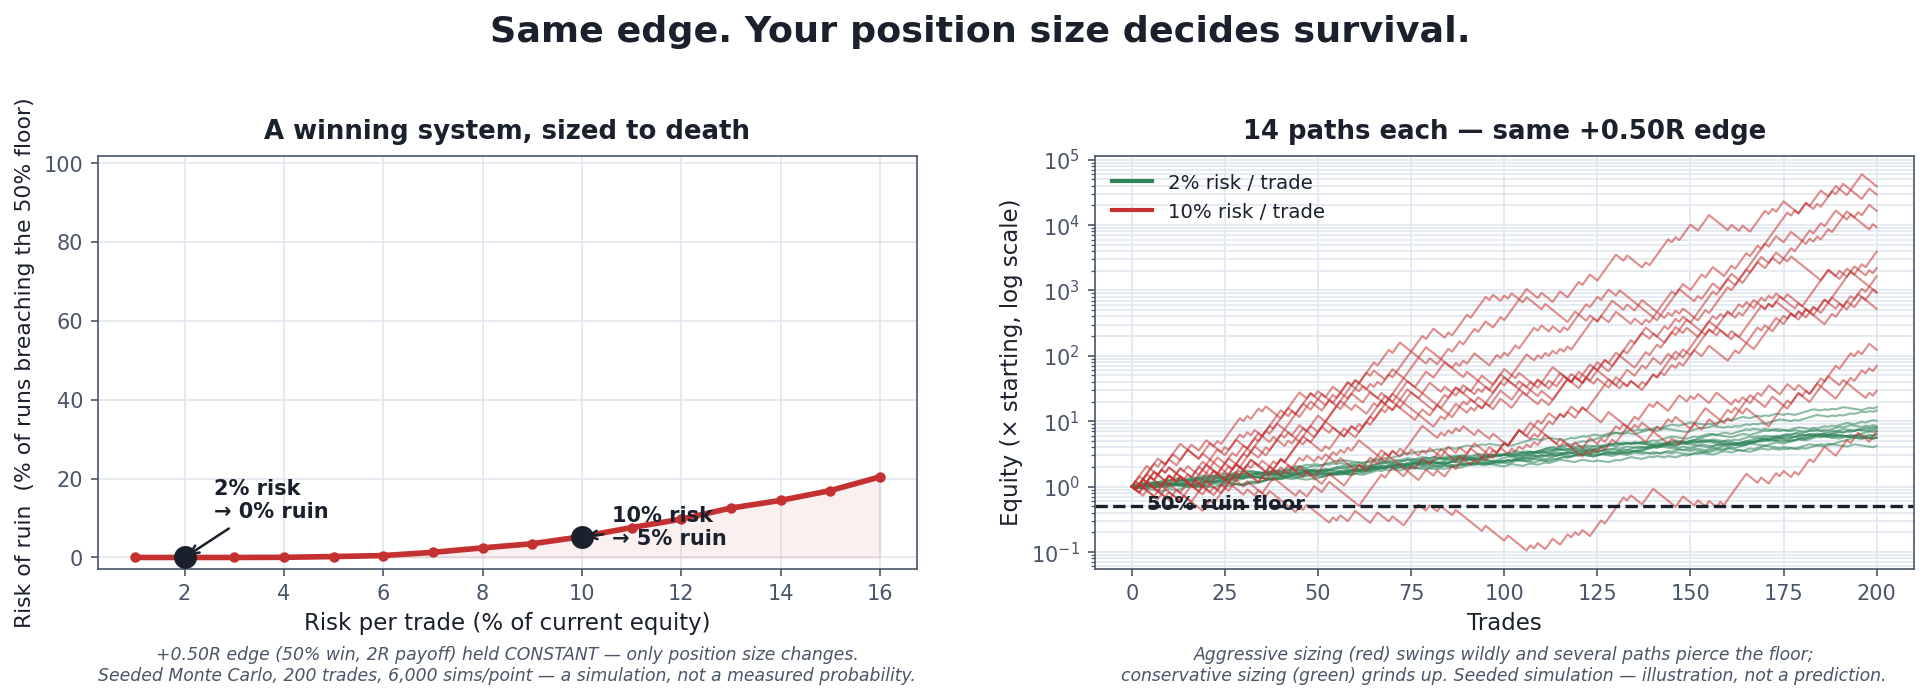
Everything this article argues, in one picture. Both panels use the exact same winning system — a positive edge that never changes. The only thing that changes is how much of the account is risked per trade, and that single choice moves the system from “essentially can’t go broke” to “meaningful chance of blowing up.” Your edge decides whether you make money on average. Your position size decides whether you’re still around to collect it.
There is a specific, gut-punch experience that separates traders who last from traders who don’t: discovering a genuinely profitable system and then destroying the account with it anyway. It sounds impossible — how do you lose money with a winning strategy? — but it happens constantly, and the reason is the single most under-appreciated number in trading: risk of ruin, the probability that you lose enough of your capital to be knocked out of the game before your positive edge has a chance to play out. A good system tells you which way the odds lean. Risk of ruin tells you whether you’ll still be at the table when they do.
This is a trading-systems article, so the silo’s non-negotiable rule governs every line: past backtest performance does not predict future results. Risk of ruin is computed from an assumed edge and simulated draws — it is a statement about a model, not a measured probability and certainly not a forecast of your account. Every number below is an illustration of how the math behaves, not a promise about how your trading will go.
Drawdown Is Temporary. Ruin Is Permanent.
Start with the distinction that the whole concept rests on. A drawdown is a decline from a previous equity peak — painful, but recoverable; your account is down, and it can come back. Ruin is a drawdown you don’t come back from, because it crosses a line past which the game is effectively over. That line can be any of three things, and usually it’s whichever comes first:
- Mechanical: your account falls below the minimum needed to trade the strategy at all — below a margin requirement, below the size where position sizing still works, below the broker’s threshold. You are forced out.
- Practical: the account is so damaged that the math of recovery becomes hopeless (more on this in a second).
- Psychological: you hit the loss that makes you stop — the drawdown so deep you can no longer bring yourself to take the next signal. For most real people this line is reached long before the mechanical one, and it is no less final.
The reason a deep drawdown edges toward ruin is a brutal, unavoidable asymmetry: losses and the gains needed to recover them are not symmetric. Lose 10% and you need 11% to get back. Lose 50% and you need a 100% gain just to break even. Lose 80% and you need 400%. The deeper the hole, the steeper the climb out — which is why a large enough drawdown is functionally ruin even if you technically still have money left. (This asymmetry gets its own full treatment in Drawdown Explained; it is the engine underneath everything on this page.)
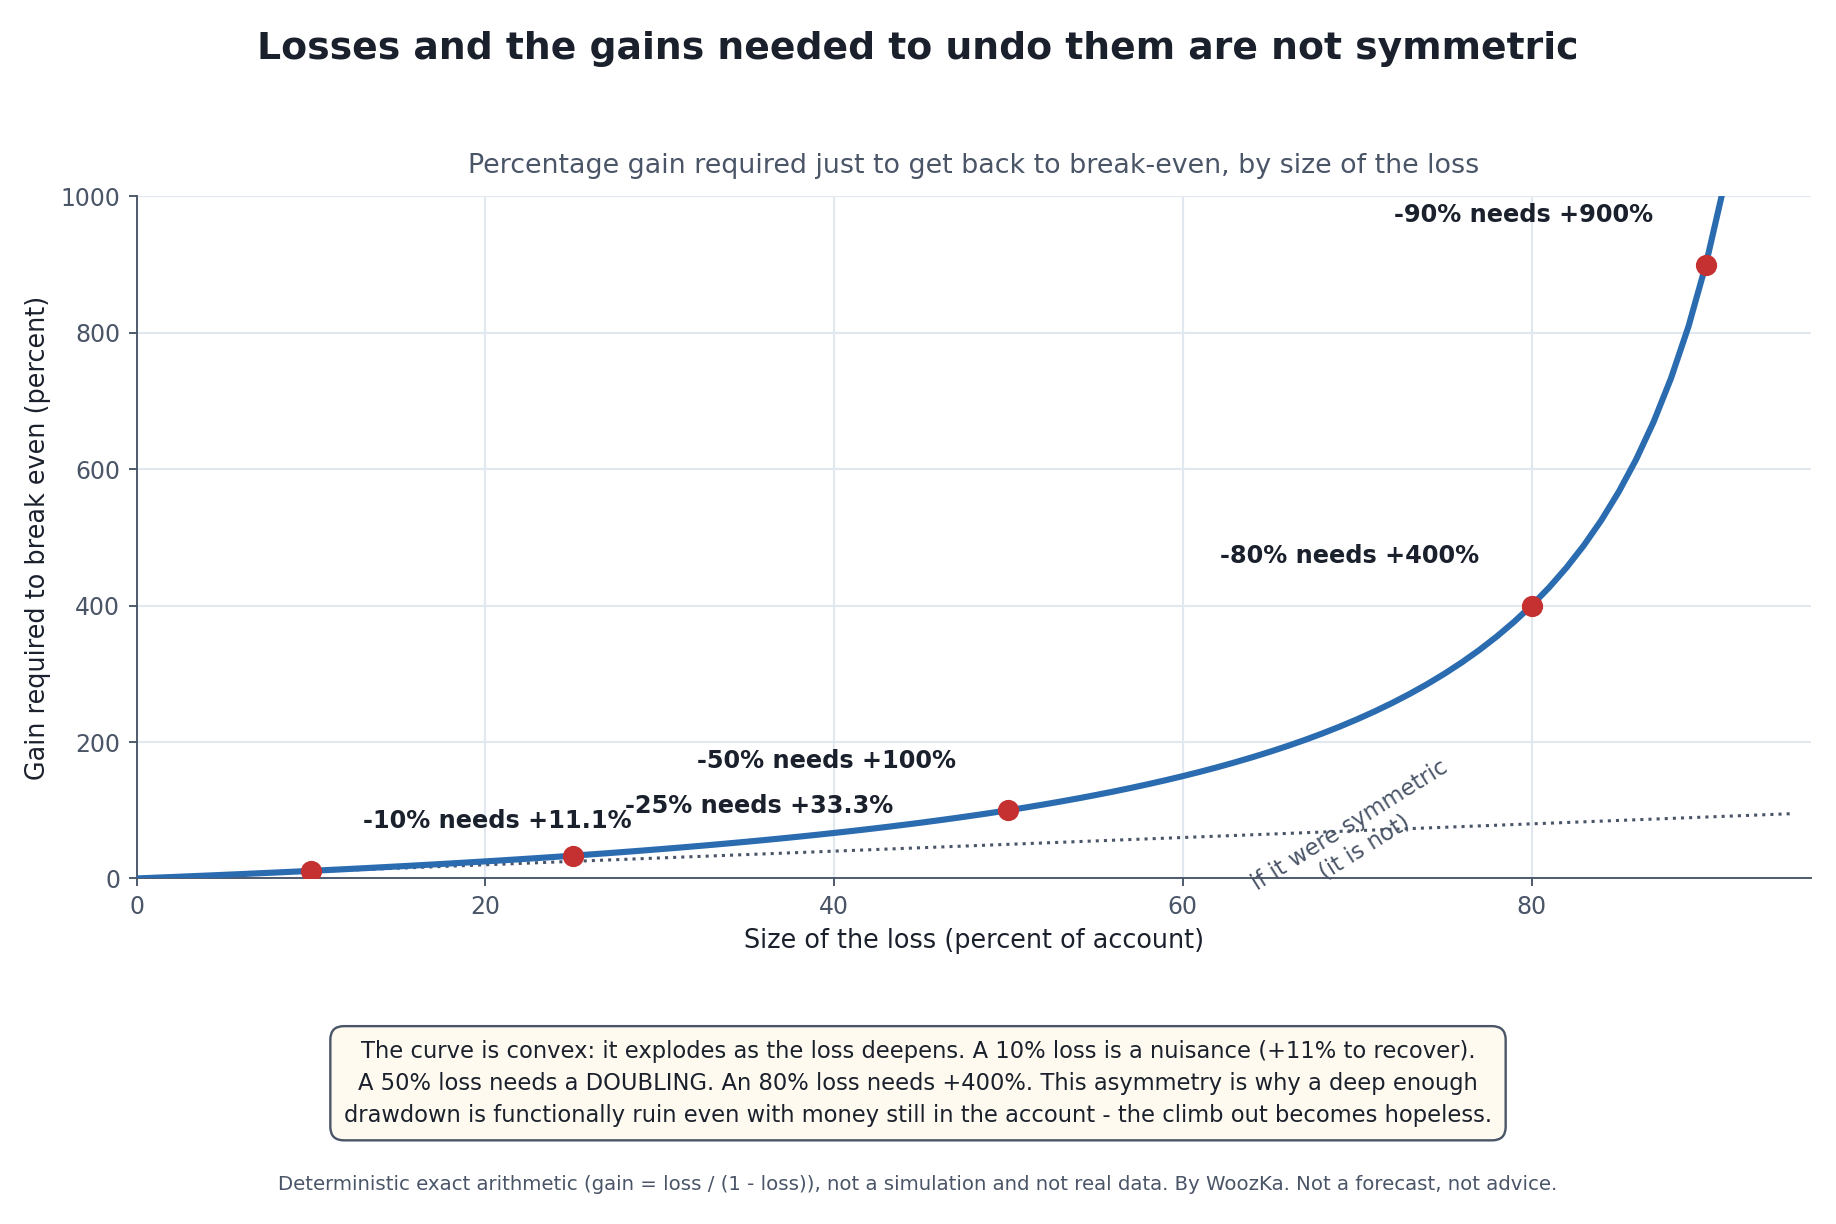
The recovery asymmetry, drawn. In a symmetric world the dotted line would be the whole story — lose X, make X back. It isn’t: the real curve bends sharply upward, so each extra unit of loss costs disproportionately more to undo. A 50% loss doesn’t need a 50% gain; it needs a doubling. That convexity is precisely why “I still have some money left” and “I can realistically recover” are two very different statements.
The Root: Gambler’s Ruin
Risk of ruin isn’t a trading invention — it’s a classic result from probability theory called gambler’s ruin, which asks: a gambler making a series of bets with fixed odds and a finite bankroll, playing against an opponent, will eventually go broke with what probability? The mathematics of that problem, worked out centuries ago, is the direct ancestor of the trading version [source: risk of ruin in trading derives from the classical gambler’s-ruin problem in probability theory — see the general treatment at Wikipedia, “Risk of ruin,” and the survey at QuantifiedStrategies — verified via web search 2026-07-09]. The translation is almost one-to-one: your edge is the gambler’s advantage, your bankroll in units of what you risk per trade is how many bets you can afford to lose in a row, and risk of ruin is the probability the losing streaks bury you before the edge compounds you upward.
The single most important lesson gambler’s ruin teaches is counterintuitive and worth stating flatly: even with a positive edge, ruin is not zero. A favorable game can still bankrupt a player who bets too large a fraction of a too-small bankroll, because a long enough unlucky streak — which will eventually happen — can exhaust the bankroll before the edge asserts itself. Positive edge lowers the probability of ruin; it does not abolish it. What pushes it toward zero is having enough bankroll units and betting a small enough fraction of them.
The Classic Formula
For the simplest case — wins and losses of equal size — the trading risk-of-ruin formula is clean enough to reason about directly:
Risk of ruin = ((1 − Edge) ÷ (1 + Edge))^N
where Edge is your per-trade advantage as a fraction (for equal-sized wins and losses, Edge = win rate − loss rate = 2 × win rate − 1), and N is the number of “units” of risk in your account (your capital divided by the dollars you risk per trade) [source: the simplified equal-payoff risk-of-ruin formula RoR = ((1−Edge)/(1+Edge))^N, with Edge the per-trade advantage and N the account size in risk units — as summarized at QuantifiedStrategies, PatternsWizard, and the ayondo/Ralph Vince calculator — verified via web search 2026-07-09].
Two examples show why the formula is worth staring at. Take a 55% win rate with equal win/loss sizes, so Edge = 0.55 − 0.45 = 0.10. The base ratio is (1 − 0.10) ÷ (1 + 0.10) = 0.90 ÷ 1.10 = 0.818.
- If you risk enough that your account is only N = 5 units deep (i.e. you risk 20% of capital per trade), risk of ruin = 0.818^5 ≈ 37%. More than a one-in-three chance of blowing up — with a winning system.
- If you risk so that your account is N = 20 units deep (5% per trade), risk of ruin = 0.818^20 ≈ 2%.
- At N = 50 units (2% per trade), risk of ruin = 0.818^50 ≈ 0.004% — effectively zero.
Same edge, same win rate — the only thing that changed was how many units of risk the account holds, i.e. how big each position is. The edge set the base of the exponent; position size set the exponent, and the exponent is where the power is. That is the entire thesis of this article, and of the featured chart: hold a winning edge perfectly constant and slide only the position-size lever, and you can move the system from “practically immortal” to “coin-flip on survival.”
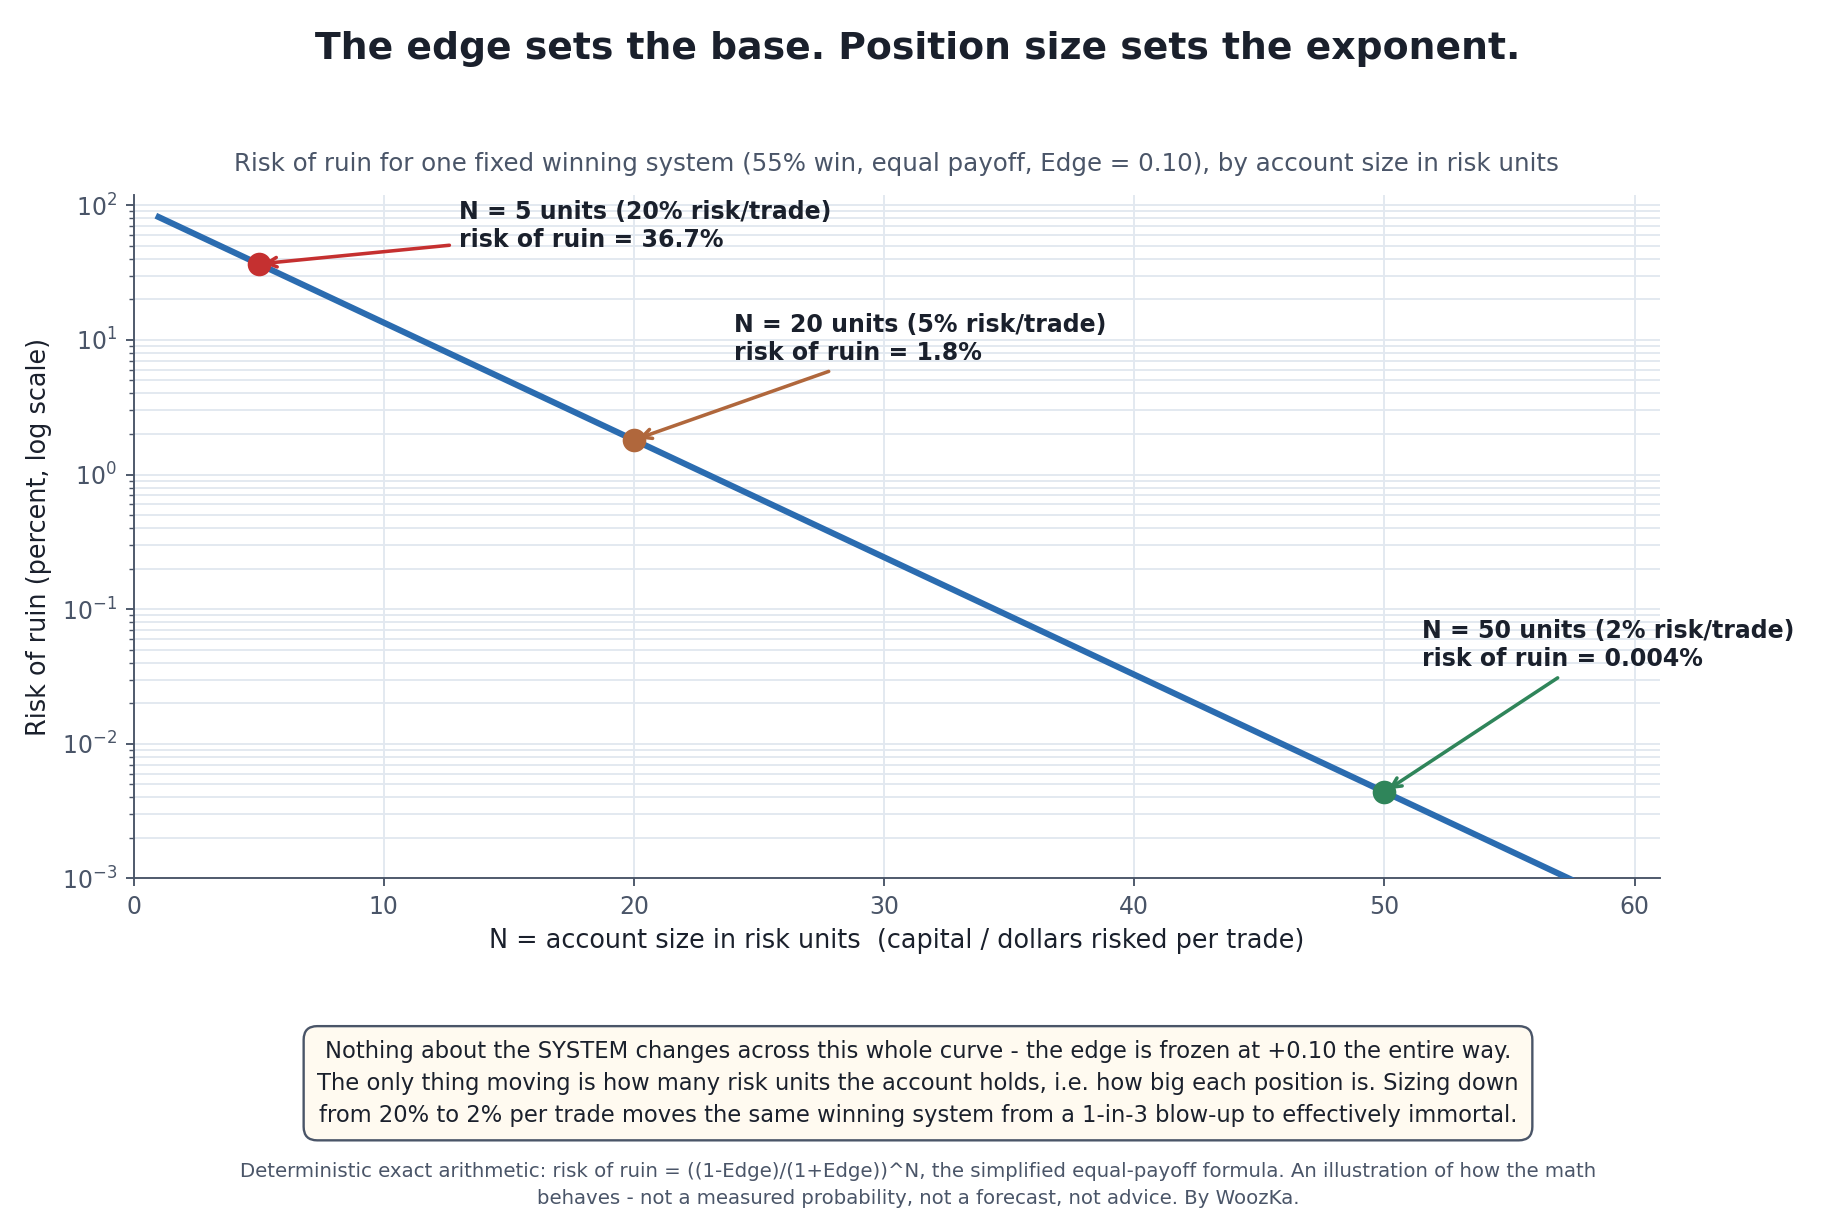
The same three worked examples above, now as one line. Because risk of ruin is the base ratio raised to the power N, a straight line on this log scale, plotting it makes the point the arithmetic was making: the edge fixes where the line starts, but N — how big you bet — decides how fast it plunges toward zero. Every point on this line is the identical winning system. Only the bet size is different.
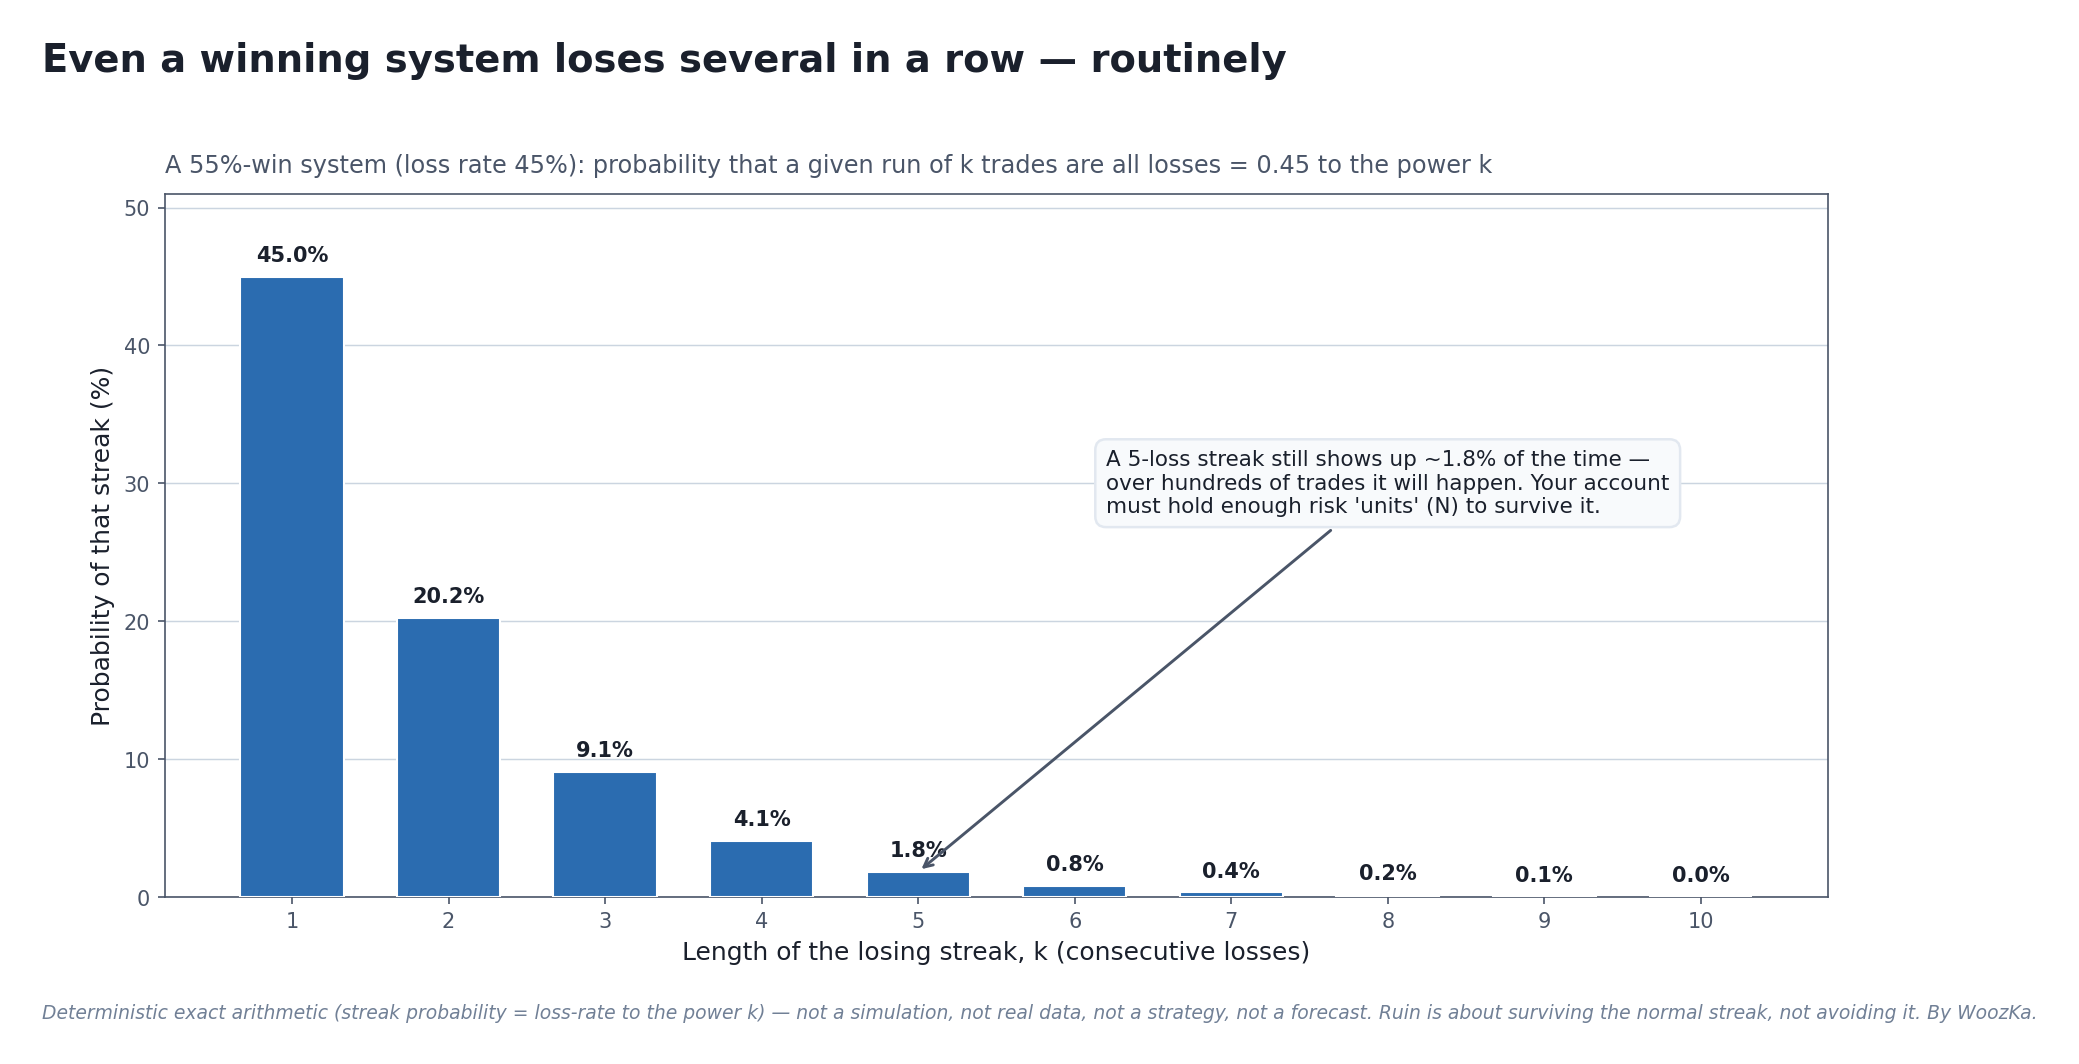
The losing streaks are not bad luck to be avoided — they are arithmetic. A positive edge does nothing if a perfectly ordinary run of losses empties the account before the edge can compound.
The Three Levers — and Which One Matters Most
Risk of ruin has exactly three inputs, and they are not equally powerful:
- Win rate — how often you win. Raising it lowers ruin, but win rate is hard to improve and, as the expectancy article shows, can even be a distraction.
- Payoff ratio — how big your wins are relative to your losses. A better reward-to-risk ratio lowers ruin, and is often more improvable than win rate.
- Risk per trade (position size) — what fraction of the account each trade puts at risk. This is the lever you control most directly, most immediately, and with the most leverage over the outcome.
The featured chart isolates that third lever by freezing the first two: it uses a fixed, healthy edge of +0.50R (a 50% win rate paying 2-to-1) and changes nothing but risk per trade. At 1–2% per trade the simulated risk of ruin sits at essentially 0%; push it to 10% per trade and ruin climbs to roughly 5%; push it toward 16% and it passes 20% [source: seeded Monte Carlo simulation run by this site — 6,000 runs of 200 trades per risk level, ruin = equity ever falling to ≤50% of the start; results are a simulation of the model, not a measured probability]. The system’s quality never moved. Only the size of the bet did. This is why experienced traders will tell you that position sizing, not signal quality, is where most accounts are actually won or lost — you can have the better system and still finish behind the disciplined trader with the worse one, purely on sizing.
Why the Real Answer Needs a Simulation
The clean formula above hides an assumption that matters: it treats each risk “unit” as a fixed dollar amount and wins/losses as equal-sized. Real trading usually isn’t like that. Most disciplined traders size as a fixed fraction of current equity (risk 2% of whatever the account is now), wins and losses come in different sizes, and — crucially — the order in which they arrive changes the outcome. A bad streak early, while the account is smaller, does more damage than the same streak later. Because sequence matters, there often isn’t a tidy closed-form answer, which is exactly why the tool that accompanies this article is a Monte Carlo simulation: it doesn’t solve an equation, it plays out thousands of random orderings of your wins and losses and counts how often the account breaches a ruin floor.
That’s also why the simulator gives a slightly different answer each time you run it, and why that wobble is a feature, not a bug: risk of ruin is a probability, not a fixed fact, and watching the number jump around on re-runs is the honest way to feel that. The right panel of the chart is fourteen such simulated paths at each risk level — the green (2%) paths grind calmly upward while the red (10%) paths swing wildly, several diving toward the ruin floor even though every one of them is trading the same winning edge.
Putting the Three Levers on One Scale
The levers section above asserts a ranking — risk per trade dominates — and then demonstrates only that one lever, because the chart deliberately freezes the other two. The claim is right, but the article never shows the other two moving, so there is no way to see by how much it is right. The closed-form model from “The Classic Formula” can answer that directly, using nothing but this article’s own baseline: a 50% win rate paying 2-to-1, ruin defined as equity ever falling to half the starting stake.
Start where the article starts its warning — risk per trade pushed to 10%, which on this model gives a ruin probability of 9.017% — and ask each lever, separately, to bring that down to 1.00%.
Three ways to buy the same safety. Each row moves one lever only, from the same starting point, to the same destination.
| Lever | Must move | Ruin after | Edge after |
|---|---|---|---|
| Risk per trade | 10% → 5.2247% | 1.00% | +0.50R, unchanged |
| Win rate | 50% → 64.2427% | 1.00% | +0.9273R |
| Payoff ratio | cannot get there | 3.125% floor | — |
Read the rows against what each one would take in practice. The first asks you to trade smaller — a decision available this afternoon, requiring nothing from the market and nothing new from the strategy. The second asks for 14.2427 percentage points of additional win rate, which is not an adjustment to this system but a different and considerably better one. And the third cannot deliver at all, which is the result worth sitting with.
The Floor the Payoff Ratio Cannot Cross
Push the payoff ratio up and ruin does fall — but it stops falling. At the article’s 10%-risk setting, ruin approaches 3.125% and stays there no matter how large the winners get: 100-to-1 and 100,000-to-1 both return 3.125%. The reason is plain once seen. Risking 10% of the account against a 50% floor leaves room for exactly five consecutive losses, and the chance of losing the first five trades is 0.5 × 0.5 × 0.5 × 0.5 × 0.5 = 3.125%. A trader ruined in the first five trades never reaches the sixth, so the size of the winner that would have arrived is irrelevant.
That generalizes exactly. As the payoff ratio grows without limit, ruin converges on the loss rate raised to the number of risk units the account holds — and the shipped calculator agrees to full precision at every setting tested.
The unreachable floor, at five settings. The last two columns are computed independently and match exactly.
| Win rate | Risk | Units | Loss rate ^ units | Calculator |
|---|---|---|---|---|
| 50% | 10% | 5.000 | 3.125000% | 3.125000% |
| 50% | 5% | 10.000 | 0.097656% | 0.097656% |
| 50% | 16% | 3.125 | 11.462551% | 11.462551% |
| 40% | 10% | 5.000 | 7.776000% | 7.776000% |
| 60% | 10% | 5.000 | 1.024000% | 1.024000% |
Notice which lever sets that floor. It is not the payoff ratio, which is the thing being pushed to infinity, and it is only half set by the win rate. The exponent — the number of losses the account can absorb — is decided entirely by risk per trade. So risk per trade does not merely outrank the other two levers on this model; it fixes the ceiling on how much good they are allowed to do.
The Lever That Costs Nothing
There is a second asymmetry, and it is the one that makes the ranking practical rather than merely mathematical.
Four risk settings, one system. Ruin moves across ten orders of magnitude; the edge does not move at all.
| Risk per trade | Units of room | Ruin | Expectancy |
|---|---|---|---|
| 1% | 50.000 | 0.000000004% | +0.50R |
| 2% | 25.000 | 0.000596086% | +0.50R |
| 10% | 5.000 | 9.016994375% | +0.50R |
| 16% | 3.125 | 22.228677459% | +0.50R |
The last column never changes. That is the chart’s caption — “the system’s quality never moved” — rendered as arithmetic instead of as an assertion, and it is the whole argument for the ranking. Win rate and payoff ratio cannot be improved without changing what the system is; every gain in survival from those two levers is paid for by finding a genuinely better strategy. Risk per trade buys survival on credit no one has to extend. It is the only one of the three that is free.
Why These Numbers Differ From the Chart’s
One reconciliation is owed here, because the figures above do not match the ones in the levers section, and the difference is instructive rather than an error in either.
Two models, same settings. The chart runs a 200-trade Monte Carlo; the table above runs the closed-form formula with no horizon at all.
| Risk per trade | Chart, simulated | Closed form |
|---|---|---|
| 1–2% | essentially 0% | 0.000000004% / 0.000596% |
| 10% | roughly 5% | 9.017% |
| 16% | passes 20% | 22.229% |
They agree closely at both ends and diverge in the middle, and two differences between the models pull in opposite directions, so the gap cannot be blamed on either one alone. The simulation stops after 200 trades while the formula asks whether ruin ever happens over an unbounded future, which makes the formula’s answer larger. The simulation measures the deepest fall from any peak while the formula measures distance from the starting stake, which makes the simulation’s answer larger. The simulation also compounds the bet as the account changes size, where the formula holds the risk unit fixed. Neither is the true number, because there is no true number — each is a different precise question, and the sensible reading is the one both agree on: at 1–2% this system is effectively safe, at 16% it is not, and the entire journey between those two states was made by the sizing slider.
Method and limits, so this can be checked rather than taken on trust. The baseline — 50% win rate, 2-to-1 payoff, a ruin floor at half the starting stake, and the 1%, 2%, 10% and 16% risk settings — is taken from this article unchanged. Every ruin figure came from computeRiskOfRuin and riskOfRuinRoot, the shipped functions behind this site’s Risk of Ruin Simulator, called directly and transcribed; separate code re-derives each one from the gambler’s-ruin equation and checks agreement with the calculator to twelve decimal places before it reports anything, including the floor identity at all five settings shown. The two lever targets were found by bisection on that same model. This is the closed-form model and it carries that model’s assumptions: equal-sized risk units, independent trades, and no horizon — which is exactly why the article reaches for a simulation instead, and why the last table exists. Nothing here is a backtest, no market data was used, and none of it forecasts any account’s results.
Where the “1–2% Rule” Comes From
You’ve probably heard the rule of thumb to risk no more than 1–2% of your account on any single trade. Risk of ruin is why that rule exists. At those small fractions, the account holds so many units of risk (50 to 100) that for any system with a real positive edge, the exponent in the ruin formula drives the probability of ruin down to a rounding error — while still leaving room to compound. Keeping risk per trade in the 1–2% band is the single most reliable way to push risk of ruin below a few percent, almost regardless of the specifics of the system [source: the 1–2%-per-trade convention as a risk-of-ruin-control rule of thumb — QuantifiedStrategies and standard risk-management references — verified via web search 2026-07-09; treat it as a rule of thumb, not a guarantee]. It is not a magic number, and it doesn’t make ruin impossible — nothing does — but it is the closest thing trading has to a universal survival setting.
Leverage Is Risk of Ruin’s Accelerant
This is where the concept bites hardest for the leveraged trader, and why it was worth pulling this topic out of the forex-and-futures corner and into the core of system design. Leverage doesn’t change your edge — it changes your position size, which is precisely the lever that dominates risk of ruin. Trading with high leverage means each trade risks a large fraction of your actual capital even if the notional “percent move” looks small, which collapses the number of risk units your account holds and sends the ruin exponent the wrong way. A forex or futures account that would be nearly ruin-proof at 1% risk per trade can become a near-certain blow-up at high leverage with wide stops, with the identical strategy. The margin call is just the mechanical version of ruin arriving on schedule. (The mechanics of how leverage magnifies both sides are covered in Leverage in Forex and Margin Calls Explained; risk of ruin is the probability math that sits on top of them.)
Ruin Is a Distribution, Not a Single Number
The last idea to carry away is that a single “risk of ruin = 3%” figure, while useful, undersells what the simulation actually shows you. Run the model and you get a whole distribution of outcomes: not just the fraction of runs that hit the floor, but the median ending equity, the best and worst cases, and — often more useful than the ruin number itself — the maximum drawdown you should expect along the way. A system can have a comfortably low risk of ruin and still routinely put you through drawdowns deep enough to make you quit — which loops straight back to the psychological ruin line from the start of this article. The number that keeps you solvent and the number that keeps you sane are different, and a serious trader plans for both.
If you haven’t yet watched sizing decide someone’s fate, the pattern is worth knowing in advance, because it’s almost a genre. Someone finds a system that genuinely works. It wins enough, early enough, that confidence turns into conviction, and conviction turns into size — bigger positions, then bigger still, because if the edge is real, why not press it? For a while the larger bets just mean larger wins, which feels like being rewarded for boldness. Then the normal, inevitable losing streak arrives — the one every positive-edge system produces — and because the positions are now so large, that ordinary streak carves out an extraordinary hole, deep enough to trip the margin line or the willpower line or both. The system never stopped working. The trader simply sized it past the point where a routine bad run became fatal. The ones who avoid this aren’t braver or better at picking trades. They decided, in advance and in cold blood, how much a losing streak was allowed to cost them — and then they never let a good run talk them out of it.
Simulate It on Your Own Numbers
The Risk of Ruin Simulator exists to make all of this tangible on your own assumptions. Give it a win rate, a payoff ratio, a risk-per-trade percentage, and a ruin floor, and it runs thousands of Monte Carlo trials and reports the risk of ruin, the median and best/worst ending equity, and the drawdowns you should brace for — plus a histogram of where the runs ended up. Then do the one thing that teaches the lesson for good: leave the win rate and payoff exactly where they are, and drag only the risk-per-trade slider up. Watch a safe system turn dangerous with nothing changed but the size of the bet. The simulator is a labeled model, not a forecast — it plays out random draws under rules you set, and its output is an educational estimate of how those rules behave, never a prediction of your account.
Where to Go Next
Risk of ruin is the survival half of system design. These are the pieces around it:
- Position Sizing Rules for Systematic Traders — the companion pillar. Risk of ruin is the why; this is the how much — the concrete rules that keep the exponent on your side.
- Trade Expectancy Explained — expectancy decides whether the system makes money on average; risk of ruin decides whether you survive long enough to see the average. You need both to be positive.
- Drawdown Explained — the recovery asymmetry that turns a deep drawdown into functional ruin, in full.
- What Makes a Trading System Robust? A Checklist — where edge, drawdown, sizing, and ruin all come together into one go/no-go judgment.
- Leverage in Forex and Margin Calls Explained — the leveraged-trading mechanics that make risk of ruin the most important number on the page.
If you want the plain-English, rigor-first, show-the-failures read on building and surviving trading systems, that’s what the newsletter is for. Subscribe below to get the system-builder’s checklist.
Disclaimer: This article is educational content, not financial advice. I am not a licensed financial advisor, and nothing here is a recommendation to buy or sell any security or asset. Investing and trading involve risk, including the possible loss of the money you invest. Do your own research and consider consulting a licensed financial professional before making investment decisions. Read the full Disclaimer.
Historical and backtested results are hypothetical, carry inherent limitations, and do not guarantee future results. Figures were accurate to the best of my knowledge as of this article’s last-updated date and may have changed.
