How Institutions Size a Position, Honestly: Volatility Targeting and Risk Parity
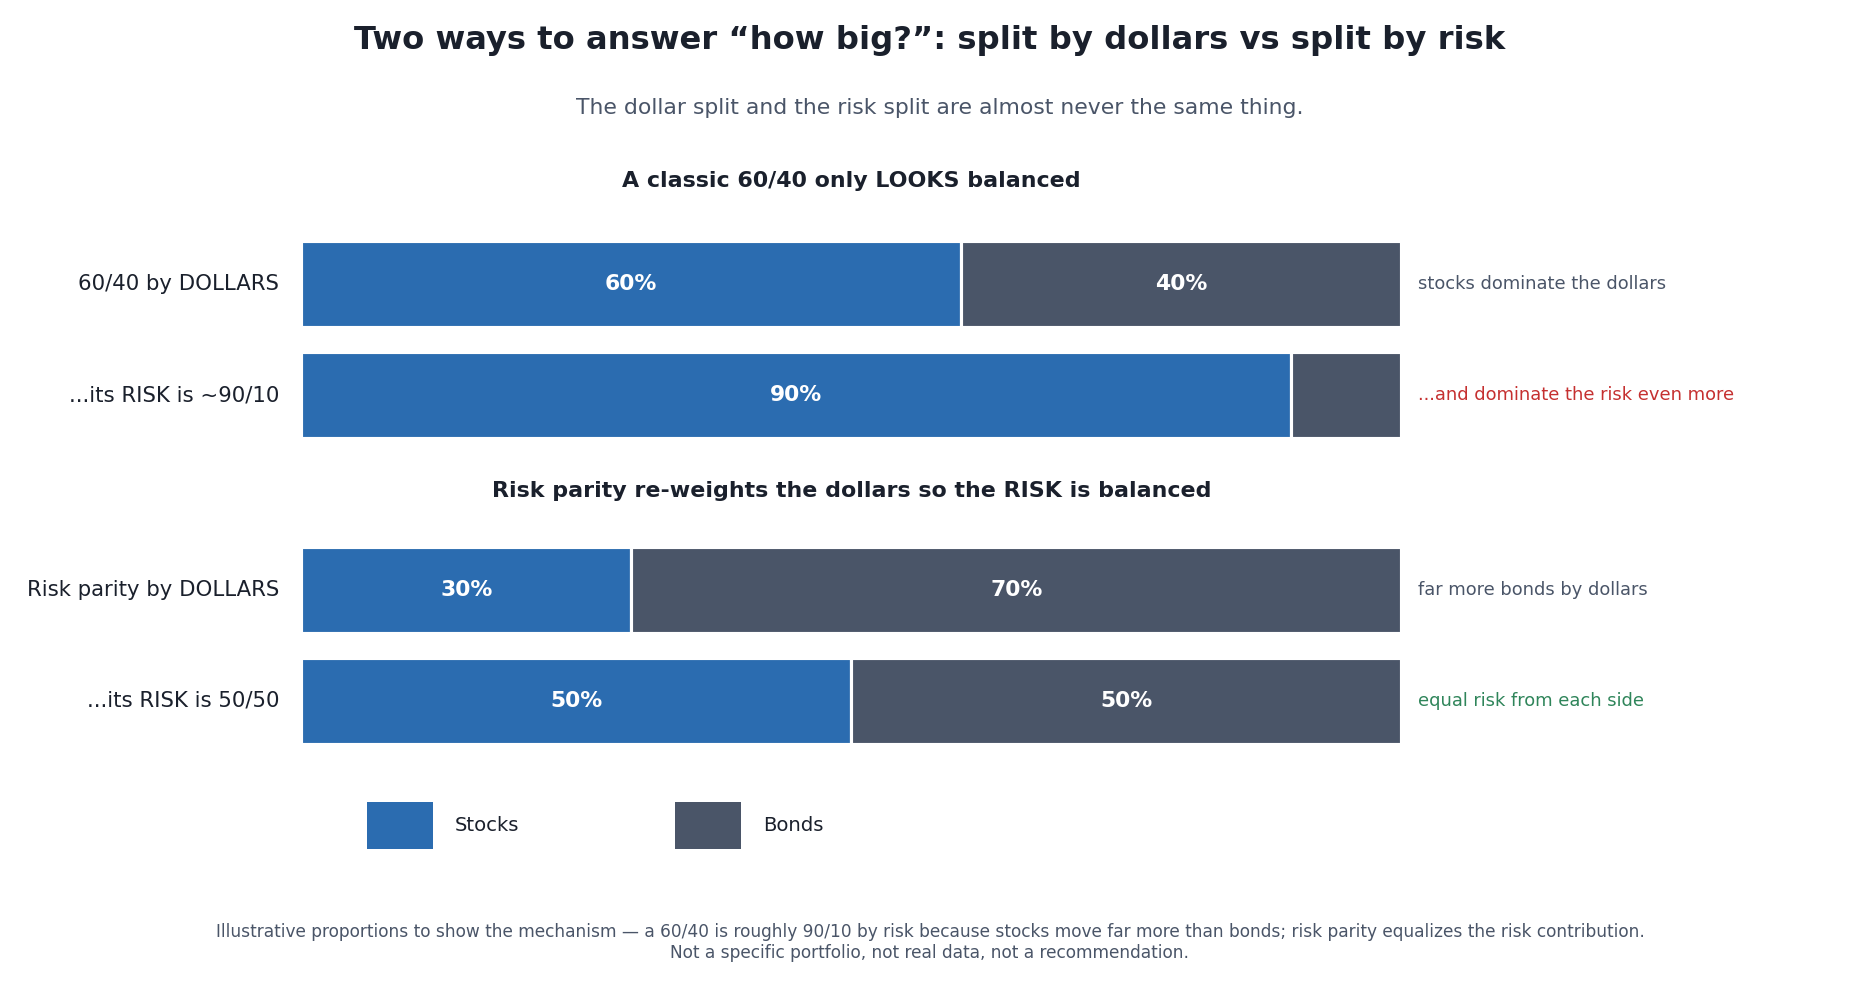
The one idea this whole article is built on: the amount of money you put in a position and the amount of risk that position adds are two different numbers, and they are almost never equal. Professionals size by the second one. Illustrative proportions, not a real portfolio.
Ask a retail trader how big a position should be and the honest answer is usually some version of “as big as I’m comfortable with,” scaled up when the idea feels strong. Ask an institutional desk the same question and you get something that sounds almost bureaucratic: it depends on the position’s volatility, the risk budget for the book, and what it’s correlated with. Nobody on the desk is being asked how confident they feel. That gap — sizing by conviction versus sizing by risk — is the whole subject here, and it’s one of the few genuinely portable things about the way professionals trade.
This is a trading-systems article, so the silo’s permanent caveat governs every line: past performance, backtested or live, does not predict future results. Everything below describes methods for deciding how big a position is — not a claim that any of them will make you money. Two of the methods have famous failure modes, and I’m going to spend as much time on those as on the appeal, because a sizing rule you don’t understand the downside of is just a different way to blow up.
Start With the Thing Retail Gets Backwards
Most people size a position in dollars and think they’ve sized it in risk. They put “10% of the account” into each of ten names and call it diversified. But if two of those names are a sleepy utility and a pre-revenue biotech, the equal dollar weights are wildly unequal risk weights — the biotech might contribute ten times the portfolio’s day-to-day swings that the utility does. The account looks balanced and behaves like a bet on the biotech.
The institutional instinct is to flip the question. Instead of “how many dollars do I want here,” ask “how much risk do I want this position to contribute,” and then let that answer, plus the asset’s volatility, back out the dollar size. The featured schematic shows the gap in its starkest form: a textbook 60/40 stocks-and-bonds portfolio, which sounds balanced, is really something like a 90/10 portfolio once you measure where the risk comes from, because stocks are so much more volatile than bonds that they dominate the ride even at a smaller dollar weight. “Balanced by dollars” and “balanced by risk” are different portfolios wearing the same name.
Once you accept that framing, two specific methods fall out of it — one for sizing a single strategy over time, one for splitting risk across several assets. They’re the two ideas worth actually knowing.
Volatility Targeting: Let the Market’s Mood Set the Size
Volatility targeting is the simpler of the two, and the more broadly used. The rule is one line: pick a level of volatility you want the position (or the whole book) to run at — say 10% annualized — and continuously scale the exposure so that the position’s actual volatility stays near that target. When the asset gets calmer, you hold more of it; when it gets wild, you hold less. The size moves opposite to the volatility.
The arithmetic is almost embarrassingly simple. If your target is 10% annualized volatility and the asset is currently running at 20%, you hold half a unit (10 ÷ 20 = 0.5). If the asset calms down to 8%, you’d hold 1.25 units (10 ÷ 8), which means borrowing a little to lever up past fully invested. The exposure is just target vol ÷ current vol, recomputed as the estimate of current vol changes.
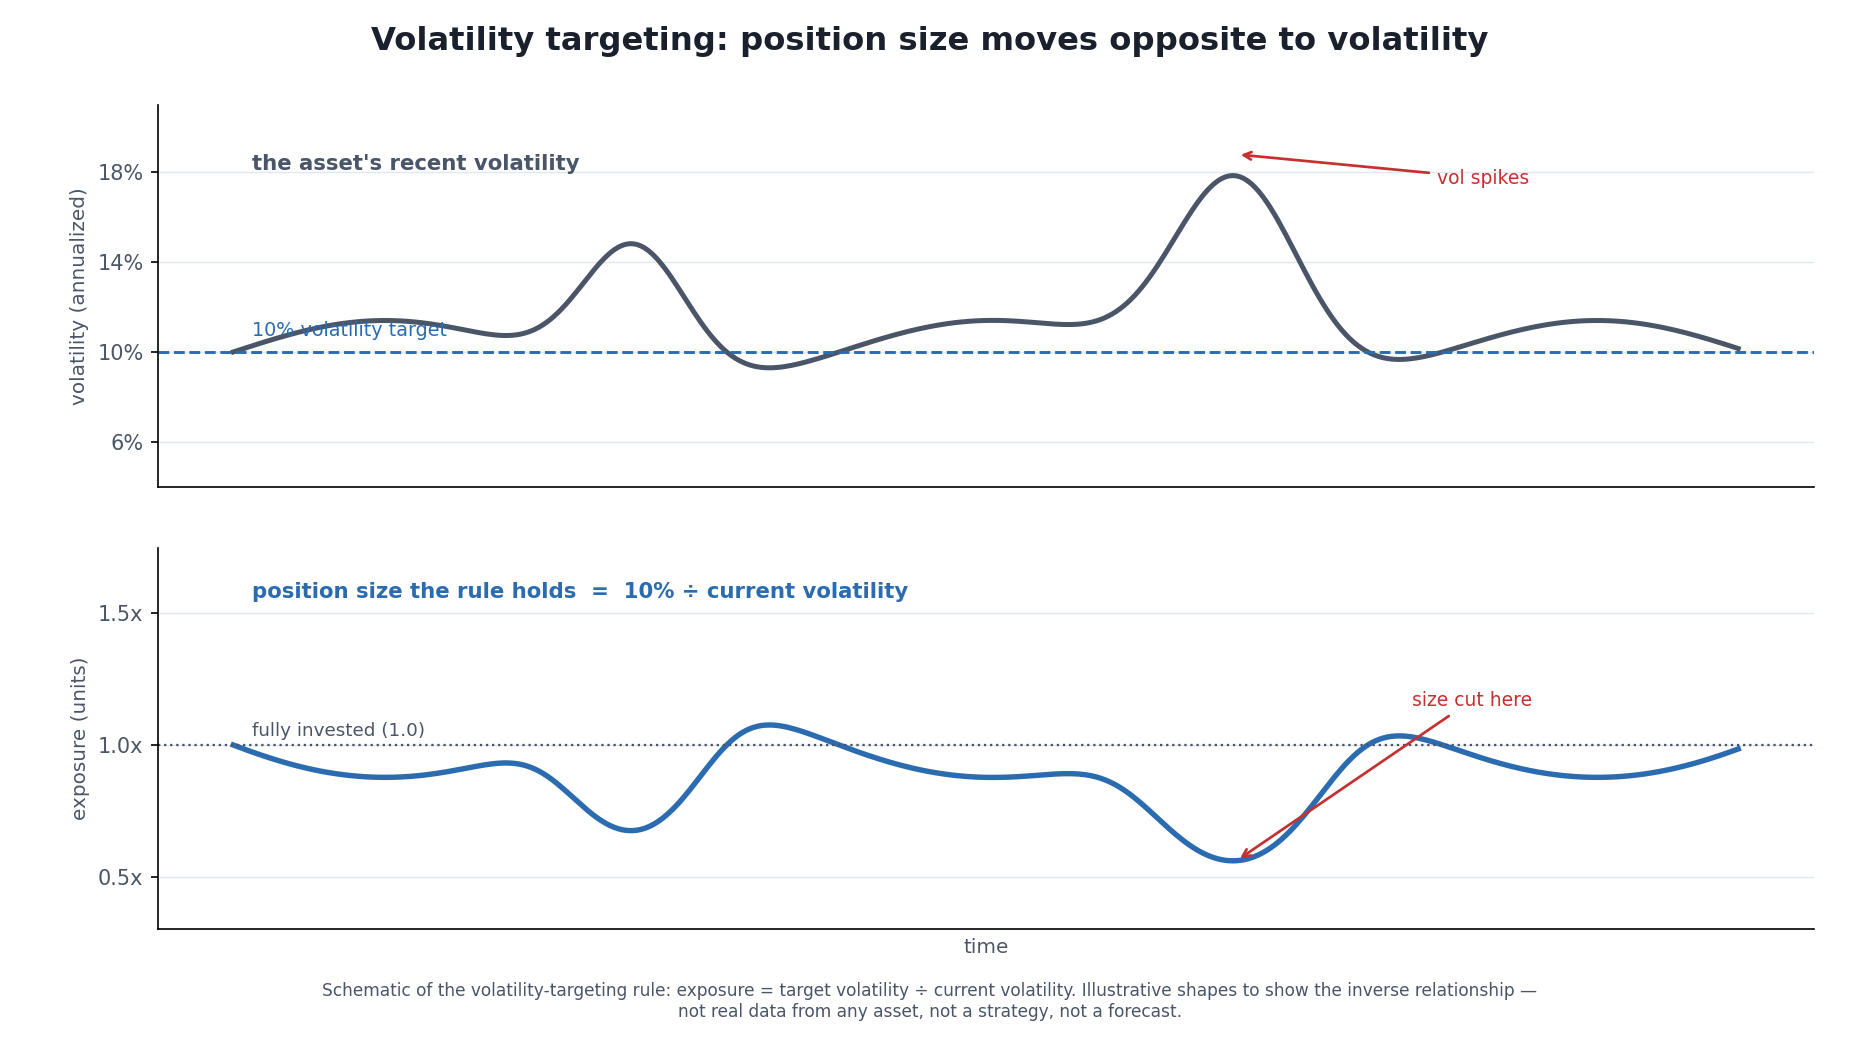
The rule in one picture: when the market gets loud (top), the position gets small (bottom), automatically. It keeps the ride roughly constant — which is the appeal and, as the next section shows, also the trap. Illustrative shapes, not real data.
Why bother? The honest case for volatility targeting is that it does two useful things at once. It keeps the risk of the book roughly constant instead of letting it balloon in turbulent markets and shrink in calm ones — a position sized for a sleepy market becomes a much bigger real bet the moment volatility triples, and volatility targeting quietly undoes that. And because volatility tends to cluster — calm follows calm, and violent days follow violent days, a well-documented feature of financial returns — reacting to a vol spike by trimming isn’t purely backward-looking; elevated volatility today genuinely does raise the odds of elevated volatility tomorrow. There’s also evidence that scaling exposure by volatility has historically improved the risk-adjusted profile of some equity and multi-asset strategies, partly because the worst single days have tended to cluster in already-high-volatility regimes the rule would have you underweight [source: Moreira & Muir, “Volatility-Managed Portfolios,” Journal of Finance 72(4), 2017 — found that reducing exposure when volatility is high raised Sharpe ratios across several equity factors; note this is one influential study of a historical sample, not a settled law, and later work debates how much survives transaction costs and implementation lag].
That last clause matters, and I’ve left it deliberately unsmoothed. “It improved Sharpe in one careful study of the past” is a very different sentence from “it works,” and the gap between them is exactly where sizing rules go to die.
The Failure Mode Nobody Advertises: Selling the Bottom
Here’s the part the pitch decks skip. Volatility targeting is, by construction, a rule that sells into weakness and buys into calm — and weakness and calm are not symmetric in time. Volatility almost always spikes while prices are falling, not while they’re rising. So the rule tells you to cut your position hardest right as the market is going down, and to add back only after it has settled — which is often after it has already recovered. You are, mechanically, trimming near lows and rebuilding near highs.
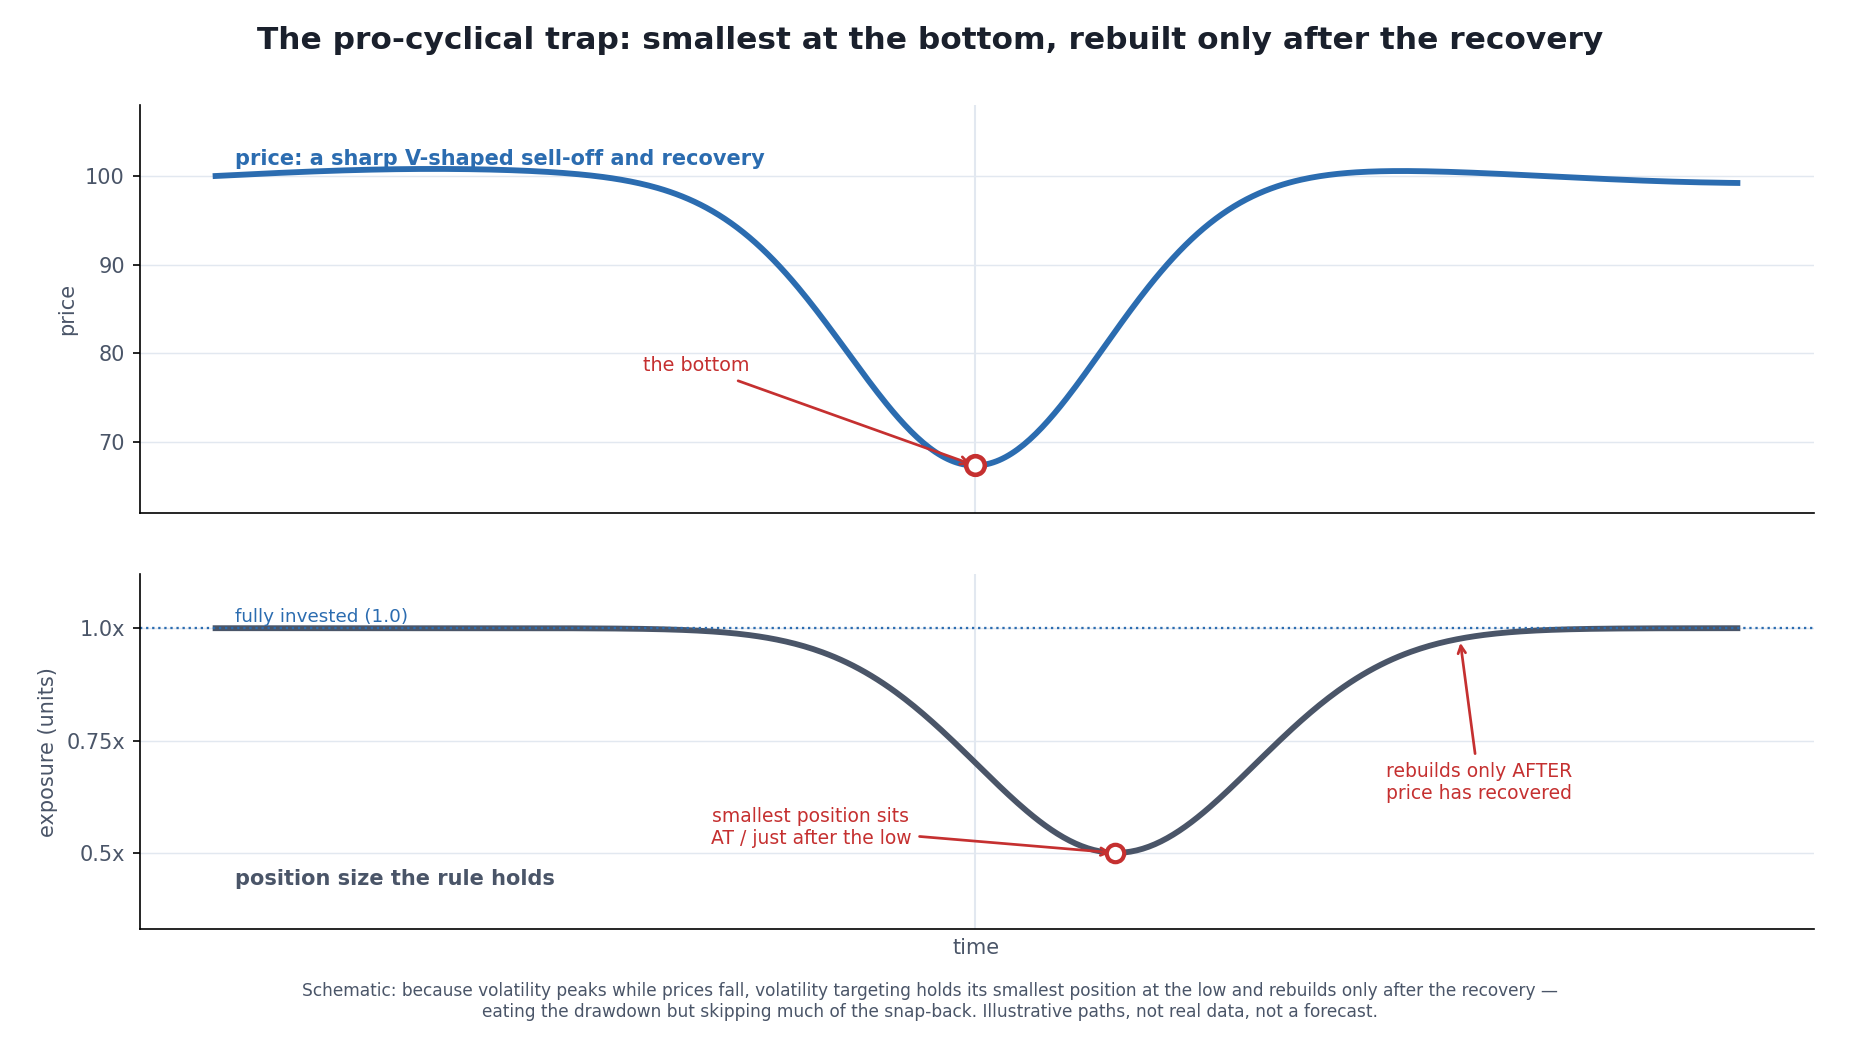
The same rule, seen unkindly. A sharp V-shaped sell-off and recovery is the worst case for volatility targeting: it’s smallest at the bottom and largest after the rebound, so it eats the drawdown but skips much of the snap-back. Illustrative, not real data.
In a slow, grinding bear market the rule shines — it gets you out of the way of a sustained storm. In a violent V-shaped crash-and-recover, like March 2020, it can be exactly wrong: it deleverages into the panic and misses the rebound, turning a temporary paper loss into a realized one plus a missed recovery. And because so many large players run similar volatility-responsive rules, their simultaneous deleveraging can add to the selling pressure that spiked volatility in the first place — a feedback loop that has been blamed, at least in part, for the speed of episodes like the February 2018 “volmageddon” unwind. A rule that everyone follows stops being a private edge and starts being a crowd. None of this makes volatility targeting bad. It makes it a tool with a known bias — good at sustained risk, poor at sharp reversals — and using it without knowing which regime you’re in is how it hurts you.
Risk Parity: Equalize the Risk, Not the Dollars
The second method takes the “size by risk” idea and applies it across assets instead of through time. Risk parity builds a portfolio so that each holding contributes the same amount of risk to the whole, rather than the same number of dollars. Because bonds are much less volatile than stocks, equalizing risk means holding far more bonds by dollar weight than a conventional portfolio would — often so much more that you have to borrow to lever the whole thing up to reach a normal expected return. That leverage is not an add-on; it’s essential to the design, and it’s the seed of the failure mode.
The intellectual appeal is real and worth stating fairly. A standard 60/40 portfolio believes it’s diversified, but as the featured chart showed, ~90% of its risk is just the stock market — so 60/40 is close to an all-equity bet with a bond-shaped comfort blanket. Risk parity’s answer is: if you actually want balance, balance the risk, and use modest leverage to get the return back. The most famous implementation is Bridgewater’s “All Weather” approach, associated with Ray Dalio, which spread the idea from a niche technique into a multi-hundred-billion-dollar category [source: the risk-parity concept and Bridgewater’s All Weather fund are widely documented; see e.g. the risk-parity literature and coverage of Bridgewater’s approach — the mechanism, not any performance claim, is what’s cited here].
When it works, it’s elegant: through most of the post-2008 era, falling and low interest rates meant the big bond position was both a diversifier and a source of return, and levered risk parity did well. The design’s hidden assumption is right there in that sentence, though — it needs stocks and bonds to keep not falling together, and it needs bonds to be safe to lever.
When the Hidden Assumption Broke: 2022
2022 is the cleanest real-world stress test risk parity has faced, so it’s worth studying honestly — as history, not as a template. Inflation surged and the Federal Reserve raised rates at the fastest pace in decades, and the thing that makes risk parity elegant became the thing that hurt it: its large, levered bond position was pointed straight into the worst bond market in the index’s history, while stocks fell at the same time. The diversification the strategy is built on — stocks and bonds zigging when the other zags — simply didn’t show up, and the leverage that’s supposed to lift returns amplified the loss instead.
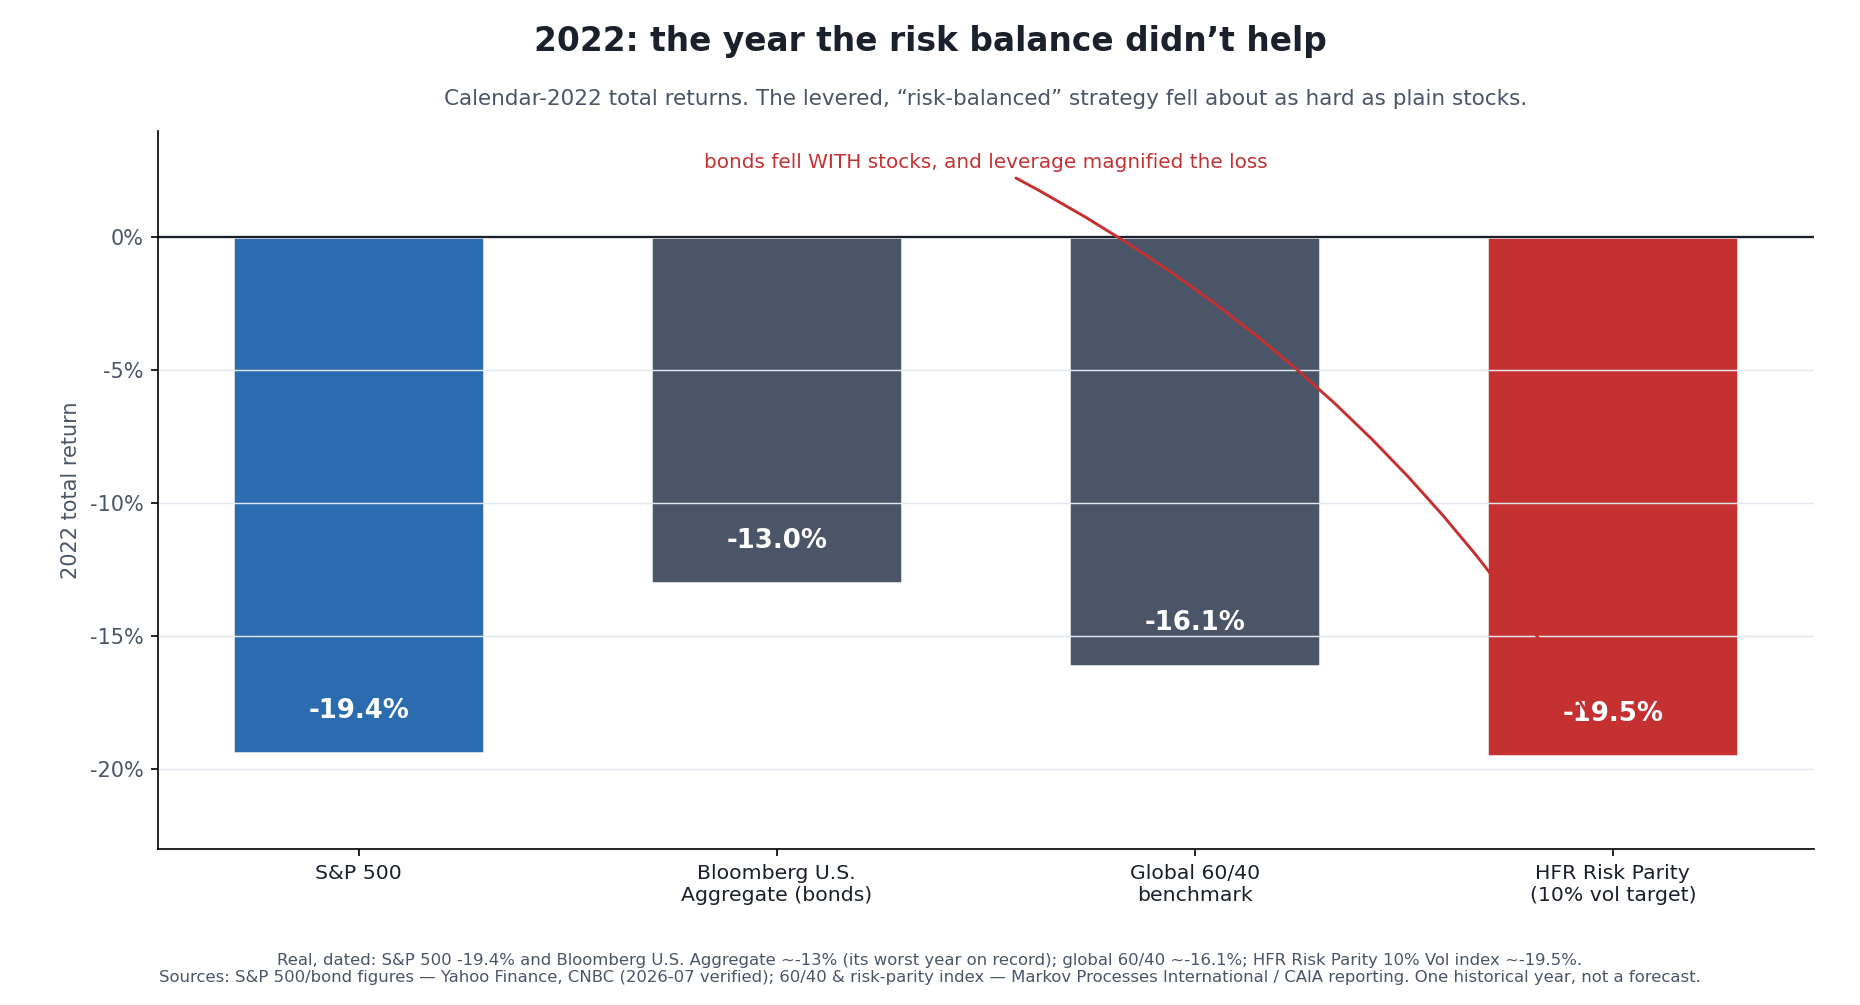
The failure mode in real numbers. In 2022 the levered, risk-balanced strategy (far right) fell about as hard as owning plain stocks — because the bonds it leans on fell alongside stocks and the leverage worked in reverse. One brutal year, shown honestly; risk parity has also had long stretches where the same design paid off. Real, dated figures; not a forecast.
The scoreboard is unkind: the HFR Risk Parity 10% Volatility index fell about 19.5% in 2022, roughly matching the S&P 500’s 19.4% decline and worse than a plain global 60/40’s 16.1% — the levered, “diversified” strategy delivered a stock-sized loss in the one year it was supposed to cushion [source: 2022 calendar returns — S&P 500 -19.4% (widely reported; e.g. Yahoo Finance, CNBC); Bloomberg U.S. Aggregate ~-13%, its worst year on record (CNBC, “2022 was the worst-ever year for U.S. bonds”); global 60/40 ~-16.1% and HFR Risk Parity 10% Vol index ~-19.5% per industry reporting, e.g. Markov Processes International / CAIA coverage]. Some specific funds did better and some far worse — the point isn’t the exact figure of any one product, it’s the structural lesson: a strategy whose diversification depends on two assets not falling together will fail exactly when they do, and leverage makes the failure bigger, not smaller.
And, to be scrupulously fair to the method: 2022 was one year, and an unusually cruel one. Risk parity had many good years before it and has had better years since, and its defenders reasonably argue that judging a long-horizon, all-weather strategy by its worst regime is its own kind of error. Both things are true. The honest read is that risk parity is a real, coherent idea with a specific, leverage-shaped tail risk — not a free lunch and not a fraud.
What Actually Scales Down to a Personal Account
Most of the institutional sizing apparatus — the leverage, the borrow desk, the daily volatility re-estimation, the risk committee — doesn’t fit in a retail account, and chasing it is a good way to hurt yourself. But the core idea scales down completely and costs nothing:
Size by risk, not by dollars, and not by conviction. Before you ask how much you believe in a trade, ask how much it would cost you if you’re wrong — the distance to your exit times the number of units — and set the size so that number is a fixed, survivable slice of your account. That single discipline is the portable heart of everything above, and it’s exactly what the position-size calculator mechanizes.
Let volatility inform size, gently, without becoming a slave to it. You don’t need a levered volatility-targeting overlay to take the one true lesson from it: a position sized for a calm market is a bigger bet than you think once the market gets loud, so trimming risk when volatility genuinely regime-shifts is reasonable — as long as you remember the pro-cyclical trap and don’t mechanically sell every panic bottom.
Treat “balanced by dollars” with suspicion. If you hold a mix of quiet and wild assets in equal dollar weights, you own the wild ones’ risk far more than the split suggests. You don’t have to run full risk parity to benefit from noticing where your risk actually comes from.
The part I had to learn the expensive way is that conviction is not information. What feels like conviction is mostly a measure of how completely one idea has taken over your own head, and that has no reliable relationship to what the position then does. Earnings season makes it obvious: a company can report genuinely good numbers and fall anyway because the outlook attached to them was uncertain. Watching that happen enough times is what stopped me treating a strong opinion as a reason to be bigger. There are traders who bet earnings from a statistical base rate, and that is a different activity with its own arithmetic. Betting the direction of a report because you are sure is not sizing at all — it is a wager wearing the costume of analysis. Sizing by what being wrong will cost is the only version that survives being wrong.
If you strip the institutional method down to one sentence, it’s this: the professionals aren’t better at predicting which positions will work — they’re more disciplined about deciding, in advance and by rule, how much each one is allowed to hurt. That part you can steal.
Where to Go Next
- How to Backtest a Trading Strategy the Right Way — the section pillar. A backtest’s return curve silently assumes a sizing rule; this is where that assumption gets made explicit.
- Position Sizing Rules for Systematic Traders — the retail-scale, rules-based version of everything here: fixed-fractional, volatility-adjusted, and why “size by risk” is the through-line.
- How Institutions Actually Manage Risk — And Which Parts You Can Steal — the governance side of the same desk: the limits and budgets that sit on top of the sizing math.
- Institutional Investing, Honestly: Size Is an Edge That Charges Rent — the flip side: why being big enough to run these strategies is itself a structural tax a small account doesn’t pay.
- Sharpe Ratio Explained — the number both volatility targeting and risk parity are ultimately trying to raise, and everything it can’t see.
If you want the plain-English, rigor-first read on how professionals actually build and size a book — with the failure modes shown, never hyped — that’s what the newsletter is for. Subscribe below.
Disclaimer: This article is educational content, not financial advice. I am not a licensed financial advisor, and nothing here is a recommendation to buy or sell any security or asset. Investing and trading involve risk, including the possible loss of the money you invest. Do your own research and consider consulting a licensed financial professional before making investment decisions. Read the full Disclaimer.
Historical and backtested results are hypothetical, carry inherent limitations, and do not guarantee future results. Figures were accurate to the best of my knowledge as of this article’s last-updated date and may have changed.
