Growth Investing Is a Bet on Duration: Why Rising Rates Hit Your Fastest Stocks Hardest
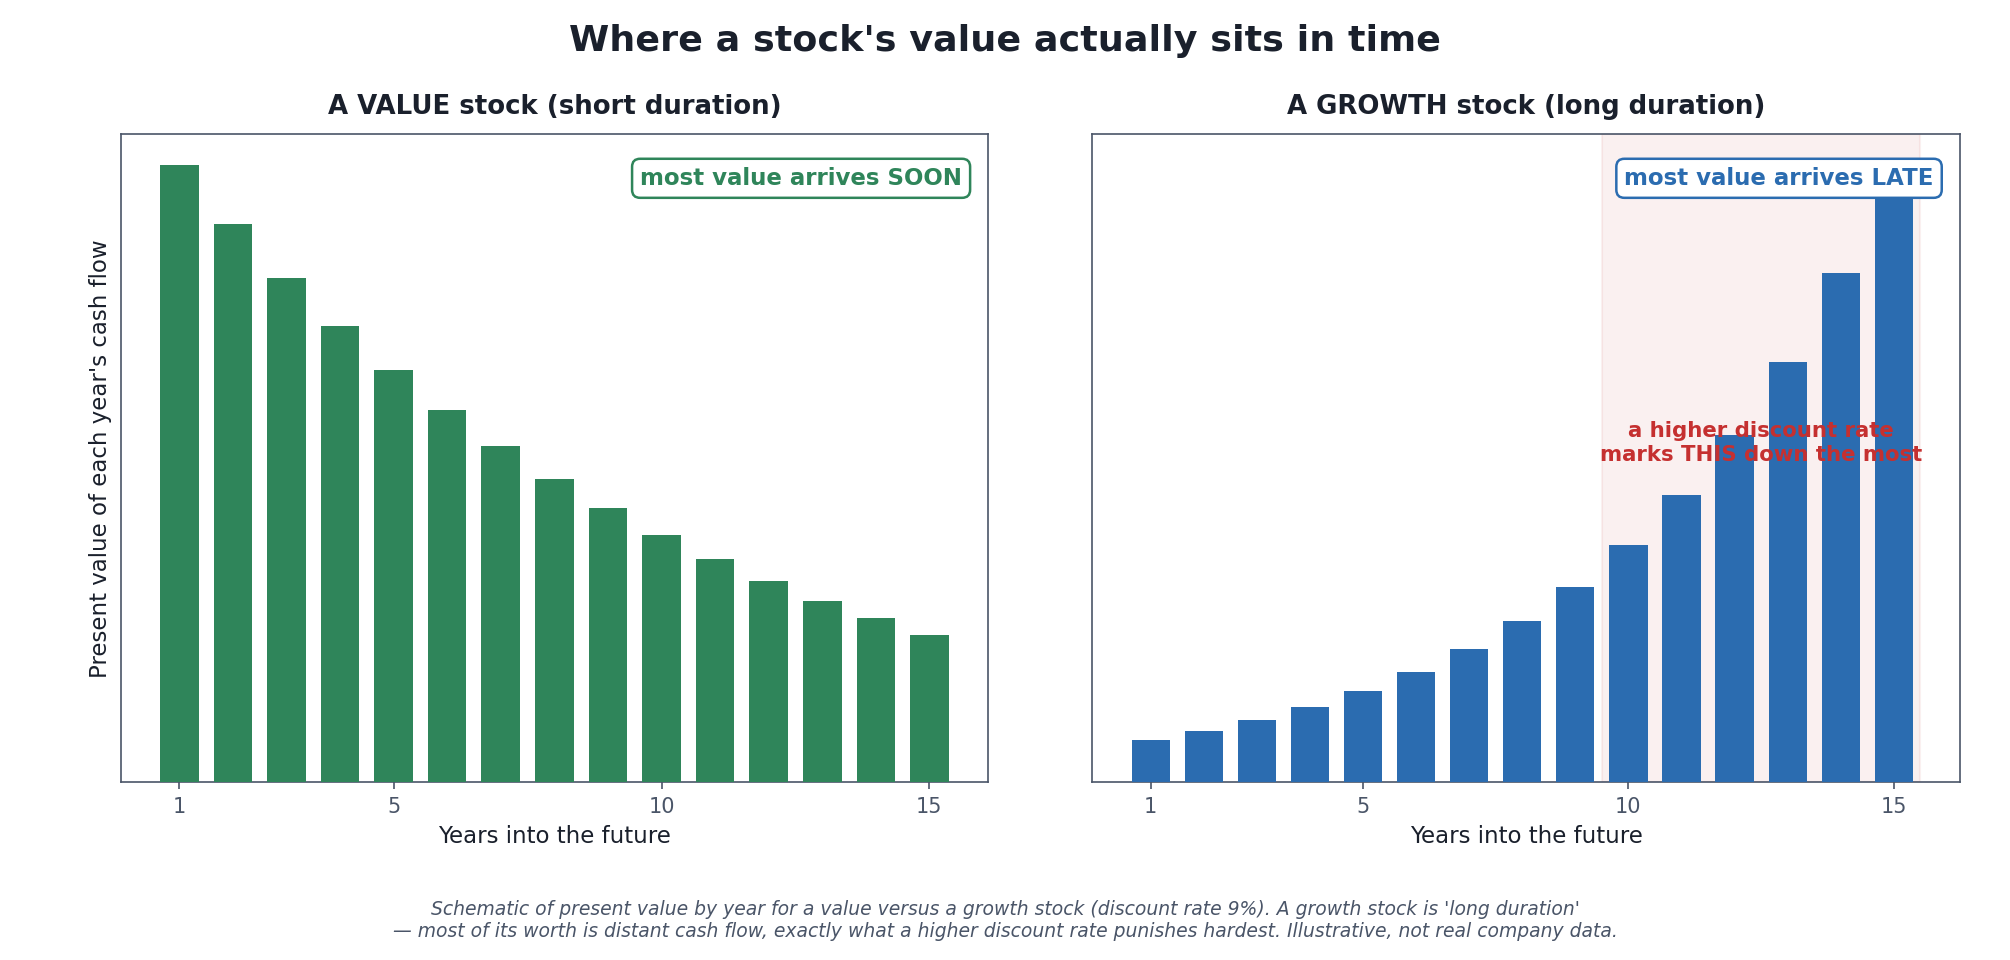
The whole article in one picture. A value stock’s worth is mostly money coming soon; a growth stock’s worth is mostly money promised far away. That single difference — not sentiment, not momentum — is why the two react so differently when interest rates move. Everything below is about what that means for the style.
Most explanations of growth investing start with personality: growth investors are optimists who bet on the future, value investors are skeptics who buy the unloved. That framing is not wrong, but it hides the mechanism that actually governs how a growth portfolio behaves — and it is a mechanism from the Money desk, not a mood. A growth stock is a long-duration asset. Its price is dominated by cash flows that are years or decades away, which makes it acutely sensitive to the one number that translates future money into present money: the discount rate. Understand that, and growth investing stops being a temperament and becomes a position with a known, nameable risk.
This is a stocks article, and the silo disclaimer governs every line: nothing here recommends growth investing, value investing, or any security. The goal is to teach the style honestly — including the specific way it hurts you — so you can decide whether it fits.
What Growth Investing Actually Is
Stripped to its mechanics, growth investing means paying a high price today relative to a company’s current earnings, sales, or book value, on the expectation that those fundamentals will expand fast enough in the future to justify the price. Index providers sort stocks into “growth” and “value” buckets using exactly these traits — high price-to-earnings and price-to-book ratios, high sales and earnings growth rates — and the funds that track them inherit the sort [source: index-provider growth/value methodology, e.g. FTSE Russell and S&P Dow Jones style indices].
The key word is future. When you buy a company trading at 40 times earnings, you are not paying for the earnings it has; you are paying for earnings it does not yet have and may never have. Financially, the value of any company is the present value of the cash it will hand shareholders over its whole life — and for a fast-growing company, almost all of that cash is scheduled for the distant future, because the near-term earnings are small relative to the price. That is what “long duration” means: your money back arrives late.
Why “Duration” Is the Right Word
Duration is a bond concept, and borrowing it here is the whole insight. A bond’s duration measures how much its price moves when rates change: a long-duration bond (one that pays you back mostly through a big payment far in the future) swings violently with rates, while a short-duration bond (one that returns your money soon) barely flinches. The reason is arithmetic. The present value of a future dollar is that dollar divided by a compounding discount factor, and the further out the dollar, the more times the discount rate compounds against it — so a change in the rate is magnified for distant cash flows and muted for near ones. This is the exact discount-rate channel the interest-rates pillar describes, applied to equities.
A stock has a duration too, even though nobody prints it on the ticker. A value stock — think a mature utility or bank paying a fat dividend now — is short duration: much of its worth is cash arriving soon. A growth stock is long duration: its worth is a promise of cash a decade out. When the discount rate rises, the growth stock’s distant cash flows are marked down far more steeply, and its price falls harder. Not because anyone panicked — because the math re-ran with a bigger denominator.
What a discount rate does to one future dollar
The paragraph above is arithmetic, so it can simply be run. Here is the present value of a single dollar promised in a given year, at three discount rates — and, in the last column, how much that dollar’s value moves for each one-point change in the rate:
| Dollar arrives in | At 2% | At 5% | At 8% | If the rate rises 1 point from 8% |
|---|---|---|---|---|
| Year 1 | $0.980 | $0.952 | $0.926 | -0.9% |
| Year 2 | $0.961 | $0.907 | $0.857 | -1.8% |
| Year 5 | $0.906 | $0.784 | $0.681 | -4.5% |
| Year 10 | $0.820 | $0.614 | $0.463 | -8.8% |
| Year 20 | $0.673 | $0.377 | $0.215 | -16.8% |
| Year 30 | $0.552 | $0.231 | $0.099 | -24.2% |
Read the last column first, because it is the whole mechanism. One point onto the discount rate costs a dollar due next year about 0.9% of its present value. The same one point costs a dollar due in thirty years 24.2% — roughly 26 times as much damage, from an identical one-point move.
The proportionality is not loose, either. The instantaneous sensitivity of a dollar due in N years is exactly N ÷ (1 + r), so on a vanishingly small move the thirty-year dollar is precisely thirty times as rate-sensitive as the one-year dollar. Over a full one-point step the realized ratio comes in a little under thirty, because the relationship curves — but the shape of the claim is exact, and the multiplier is simply the number of years you are waiting.
Two stocks at the same price, with the money arriving at different times
Now put that to work on something shaped like a stock. Below are two thirty-year cash-flow streams. One pays a level amount every year; the other starts small and grows quickly, so most of its money lands late. They are deliberately scaled so that at an 8% discount rate they cost exactly the same today. Same price, same horizon — the only difference is when the cash shows up:
| Level payer (short duration) | Fast grower (long duration) | |
|---|---|---|
| Price today at 8% | $112.58 | $112.58 |
| Macaulay duration | 10.19 years | 22.33 years |
| Share of value arriving after year 10 | 40.4% | 91.7% |
| Price change if the rate rises 1 point | -8.7% | -18.4% |
| Price change if the rate rises 2 points | -16.3% | -33.0% |
| Price change if the rate rises 3 points | -22.8% | -44.7% |
Identical price, and then the rate moves. Three points onto the discount rate takes 22.8% off the level payer and 44.7% off the fast grower — about 2.0 times the damage, from the same starting price, with no change to any forecast. Nobody revised a single cash flow. Not one of the promised dollars got smaller. The only thing that changed was the rate used to translate them into today’s money, and the grower had far more of its value parked out where that translation bites hardest: 91.7% of its worth arrives after year ten, against 40.4% for the level payer.
That is the sentence “a growth stock is a long-duration asset” converted into a number you can check. The duration figures in the table — 22.3 years against 10.2 years — are the same statistic a bond desk would quote, computed the same way, on cash flows that happen to belong to equities.
These are constructed illustrations, not measurements, and they name no company, fund, or index. No market data is used anywhere in this section. The cash-flow shapes, the 8% base rate and the rate rises are all stated assumptions; what is being demonstrated is the arithmetic of discounting, which does not depend on which stock you pick. Real equities also carry changing expectations, and in practice a rate move rarely arrives alone — this isolates the discount-rate channel precisely because the other channels are not isolatable.
Method: present value is each cash flow divided by (1 + rate) raised to its year, and duration is the present-value-weighted average time to receipt. Price changes are computed by full repricing, not by the duration approximation. The script asserts the elasticity of a single cash flow against the analytic derivative, that both streams price identically at the base rate, that the long stream falls further at every rise tested, and that the duration estimate errs on the convex side. One assertion overturned a claim this file first made — that the Macaulay-versus-modified-duration slip always outweighs the convexity error; it does so only for small moves, and the two cross over between ten and a hundred basis points.
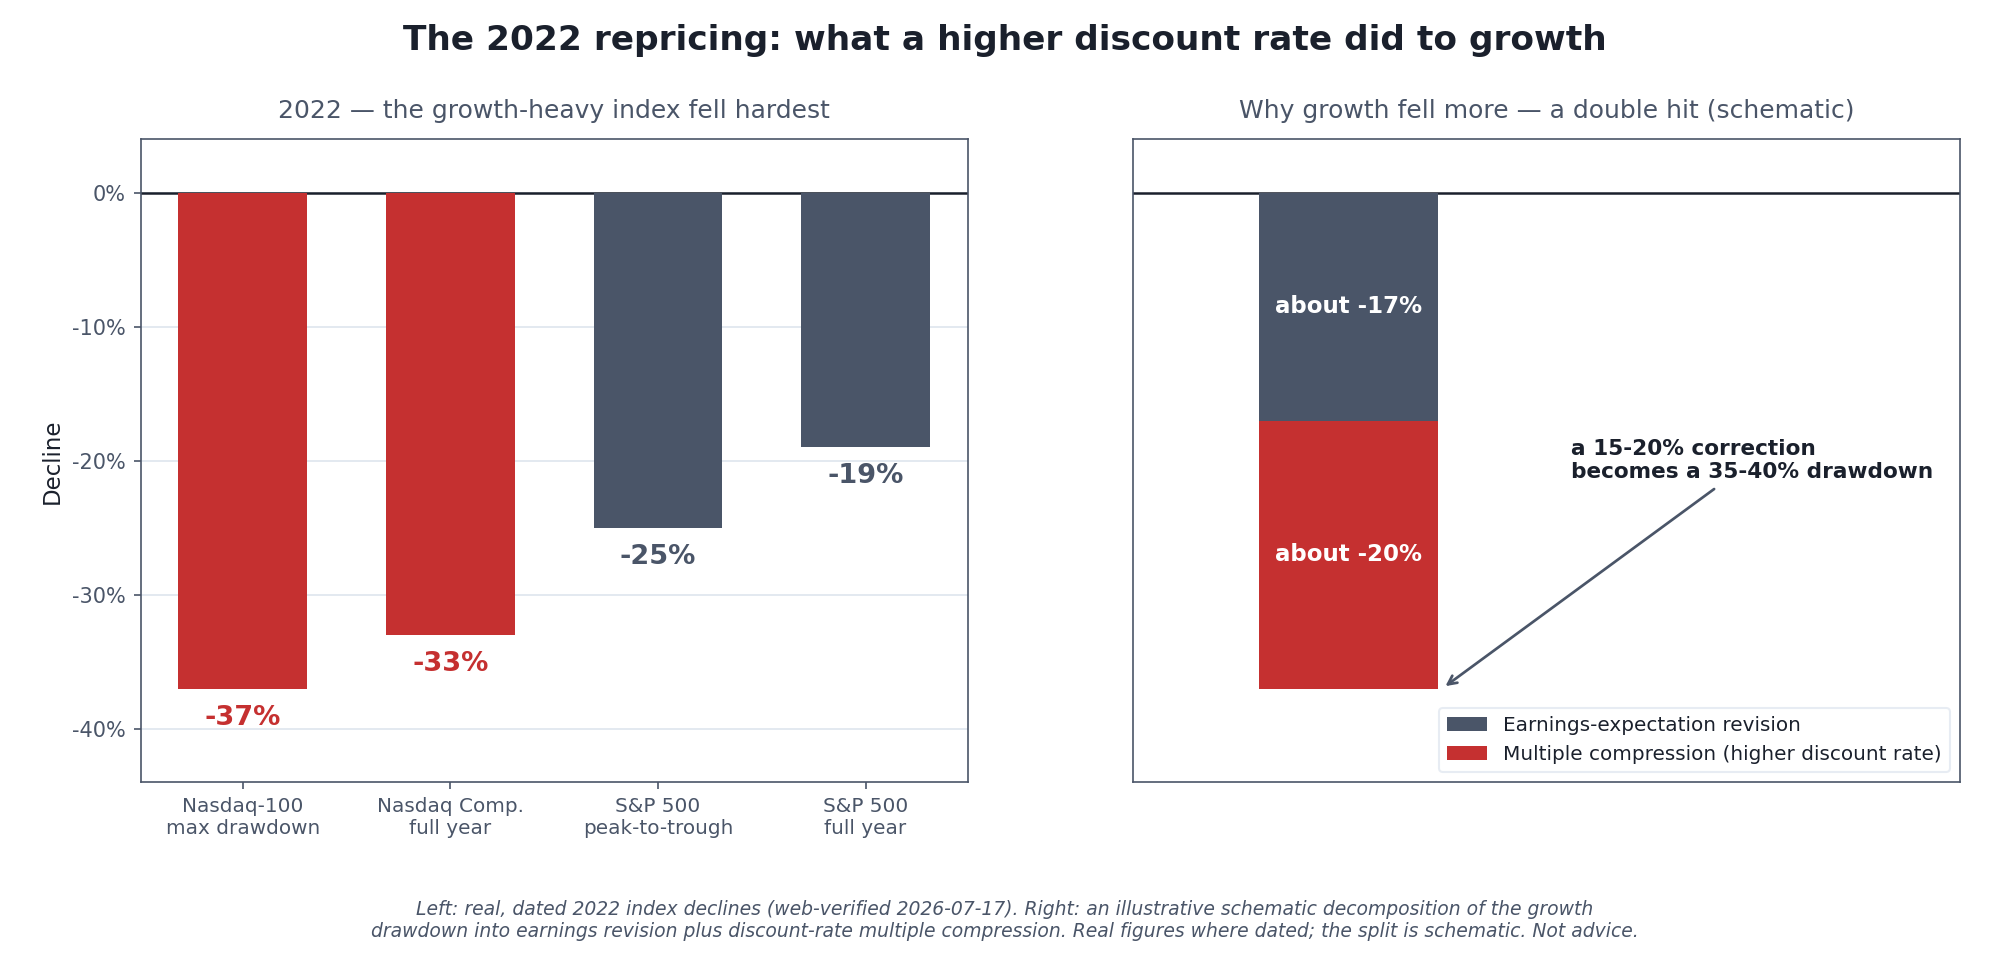
2022 was the duration lesson delivered in one year. As the discount rate rose at the fastest pace in a generation, the market re-priced every growth company’s far-off cash flows downward, and the most growth-heavy index fell the most. This is the risk the style carries by construction — not a freak event.
When Growth Works — and Why It Looked Unbeatable
If a rising discount rate is growth’s poison, a falling or low one is its rocket fuel — and the 2010s delivered a decade of exactly that. With rates pinned near zero after the 2008 crisis, the denominator that discounts distant cash flows was tiny, so long-duration growth stocks were worth enormous multiples, and they dramatically outran value. Over roughly the decade to the early 2020s, growth stocks compounded at about 14.4% a year while value managed about 9.9% — a gap of nearly five points a year, the mirror image of the long-run historical record [source: Fama-French style-return data as summarized by Dimensional and PWL Capital, 2024].
That long-run record is the humbling part. Measured over many decades, the relationship runs the other way: value stocks returned roughly 12.7% annualized versus growth’s 9.9%, the near-three-point “value premium” that Eugene Fama and Kenneth French documented and that held across 12 of 13 major international markets in their classic study [source: Fama & French, “Value versus Growth: The International Evidence,” Journal of Finance, 1998; premium figures via Dimensional/PWL Capital summaries, 2024]. Growth’s dominance in the 2010s was real, but it was a regime, and it coincided with the most growth-friendly rate environment in modern history. Reading a decade of that as proof that growth is the superior style is precisely the mistake the overfitting discipline warns against: extrapolating a pattern that a single regime produced.
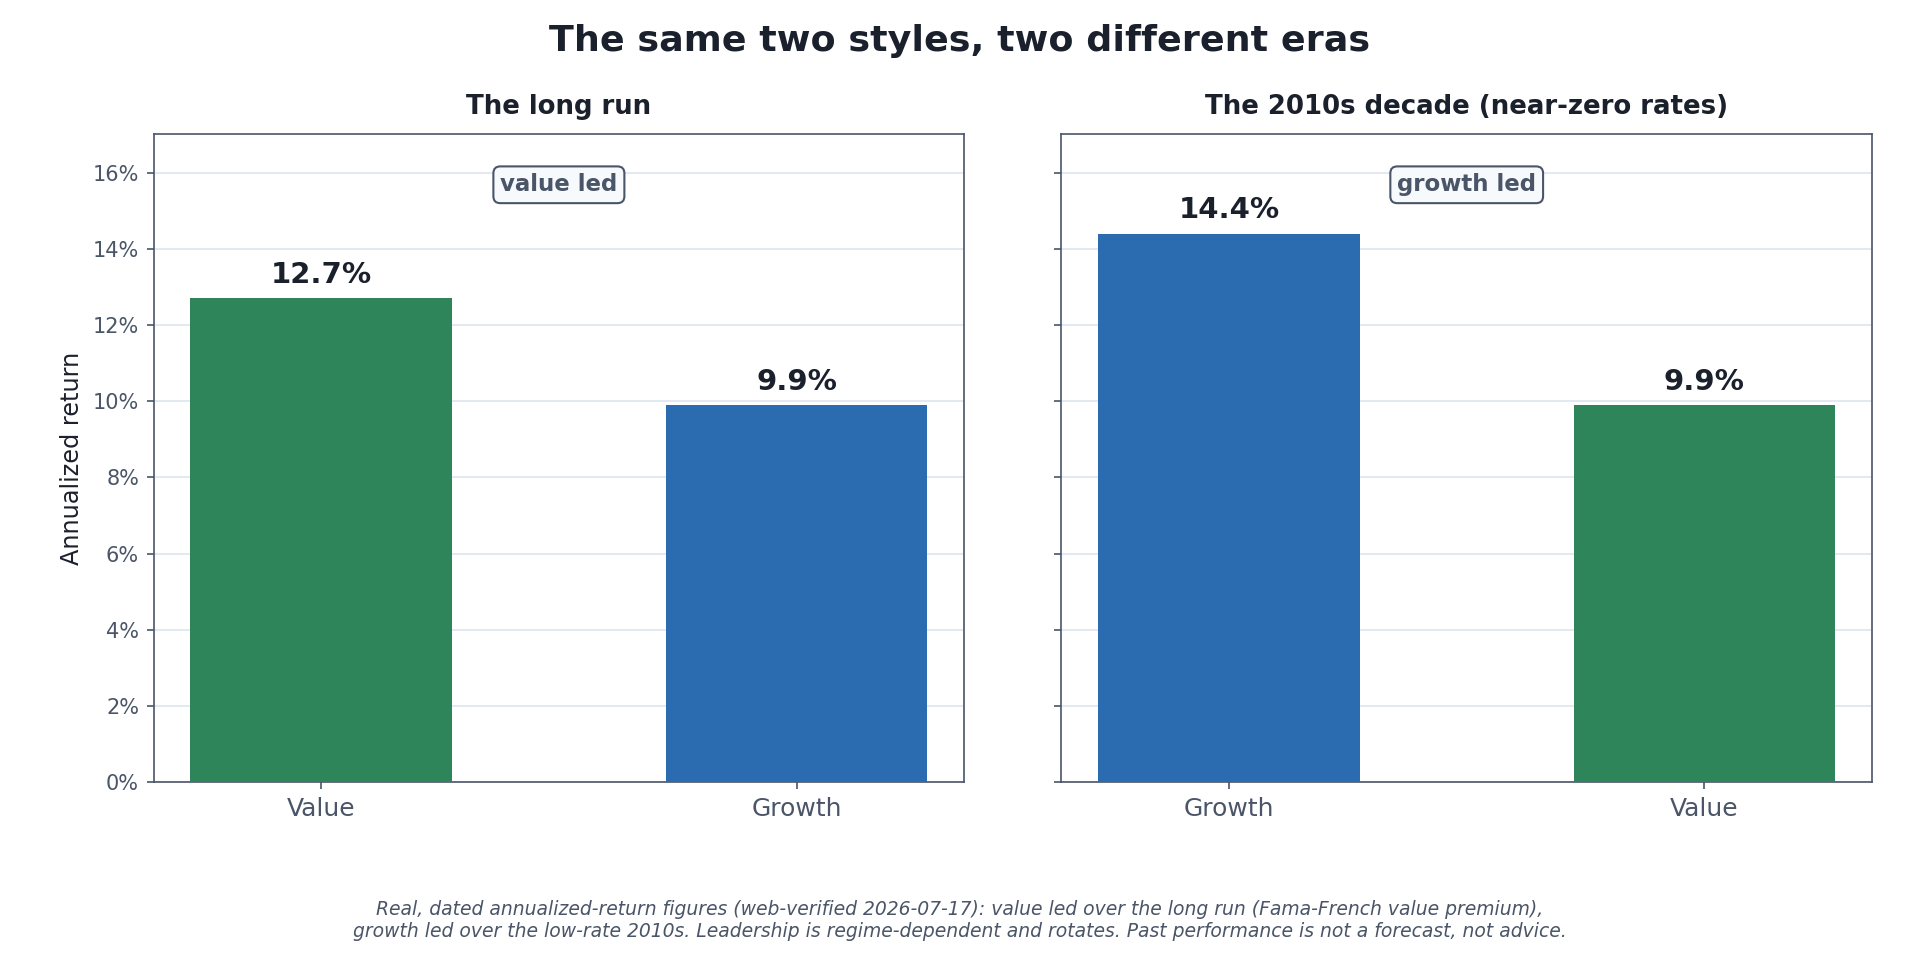
Leadership between the styles rotates, and the rotation is not random noise — it tracks, among other things, the direction of the discount rate. The decade that crowned growth was the decade rates spent near zero.
The Failure Mode Underneath: Most Growth Stocks Are Not the Winners
Duration risk is the failure mode you feel in a bad year. There is a quieter one that operates the whole time: the returns of growth investing are driven by a tiny handful of extreme winners, and most individual growth stocks do not become them.
The evidence is stark. Studying the entire CRSP universe of 25,967 US stocks from 1926 to 2016, Hendrik Bessembinder found that the median stock had a lifetime of only about seven and a half years, that fewer than half — about 42.6% — beat one-month Treasury bills over their lifetimes, and that the entire net wealth creation of the US stock market above T-bills was attributable to the best-performing 4% of companies [source: Bessembinder, “Do Stocks Outperform Treasury Bills?”, Journal of Financial Economics, 2018]. Growth investing, at the single-stock level, is an attempt to hold that thin tail of extreme winners. When it works spectacularly, it is because you held one of the few; the base rate for any given high-flyer is far less kind.
This is why the honest version of growth investing is not “pick the next winner” but a humility about your ability to. It is also why the most common way retail investors express a growth tilt — a broad growth index fund — is the defensible one: it owns the whole bucket, so it captures the few winners without requiring you to identify them in advance. The concentrated, hand-picked version asks you to win a game the data says almost everyone loses.
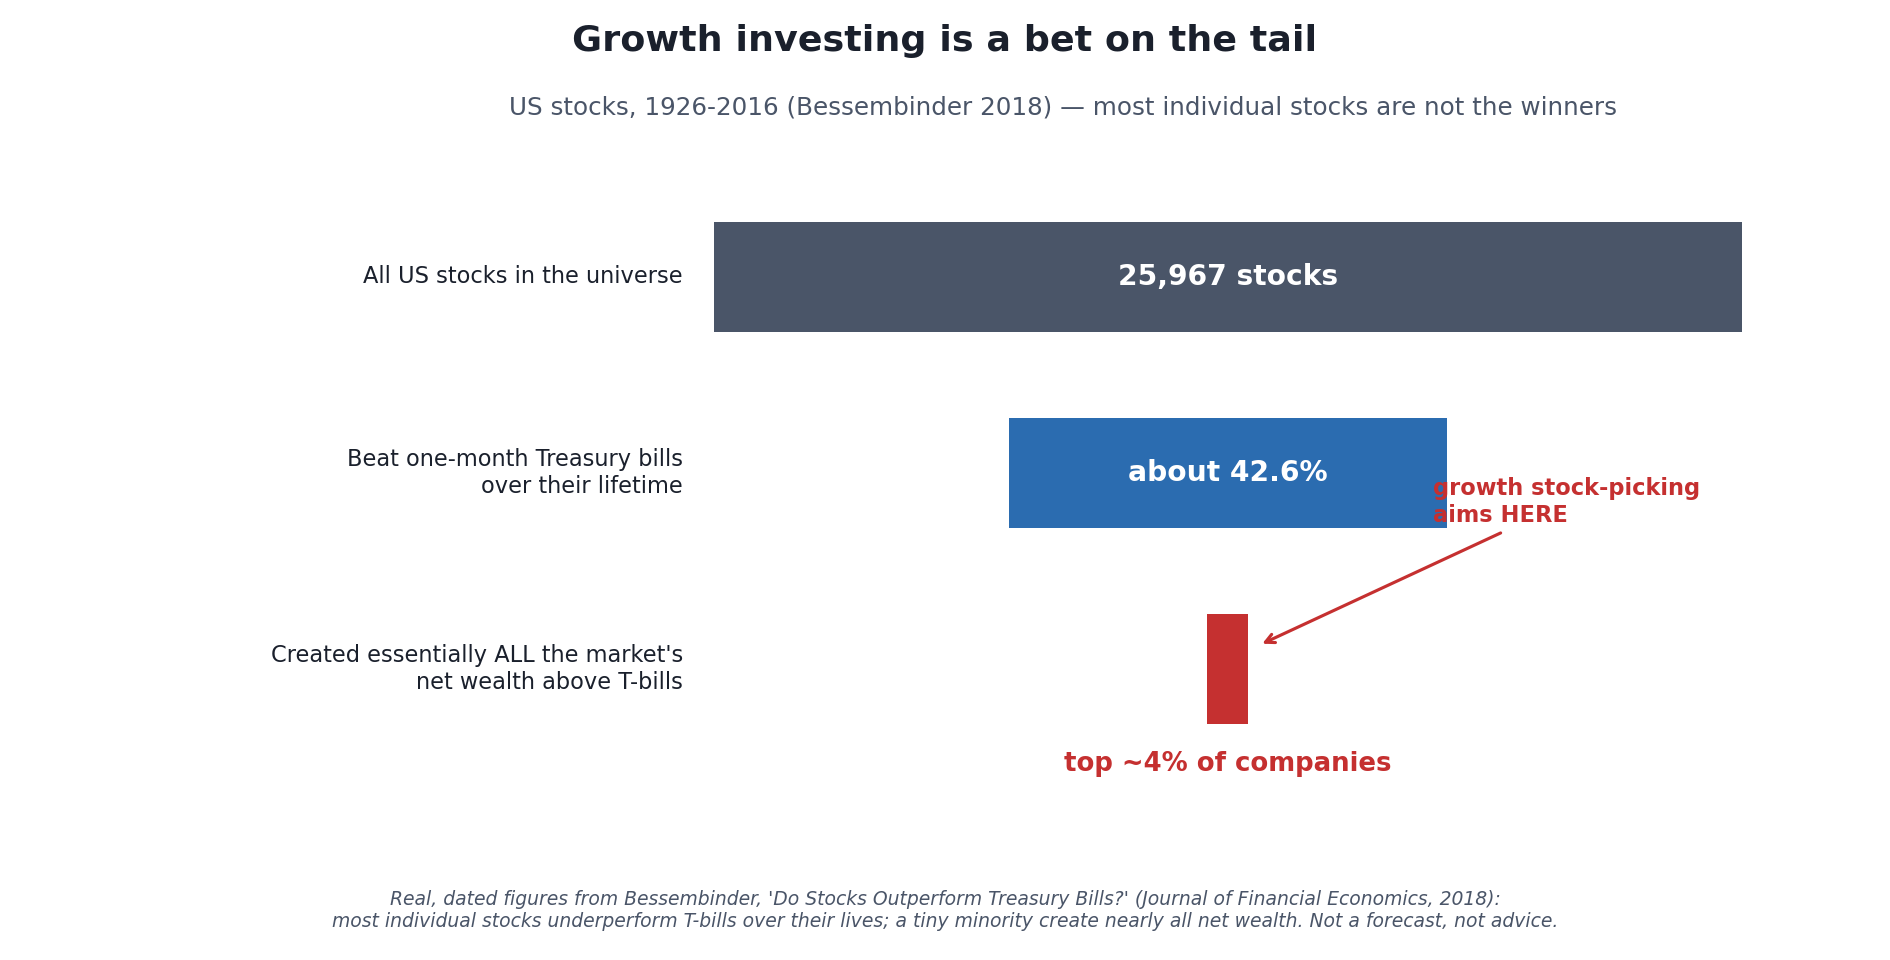
The uncomfortable arithmetic under stock-picking growth strategies. The market’s gains come from a thin sliver of extreme winners; the median stock is a disappointment. A broad growth fund sidesteps the selection problem — a concentrated bet walks straight into it.
What the Style Costs You
Every style teaches best when you say plainly what it costs, so here it is for growth, without softening:
- You carry interest-rate risk you did not choose. A growth tilt is implicitly a bet that discount rates stay low or fall. If rates rise, your portfolio is positioned to be hurt more than the market, as 2022 demonstrated — and you may have had no view on rates at all.
- You pay up front, which means less margin for error. A high multiple already prices in years of strong growth. If the company merely does well instead of spectacularly, the stock can fall even as earnings rise, because the price assumed more.
- The single-stock base rate is against you. Most growth names will not be the tail winners. Concentration amplifies both the rare triumph and the common disappointment.
- You will be tested exactly when it is hardest to hold. Growth’s worst drawdowns cluster in rate-shock periods, when every headline agrees the story is over. The style demands you hold long-duration assets through the part of the cycle built to punish them.
None of that makes growth investing a bad style. It makes it a specific style with a specific risk, best suited to an investor who has a genuinely long horizon (so the duration is a feature, not a bug), who can stomach deep drawdowns without selling at the bottom, and who expresses the tilt broadly rather than betting the outcome on a few names. Growth is not superior to value and not inferior to it. It is a different bet on the same market, and the discount rate is the referee.
If you have ever watched a portfolio of exciting, fast-growing companies fall twice as hard as the broad market in a single bad year and wondered what you did wrong, the answer may be that you did nothing wrong — you simply owned duration, and duration got repriced. Knowing that in advance is the difference between a risk you chose and one that ambushed you.
Where to Go Next
- Why Interest Rates Move Markets — the Money-core pillar on the discount-rate channel this whole article rests on.
- Growth vs Value Investing: Which Approach Fits Your Goals? — the head-to-head comparison of the two styles, if you want the value side of the ledger.
- What Is Overfitting in Backtesting — why reading one favorable decade as proof of a superior style is a trap.
- Nominal vs Real Return — because a growth stock’s distant cash flows are also the ones inflation erodes most.
If you want the plain-English, rigor-first read on styles and the mechanisms under them — explained honestly, never hyped — that is what the newsletter is for. Subscribe below.
Disclaimer: This article is educational content, not financial advice. I am not a licensed financial advisor, and nothing here is a recommendation to buy or sell any security or asset. Investing and trading involve risk, including the possible loss of the money you invest. Do your own research and consider consulting a licensed financial professional before making investment decisions. Read the full Disclaimer.
Historical and backtested results are hypothetical, carry inherent limitations, and do not guarantee future results. Figures were accurate to the best of my knowledge as of this article’s last-updated date and may have changed.
