This is a short piece with one job: two calculations about SCHD, VYM and JEPI that a yield table cannot show you. Both run on figures this site already publishes, and both are assumption-free — the unknown cancels out of each, so neither requires a forecast about markets or a guess at a share price.
What each fund is is not re-explained here, because it already exists: Dividend Investing 101 for the vocabulary, dividend growth vs high yield for the SCHD-versus-VYM choice, qualified vs ordinary dividends for the tax treatment, and expense ratios explained for why small percentages compound. The only background needed below is the one distinction that drives both results.
| Fund | Expense ratio | What produces the payout |
|---|---|---|
| SCHD | 0.06% | Company dividends, passed through |
| VYM | 0.04% | Company dividends, passed through |
| JEPI | 0.35% | Option premium, plus dividends |
Expense ratios: SCHD 0.06% [source: Schwab Asset Management, SCHD fund page, 2026 — confirm current, as expense ratios are set by the provider and can change], VYM 0.04% [source: Vanguard, VYM fund page, 2026 — confirm current on the issuer’s page before relying on the fee comparison], JEPI 0.35% [source: JPMorgan Asset Management, JEPI fund page, 2026 — confirm current; JPMorgan can revise this fee at any time]. JEPI is a covered-call fund: roughly 80% sits in low-volatility US large caps and about 20% in notes that sell short-dated out-of-the-money S&P 500 calls, and the premium from selling those options is what fills its monthly distribution [source: Seeking Alpha, “JEPI: A Look Inside,” 2026]. That is why its payout moves around, and it is the reason for the first calculation.
A Yield Quoted From One Month Can Be Nearly Double One Quoted From Another
JEPI’s monthly distribution has run as high as about $0.54 per share and as low as about $0.29 [source: 24/7 Wall St. / Yahoo Finance, “JEPI’s monthly income distribution swings,” 2026]. Annualizing a single month is how a quoted yield is often built, so it is worth seeing what that does.
| Month annualized | Implied per share, per year | Against the other month | Against their midpoint |
|---|---|---|---|
| The high month, $0.54 | $6.48 | +86.21% | +30.12% |
| The low month, $0.29 | $3.48 | −46.30% | −30.12% |
Three things fall out of that. The two months sit exactly ±30.12% around their own midpoint — an identity, not a coincidence. The share price never enters the calculation, so a yield built from the high month is 1.862× one built from the low month at any price the fund happens to trade at. And the same gap reads +86.21% going up but −46.30% going down, which is why the direction a comparison is quoted in flatters or deflates it.
The practical consequence is narrow and worth stating precisely: a headline yield built by annualizing one good month can be close to double one built from a lean month, with nothing about the fund having changed.
What the Fee Gap Is Worth, With the Market Canceled Out
An expense ratio is charged as a fraction of assets, so when you compare two funds’ ending wealth, the market’s return appears in both and cancels out entirely. The figures below therefore need no assumption about what stocks do — they hold whether the next thirty years are good or bad.
| Years held | SCHD ends ahead of JEPI by | VYM ends ahead of JEPI by | SCHD vs VYM |
|---|---|---|---|
| 10 | +2.95% | +3.15% | −0.20% |
| 20 | +5.98% | +6.41% | −0.40% |
| 30 | +9.11% | +9.77% | −0.60% |
Over thirty years the fee difference alone leaves SCHD 9.11% and VYM 9.77% ahead of JEPI in ending wealth, whatever the market delivered. VYM is the cheapest of the three, and its edge over SCHD is real but small — 0.60% over the same thirty years, roughly a fifteenth of the gap to JEPI. The compounding is reproducible in the site’s compound growth calculator.
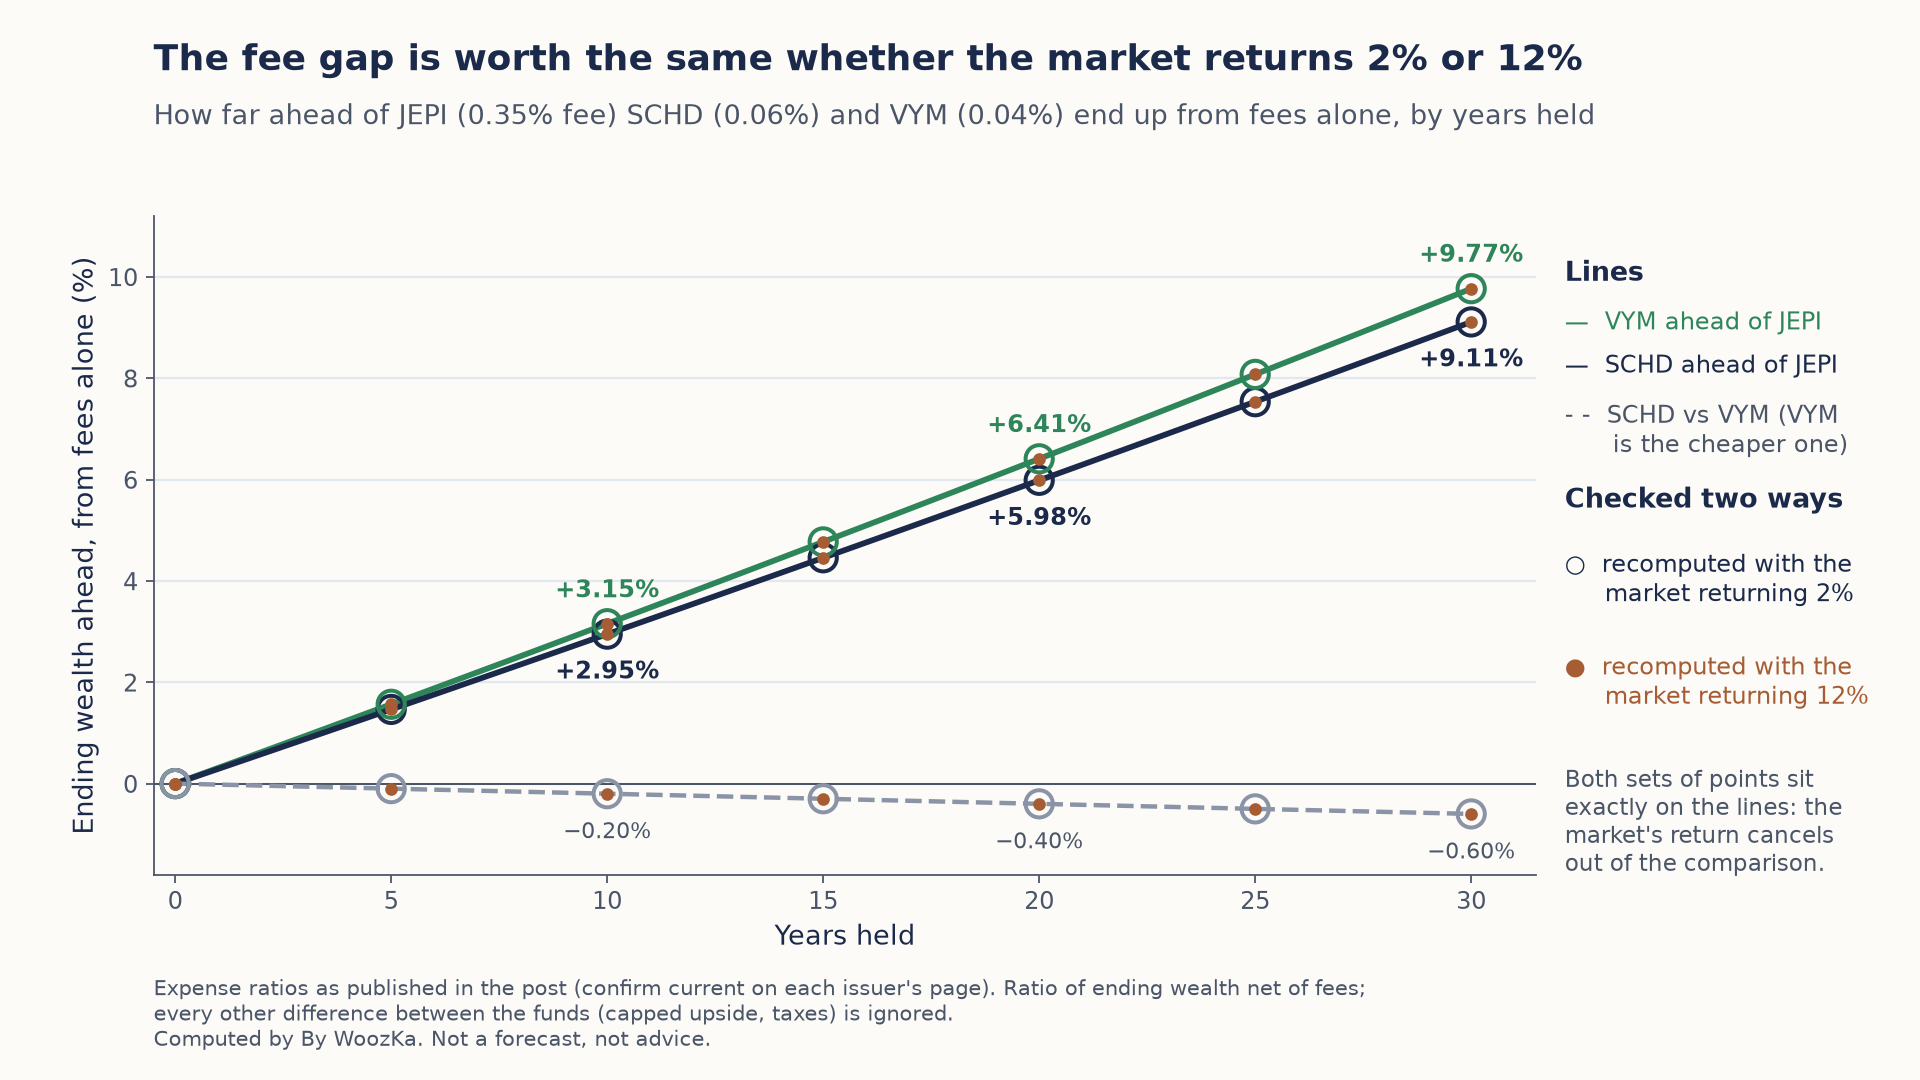
The two sets of points land on the same lines, so the fee gap is worth the same whatever the market does: about 9% of ending wealth over thirty years against JEPI, and a small 0.60% edge to VYM over SCHD.
One qualification, because it would be easy to oversell this: the fee gap is not JEPI’s largest cost. A capped upside in a strong market, and distributions taxed as ordinary income rather than at the qualified-dividend rate, can each outweigh 9% of ending wealth over thirty years. The fee is simply the one cost that can be computed without predicting anything.
Two computations, their inputs, and the limits on reading them. Every input above is a figure this site already publishes and sources — the three expense ratios, JEPI’s roughly 80/20 structure, and the $0.54 and $0.29 monthly distributions. Each figure was confirmed in code before it appeared here; the fee ratios were additionally run through the code behind this site’s compound growth calculator at gross returns of 2% and 12% and agree to nine decimal places, which is the proof that the market’s return cancels. Three limits are real. Only two months of JEPI distributions are published here, so no actual annual yield is computed anywhere — the table says what one month implies, nothing more. Expense ratios are the stated figures at the time of writing and change, so confirm them before acting. And the fee comparison deliberately ignores every other difference between these funds, which is why it is presented as the smallest of JEPI’s costs rather than the main one. Nothing above forecasts a return, recommends a fund or names an allocation.
Disclaimer: This article is educational content, not financial advice. I am not a licensed financial advisor, and nothing here is a recommendation to buy or sell any security or asset. Investing and trading involve risk, including the possible loss of the money you invest. Do your own research and consider consulting a licensed financial professional before making investment decisions. Read the full Disclaimer.
Historical and backtested results are hypothetical, carry inherent limitations, and do not guarantee future results. Figures were accurate to the best of my knowledge as of this article’s last-updated date and may have changed.
