How to Read a Crypto Whitepaper Without a CS Degree
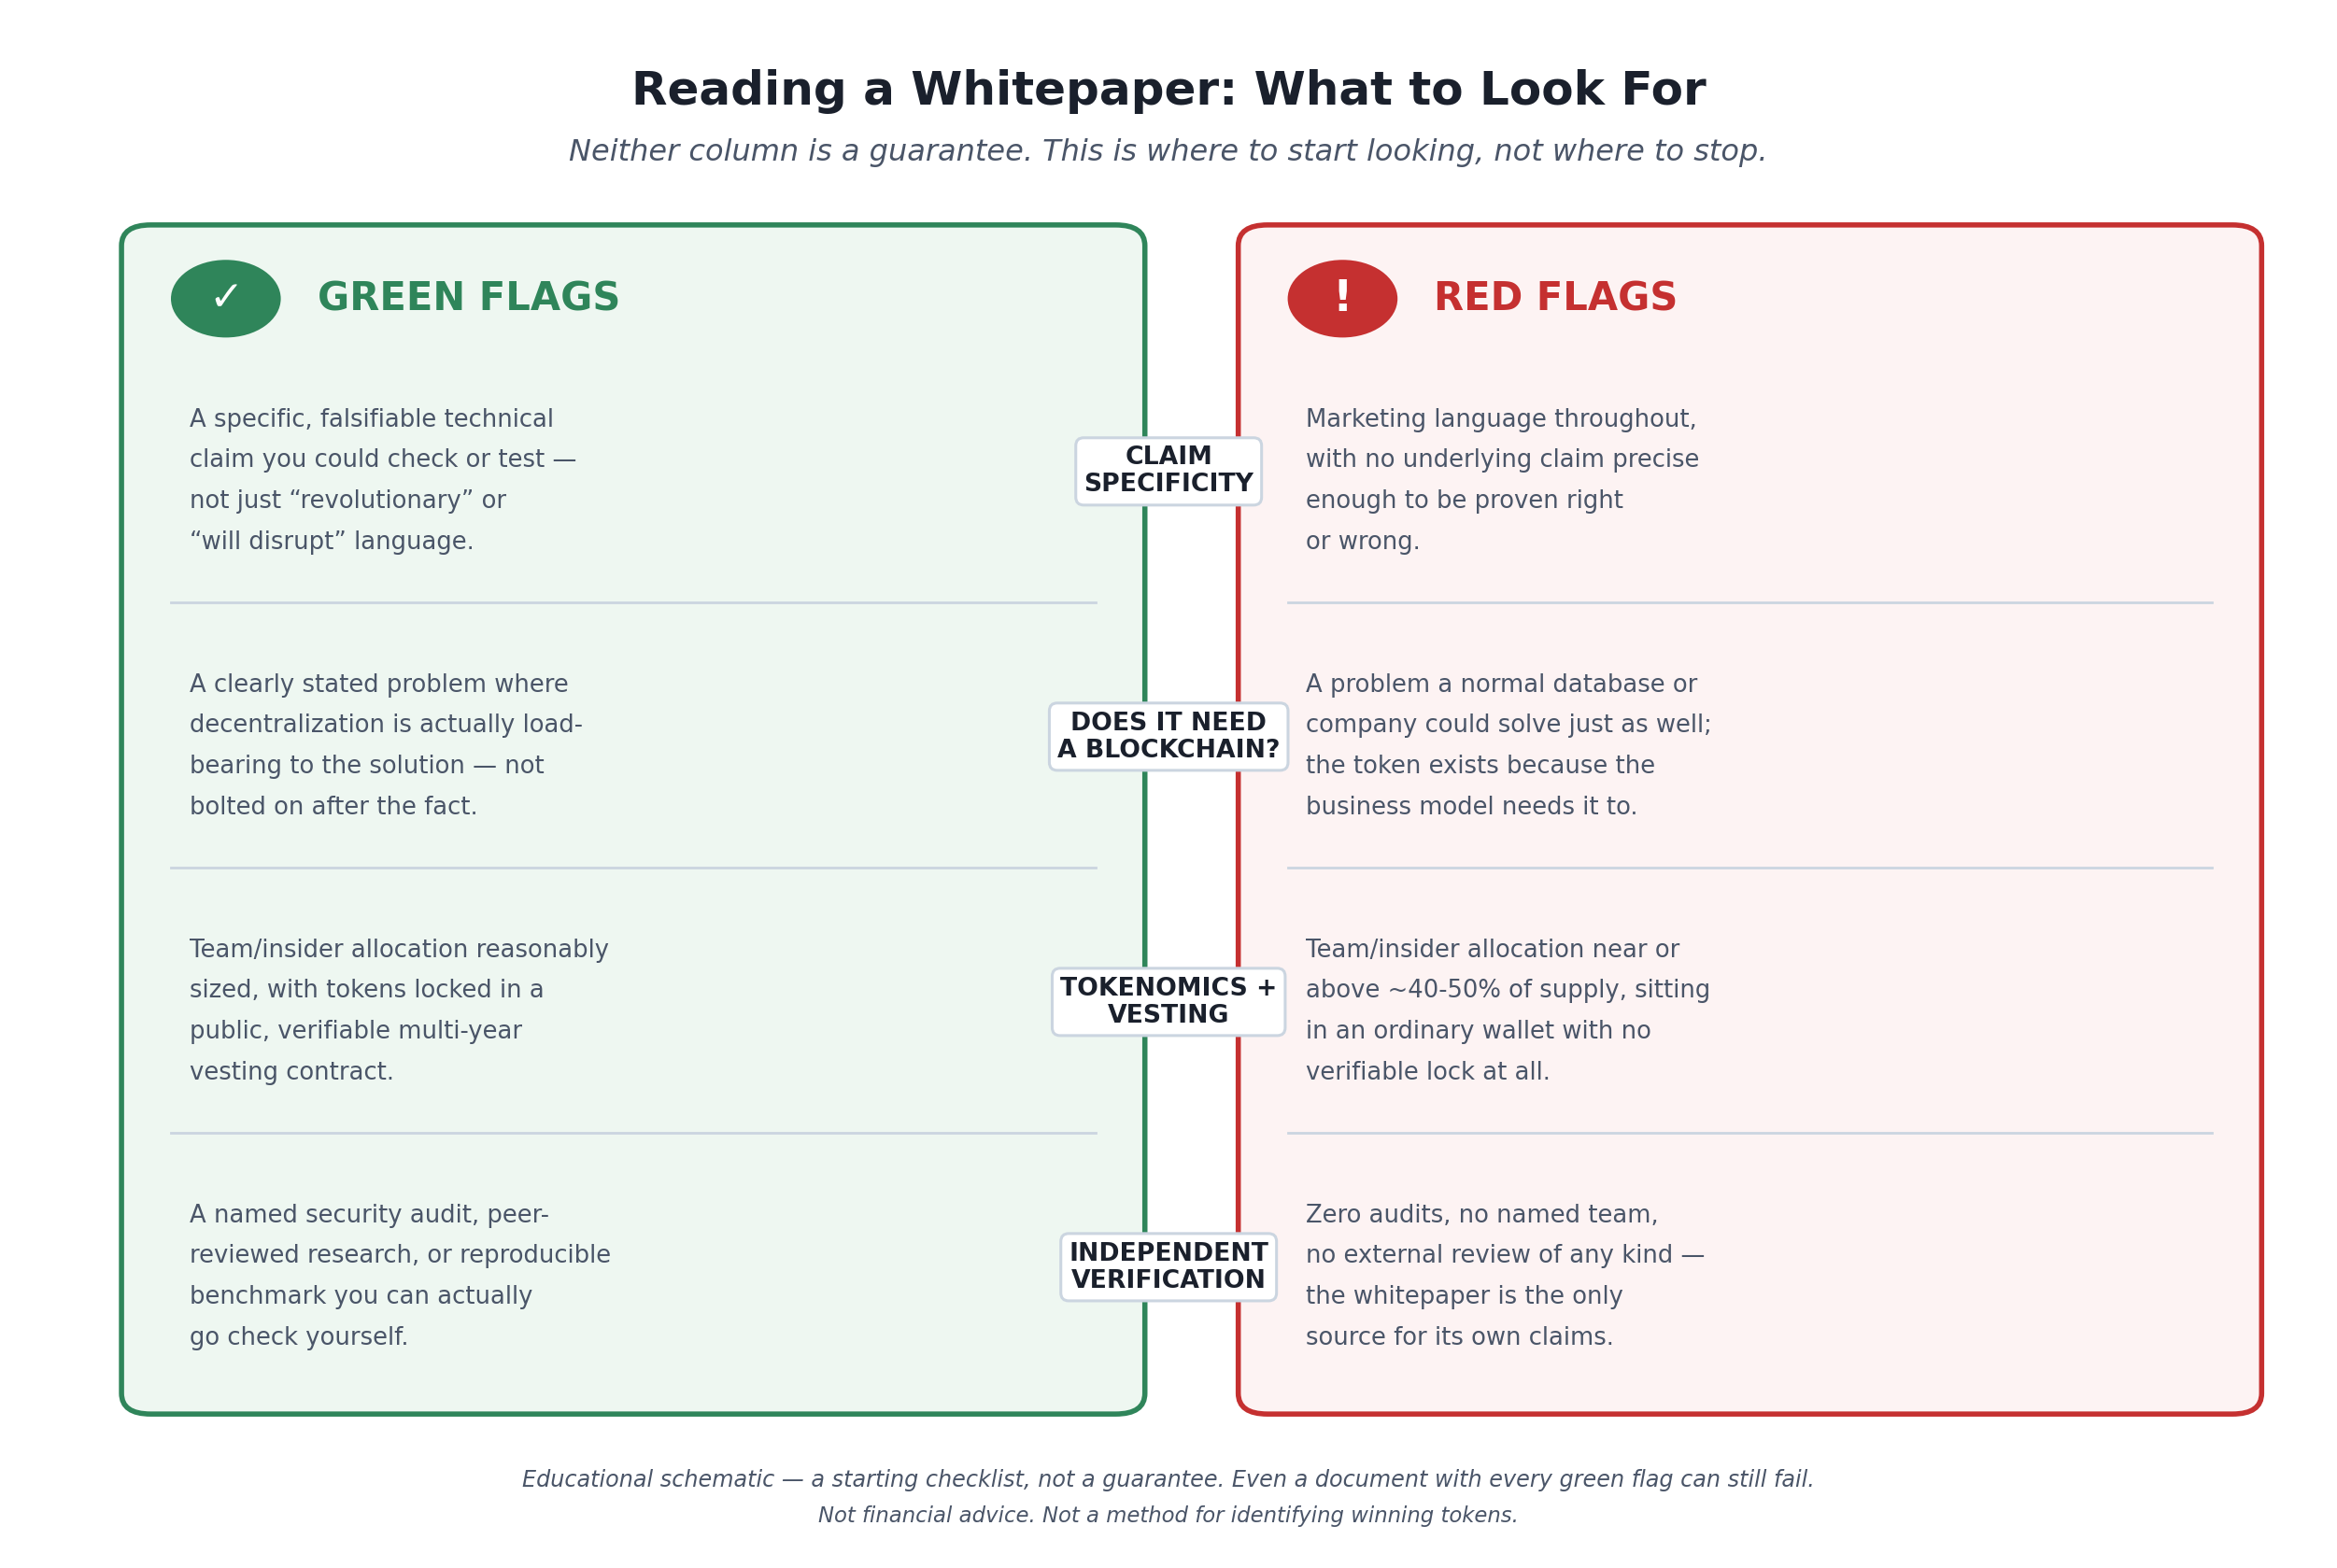
Left: what a credible whitepaper tends to show. Right: the same four categories, inverted. Neither side is a guarantee — this is where to start looking, not where to stop.
Read how to recognize where we are in a crypto market cycle or what altcoin season actually measures and you’ll notice a theme: this blog treats crypto’s popular frameworks as things to understand precisely, not vibes to absorb. The whitepaper is the most basic document in the entire space, and it’s also the one most people skip, skim, or take on faith. That’s a mistake in both directions — plenty of good projects have dense, unreadable technical documents, and plenty of scams have polished, professional-looking ones. This article is not about finding “the next 100x” by reading more carefully. It’s about risk reduction: knowing what questions a whitepaper should answer, and treating “the document can’t or won’t answer them” as information in itself.
What a Whitepaper Actually Is (and Isn’t)
The term comes from Satoshi Nakamoto’s 2008 “Bitcoin: A Peer-to-Peer Electronic Cash System” — nine pages, mostly math and protocol design, describing exactly one problem (double-spending without a trusted third party) and one mechanism (proof-of-work consensus) in falsifiable, specific terms. That document set the template, but it also set a bar almost nothing since has cleared: a whitepaper is supposed to be a technical specification, not a pitch deck.
In practice, most crypto whitepapers today sit somewhere between “genuine technical spec” and “marketing document with equations in it,” and the two are easier to tell apart than they first appear. The general rule, consistent across research guides on the topic: the simpler the content and the more colorful the design, the more marketing-oriented the document tends to be; the more academic the tone and the more precisely it engages with prior work, trade-offs, and limitations, the more likely it’s informative rather than promotional [source: CoinMarketCap Academy, “How to Read and Analyze a White Paper”]. Neither extreme is disqualifying by itself — plenty of legitimate consumer-facing projects use approachable language — but a document that is all narrative and no falsifiable mechanism is worth treating with real skepticism regardless of how professional the PDF looks.
Most whitepapers today follow a broadly similar structure: a stated problem, a proposed solution and the technology behind it, tokenomics and distribution, the team and partners, and a roadmap of milestones [source: CoinMarketCap Academy, same]. That structure is exactly the map for what to actually read for.
Four Things Worth Reading For
1. Does the problem actually need a blockchain?
Every whitepaper opens by describing a problem. The first useful question isn’t whether the problem is real — it’s whether the proposed solution genuinely requires a blockchain and a token, or whether a blockchain has been bolted onto something a normal database or a traditional company could do just as well. A surprising number of whitepapers never actually answer this, because the honest answer would undercut the reason the token needs to exist at all. If you finish the problem section and can’t articulate, in one sentence, why this specifically needs decentralization, that’s worth noting, not ignoring.
2. Tokenomics: supply, allocation, and vesting
This is the section that tells you who actually benefits and when. Three things to check specifically, cross-referenced across multiple current whitepaper-analysis guides:
- Total supply and its trajectory — fixed, inflationary, or deflationary, and what mechanism (if any) controls it. An uncapped supply with no credible burn or control mechanism is a structural inflation risk on its own, independent of anything else in the document.
- Team and insider allocation — what percentage of total supply goes to the founding team, early investors, and advisors. There’s no single hard legal threshold, but allocations climbing toward or past roughly 40–50% of supply are a widely flagged concern, especially paired with a short or nonexistent vesting period [source: general 2026 whitepaper-analysis and tokenomics-red-flag guidance, cross-referenced across multiple current guides, e.g. MEXC News, DEXTools, Be1Crypto].
- Vesting — and whether it’s actually enforced. A whitepaper claiming a multi-year vesting schedule is a claim, not a fact, until you can verify it. Legitimate projects typically lock team and investor tokens in a public, auditable smart contract that releases tokens gradually over time. If a document claims a four-year vesting schedule but the team’s tokens are sitting in an ordinary wallet with no lock, there is nothing actually stopping an immediate, full sell — the vesting claim and the on-chain reality are two different things, and only one of them is verifiable independent of what the document says.
3. Marketing language vs. a falsifiable technical claim
Learn to notice the specific difference between a sentence that describes a mechanism and one that describes a feeling. “Our consensus protocol achieves finality in under two seconds by using a delegated proof-of-stake system with 21 validator nodes” is a falsifiable technical claim — it’s specific enough to be checked, tested, or proven wrong. “Our revolutionary platform will disrupt the trillion-dollar payments industry” is not a claim about anything; it’s a mood. A whitepaper heavy on the second kind of sentence and light on the first is telling you something about how much substance is underneath the language, regardless of how the document is formatted or how many pages it runs.
4. Independent verification: audits, peer review, or neither
Ask whether any part of the project’s claims have been checked by someone with no financial stake in the outcome — a smart-contract security audit from a named firm, a peer-reviewed paper, academic collaboration, or a public, reproducible benchmark. “Audited” claims are themselves worth verifying (a linked audit report from a recognizable firm is different from a badge with no report attached), but a whitepaper with zero independent verification of any kind, self-published with no named team and no external review, is a materially different risk profile than one with any of the above — even before you’ve evaluated a single technical claim inside it.
The Tokenomics Section, Done as Arithmetic
The four questions above are qualitative by design, with one exception: the tokenomics question is not a judgment call at all. Supply, allocation and vesting are numbers, and the relationships between them are fixed — they hold for any project, any token price and any market. Yet that section names a threshold (“roughly 40–50% of supply”), names a schedule (“a four-year vesting schedule”) and never multiplies anything. It is worth doing, because the arithmetic turns out to say where the 40–50% flag comes from and what a vesting promise is actually worth. Everything below is derived from those two figures the article already publishes; every result was recomputed in code.
What an Insider Allocation Costs the People Who Pay
Insiders receive their tokens; the public buys the rest. So if insiders hold a share of total supply, the public’s money is buying only what is left over, and it is setting the price for the whole thing. Two multipliers follow immediately, and they depend on nothing but that one percentage — not on the token price, not on the supply, not on how much anyone spends.
| Insider share | Public float | Market cap per $1 paid | Insider stake per $1 paid | Step |
|---|---|---|---|---|
| 10% | 90% | $1.1111 | $0.1111 | — |
| 20% | 80% | $1.2500 | $0.2500 | +0.1389 |
| 30% | 70% | $1.4286 | $0.4286 | +0.1786 |
| 40% | 60% | $1.6667 | $0.6667 | +0.2381 |
| 50% | 50% | $2.0000 | $1.0000 | +0.3333 |
| 60% | 40% | $2.5000 | $1.5000 | +0.5000 |
The bolded pair is the band the article flags, and the arithmetic explains why that band and not some other one. At a 50% allocation the insider stake is worth exactly $1.00 for every $1.00 the public has paid in — the point at which the tokens handed out for free are worth as much as all the money that ever arrived. That crossover is not approximate; it falls precisely at 50%, because a divided by one minus a equals one only there. The bottom of the band sits at $0.6667, so moving across the article’s own ten points raises the insider stake per public dollar by 50%.
The other thing the column shows is that the cost of a further ten points is not constant. Going from 10% to 20% adds $0.1389 per public dollar; going from 50% to 60% adds $0.5000 — exactly 3.6 times as much. Allocation percentages are usually read as if they were on a linear scale. They are not, and the steepening happens right where the article draws its line.
A Four-Year Schedule Moves When, Never How Much
The article’s worked example is a four-year vest. Vesting schedules ordinarily open with a cliff — a first date on which everything accrued so far is released at once — but the article does not say how long that cliff runs, and neither does this analysis. It is swept below rather than assumed. The allocation is held at 40%, the bottom of the flagged band, and the cliff releases the amount accrued to that date, with the remainder released evenly through month 48.
| Cliff | Released on that day | Float after | One-day float rise | Total by month 48 |
|---|---|---|---|---|
| none | 0.00% | 60.00% | 0.000% | 40% |
| 6 months | 5.00% | 65.00% | 8.333% | 40% |
| 12 months | 10.00% | 70.00% | 16.667% | 40% |
| 18 months | 15.00% | 75.00% | 25.000% | 40% |
| 24 months | 20.00% | 80.00% | 33.333% | 40% |
The last column never moves, and that is the first result: a vesting schedule reschedules an allocation, it does not shrink one. Whatever the cliff, 40% of supply has reached the market by month 48. A reader who treats a long vest as a smaller allocation has misread it.
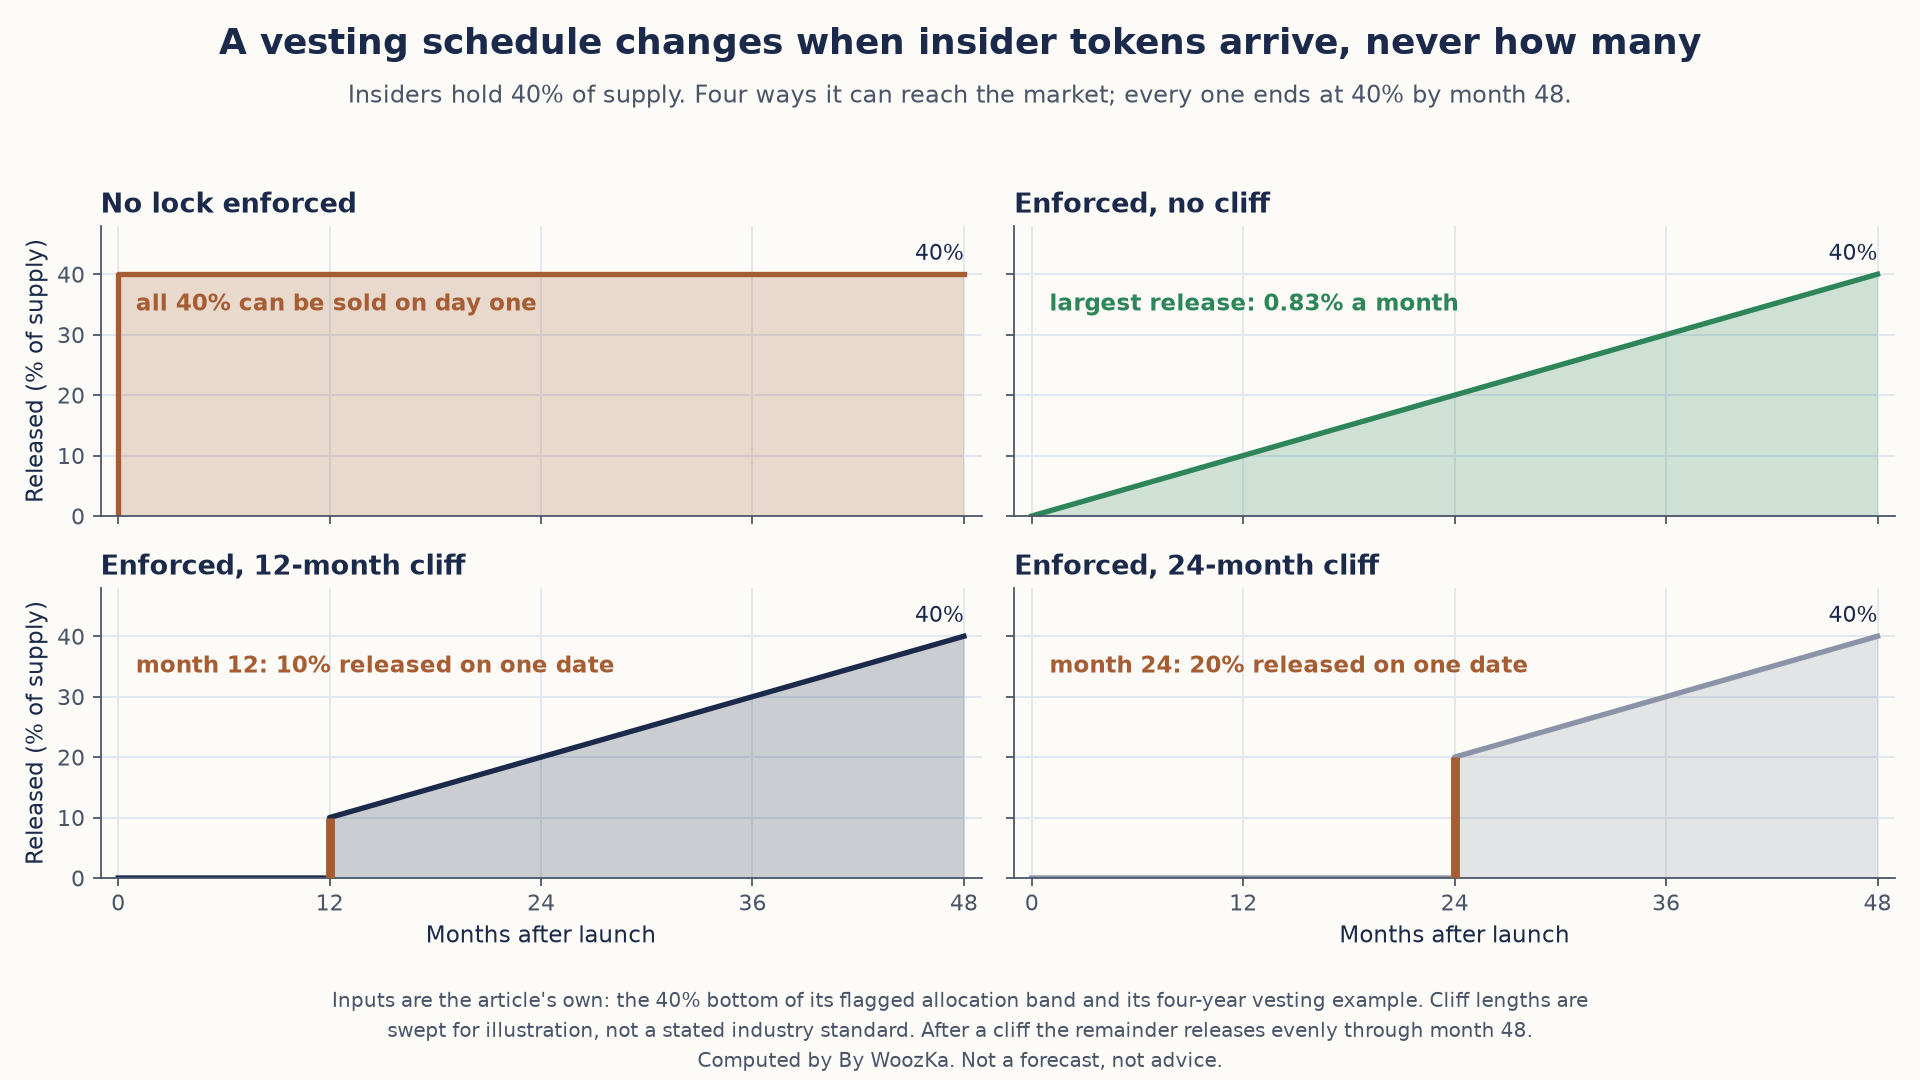
All four paths deliver the same 40% of supply by month 48; the schedule only decides when. A cliff concentrates as many months of supply as it lasted onto one date, and with no lock the whole allocation can arrive at once.
The second result is hiding in the middle columns. After the cliff, the monthly release is the allocation divided by the vest length — 0.8333% of total supply per month — and that rate is identical in every row, because the cliff shortens the remaining schedule by exactly as much as it shortens the remaining tokens. So the cliff day can be measured in ordinary months, and the answer is startlingly plain: the cliff releases exactly as much supply as the number of months it ran. A twelve-month cliff is one date carrying twelve months of supply. That identity was verified at allocations of 5%, 40%, 50% and 77%; it depends on neither.
What Enforcement Is Worth, in a Single Number
The article’s sharpest tokenomics point is that a vesting schedule in a document is a claim rather than a fact, and that tokens sitting in an ordinary wallet can be sold in full at any moment. That gap has a size. Compare the worst single day under an enforced schedule — the cliff — against the worst single day when nothing is locked, which is the entire allocation arriving at once.
| Cliff | Worst day, lock enforced | Worst day, no lock | Enforcement is worth |
|---|---|---|---|
| 6 months | 8.333% | 66.667% | 8.00× |
| 12 months | 16.667% | 66.667% | 4.00× |
| 18 months | 25.000% | 66.667% | 2.67× |
| 24 months | 33.333% | 66.667% | 2.00× |
The final column is the vest length divided by the cliff length and nothing else. Forty-eight months over a twelve-month cliff is 4.00, and that figure holds whatever the allocation is — checked across 380 combinations spanning allocations from 1% to 95%. Three things follow, and they are worth separating:
- Verifying that a lock exists on-chain is worth a specific, knowable multiple, so the check the article recommends can be priced rather than merely urged.
- The multiple gets smaller as the cliff gets longer, which is the opposite of the intuition that a longer cliff is straightforwardly safer — a longer cliff concentrates more supply into its one date.
- None of this says anything about whether a given lock is real. It says what is at stake in finding out.
One last figure ties the three tables together. Because the float grows from one minus the allocation to the whole supply, the price has to rise by the same multiplier from the first table just to leave market capitalization where it started: +66.67% at a 40% allocation, and exactly +100% at 50%. The ten points across the article’s own band add 33.33 points to that requirement, and its upper end demands precisely a doubling. That is an accounting identity, not a forecast — market capitalization is price times circulating supply, so if one side grows the other must, or the total falls.
Method and limits, so this can be checked rather than taken on trust. Every figure above was computed in code that checks each result before reporting it, using exact fractions rather than decimals so the identities are provable rather than approximately true. The two inputs are the article’s own: the 40–50% allocation band it flags and the four-year vesting schedule it describes. The cliff length is not the article’s and is not asserted here to be any industry standard — it is swept across five values precisely because this analysis has no basis for naming one, and the twelve-month row is bolded for legibility, not because it is recommended or typical. The linear-after-cliff convention is stated so a different schedule can be substituted; a front-loaded or back-loaded release changes the middle table and leaves the first and third untouched. Everything here concerns supply, which is one input to a price and not the only one: no result above predicts, or attempts to predict, what any token is worth. Post 230 publishes cited figures rather than derived ones, so there was no existing arithmetic in it to recompute. No shipped calculator on this site computes token supply schedules, allocation or vesting, so none is linked here. Nothing above is a forecast, and no token, purchase or allocation is recommended anywhere in it.
Two Real, Dated Cases — For Two Different Reasons
Neither of the cases below is a “gotcha” list of scam projects to memorize. They’re included because each illustrates a different failure mode this reading discipline is built to catch, and using real, documented events is more useful than an abstract description.
Terra/LUNA (collapsed May 2022) — a detailed whitepaper whose core mechanism itself failed. Terra’s whitepaper was not thin marketing copy — it described a specific, falsifiable technical mechanism: its UST stablecoin’s dollar peg was maintained not by holding dollar reserves (the way most stablecoins work) but by an arbitrage relationship with a second token, LUNA, which was designed to absorb UST’s volatility [source: Terra whitepaper, as summarized in academic post-mortems]. That mechanism was specific and testable — and it failed under stress. Within about a week in May 2022, LUNA fell from roughly $87 to a fraction of a cent and UST lost its dollar peg entirely, erasing over $40 billion in value [source: multiple academic post-mortems, including a Federal Reserve working paper and peer-reviewed finance-journal analyses of the collapse]. The lesson isn’t “avoid stablecoins” — it’s that a whitepaper describing its mechanism in precise, falsifiable detail is necessary but not sufficient; the mechanism itself still has to hold up under real market stress, and a well-written document can’t guarantee that it will.
Squid Game token (SQUID, November 2021) — a whitepaper describing a product that never existed. SQUID’s whitepaper described a play-to-earn gaming platform tied to the Netflix show’s popularity — a platform that never materialized. The project had no actual affiliation with the Squid Game intellectual property, the surrounding materials contained numerous grammatical errors, the team was anonymous with no verifiable track record, and social media comments were disabled specifically to prevent warnings from reaching new buyers. Underneath the marketing sat a malicious smart contract that let people buy the token freely but blocked them from selling it — manufacturing an appearance of only-ever-rising demand until the developers drained roughly $3.4 million from the liquidity pool and disappeared; the token’s price collapsed from a peak above $2,860 to a fraction of a cent within seconds [source: multiple contemporaneous reporting and blockchain-forensics case studies of the SQUID rug pull]. Here, the red flags were almost all present and checkable before the collapse: no real product, no verifiable team, no audit, and marketing riding on a borrowed brand with no license to use it.
Read together, the two cases make the article’s core point concrete: Terra had a real, specific, falsifiable claim that turned out to be wrong under stress; Squid Game never had a real claim to begin with. Reading a whitepaper carefully catches the second kind of problem far more reliably than the first — no amount of document literacy can fully substitute for the fact that even a specific, well-engineered mechanism can still fail.
Why This Literacy Matters More Than Ever Right Now
Token launches without any credible underlying project remain a large and current problem, not a historical one. Industry tracking puts rug pulls and related exit scams at billions of dollars in losses across 2025, with one widely cited estimate putting the figure near $2.8 billion for the year in rug pulls specifically — a number heavily concentrated in a small number of large incidents, so treat the total as directional rather than a precise, evenly distributed figure [source: 2025–2026 crypto-fraud tracking and analytics reporting, cross-referenced across multiple current industry sources]. Separately, multiple 2025 analyses of newly launched meme coins — a category that frequently ships with no real whitepaper at all, just a name, a logo, and a social media push — found the majority flagged as likely rug pulls within 30 days of launch [source: same tracking, cross-referenced]. The complete absence of a real whitepaper is itself one of the clearest red flags this article covers — it isn’t a document to read critically if it doesn’t exist in the first place.
What This Reading Discipline Doesn’t Do
It doesn’t identify winners. Reading a whitepaper well tells you whether a project is being honest and specific about what it claims to do and who benefits from its token — it does not tell you whether the underlying technology will find adoption, whether the team will execute, or whether the price will go up. Terra’s case is the clearest illustration available: a specific, falsifiable, well-documented mechanism still failed. Treat this as risk reduction and literacy, the same posture this entire silo takes toward every framework it covers — never as an edge for picking “the next” anything. The practical companion to this skill, same as everywhere else in this cluster, is position sizing: however carefully you’ve read the document, size any position so that being wrong about it — for any reason, document-related or not — doesn’t threaten your financial plan.
Anyone who has spent time actually opening whitepapers before buying something small has felt the same two-sided trap: some genuinely important projects have dense, jargon-heavy documents that are easy to give up on halfway through, while some of the worst projects have the most polished-looking PDFs in the space. The four questions above exist precisely because “how professional does this look” and “how honest and specific is this” turn out to be almost unrelated things.
Where to Go Next
- Common Crypto Scams and How to Spot Them Before You Lose Money — this article is “how to read the document”; that one is “how the scam patterns work” once money is actually being requested. Read both.
- DeFi Explained: What Decentralized Finance Actually Means — token-mechanics and protocol vocabulary that shows up constantly in whitepapers.
- How to Buy Your First Bitcoin Safely: A Step-by-Step Guide — the pillar this whole silo builds on: risk management first, project narratives last.
- Crypto Position Sizing: How Much of Your Portfolio Should Be Crypto? — the practical answer to “I’ve read the document carefully — now what?”
- Crypto Market Cycles: How to Recognize Where We Are — the cluster anchor, for the same no-hype, definition-first posture applied to market-wide narratives instead of individual projects.
If you want markets explained plainly — risk-first, never hyped, no price targets — that’s what the newsletter is for. Subscribe below.
Disclaimer: This article is educational content, not financial advice. I am not a licensed financial advisor, and nothing here is a recommendation to buy or sell any security or asset. Investing and trading involve risk, including the possible loss of the money you invest. Do your own research and consider consulting a licensed financial professional before making investment decisions. Read the full Disclaimer.
Historical and backtested results are hypothetical, carry inherent limitations, and do not guarantee future results. Figures were accurate to the best of my knowledge as of this article’s last-updated date and may have changed.
