Altcoin Season Explained: Signal or Noise?
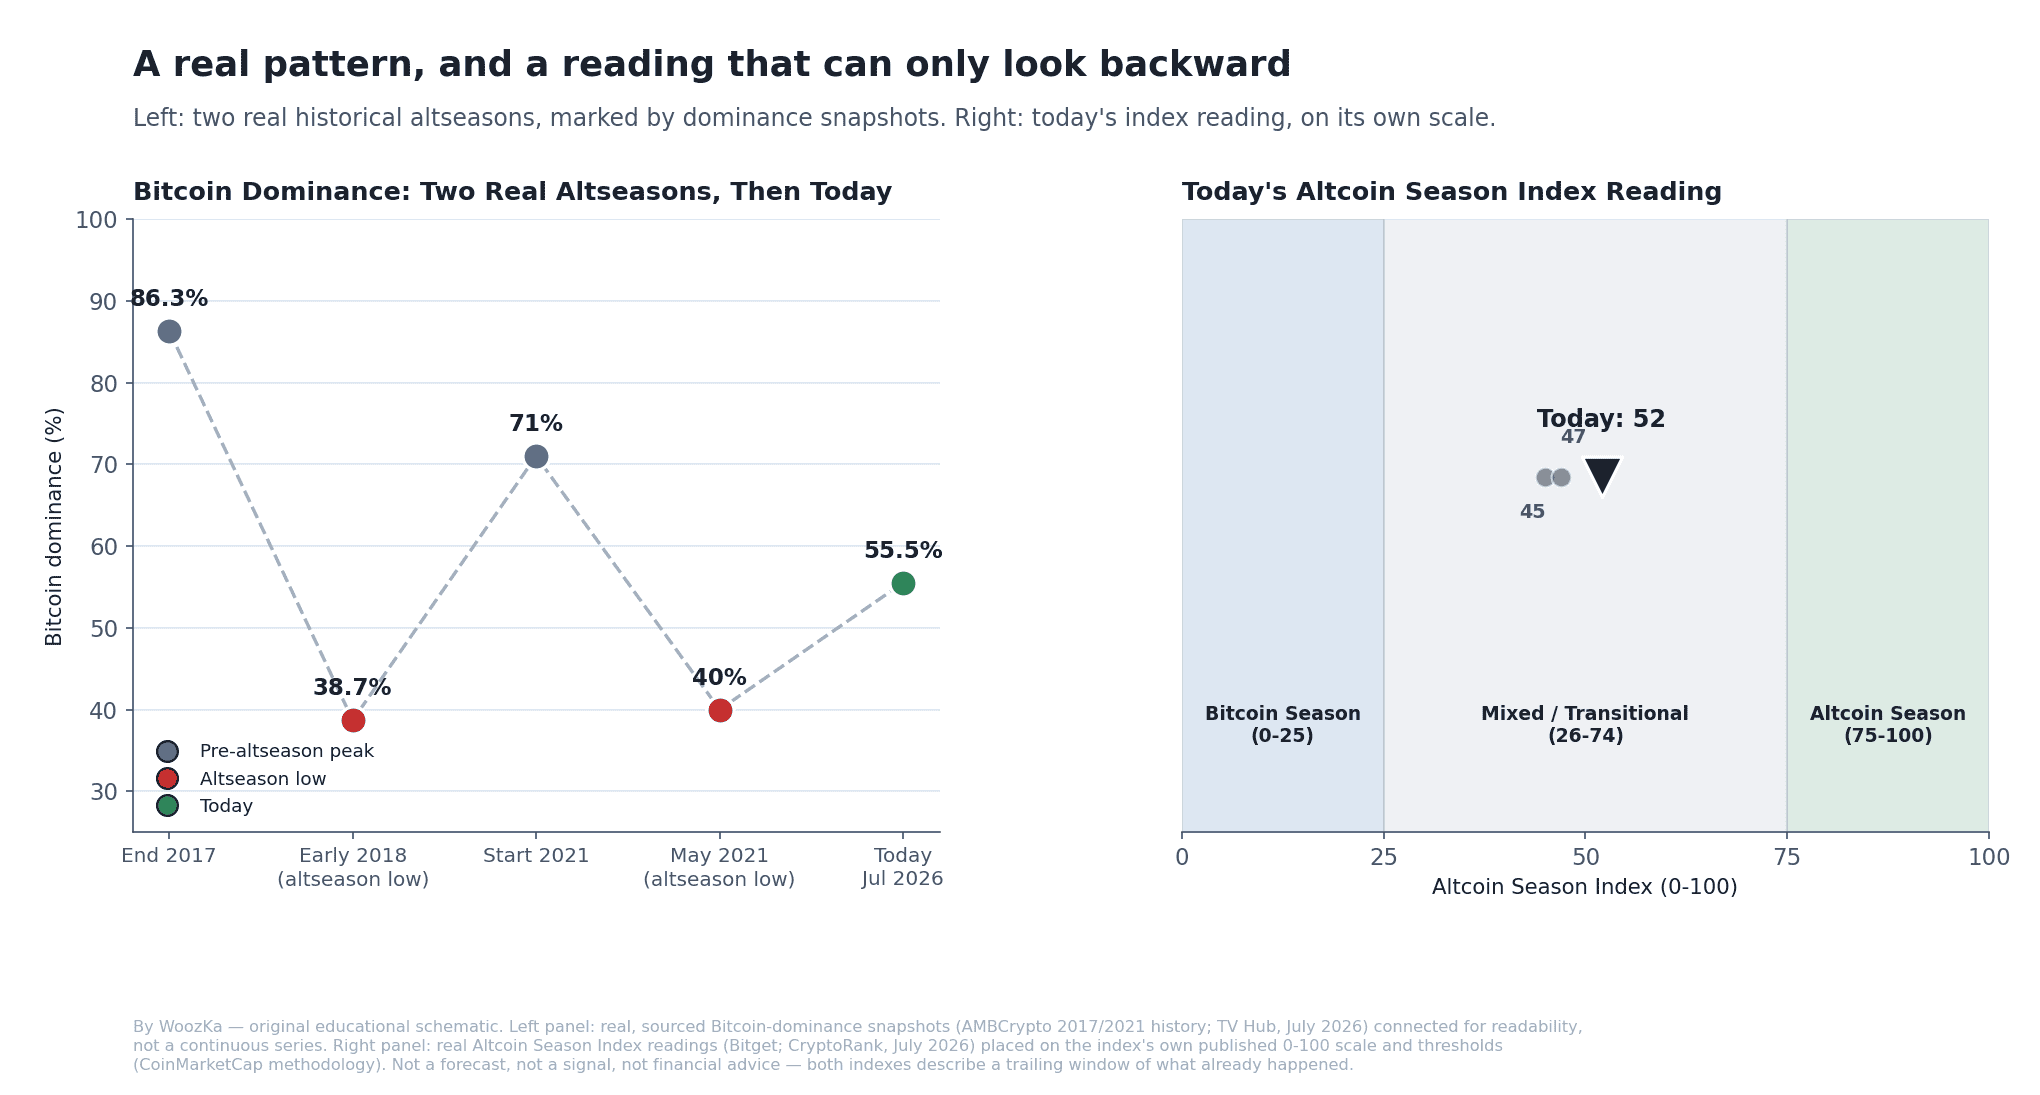
Left: two real altseasons, seen through Bitcoin dominance. Right: where the index actually sits today — a reading, not a signal.
If you’ve spent any time in crypto social media, you’ve seen the phrase “altseason is here” attached to almost any week where a few altcoins had a good run. Read how to recognize where we are in a crypto market cycle and you already know the honest posture this blog takes toward cycle talk: real, trackable indicators, never prediction engines. Altcoin season is exactly that kind of indicator — a specific, checkable, daily-refreshed number with a public methodology. It is not a vibe, and it is not something anyone can declare has “arrived” by saying so loudly enough. This article explains what the Altcoin Season Index and Bitcoin dominance actually measure, what they currently read, and — the part most content built around this topic skips — why, by the way the index is built, a high reading can only ever tell you what has already happened, never what happens next.
Bitcoin Dominance: The Simpler Number Underneath
Bitcoin dominance is Bitcoin’s share of the total crypto market capitalization — Bitcoin’s market cap divided by the market cap of every cryptocurrency combined, expressed as a percentage. As of early July 2026, Bitcoin dominance was reported at roughly 55.5%, against a total crypto market capitalization of about $2.13 trillion [source: TV Hub, “Bitcoin Dominance July 2026”]. One nuance worth naming: stablecoins (Tether, USDC, and others) are counted inside “total crypto market cap” in most dominance calculations, and stablecoins alone represent well over $300 billion of that total — so a chunk of the denominator is dollar-pegged assets that aren’t really competing with Bitcoin for “risk-on” allocation at all. That means headline dominance figures can understate Bitcoin’s relative share among the assets people are actually treating as speculative or growth-oriented crypto exposure [source: TV Hub Bitcoin Dominance guide, July 2026].
The qualitative read is simple and worth stating precisely, because it’s easy to get backwards: a rising dominance reading is generally interpreted as capital rotating toward Bitcoin relative to everything else — a “risk-off within crypto” signal, not necessarily bearish for Bitcoin’s dollar price, just relatively stronger than the rest of the market. A falling dominance reading means capital is rotating toward altcoins relative to Bitcoin. That’s a description of what already happened to relative prices over some window. It says nothing, by itself, about what happens next.
The Altcoin Season Index: A Precise, Checkable Definition
The Altcoin Season Index (tracked by CoinMarketCap and originally popularized by Blockchaincenter.net) has an exact, public methodology, and it’s worth stating in full because most content that mentions it never does: it looks at the top 100 coins by market capitalization, excluding stablecoins (like USDT, USDC, DAI) and asset-wrapped tokens (like WBTC, stETH), and measures what percentage of that basket outperformed Bitcoin’s price return over the trailing 90 days. Ethereum counts as an altcoin in this index. The window rolls forward daily — every day the index drops the oldest day and adds the newest one, so it’s always describing “the last 90 days as of today,” not a fixed historical period [source: CoinMarketCap Altcoin Season Index methodology, cross-referenced against Token Metrics’ 2026 index guide].
The index is scaled 0 to 100, and the thresholds are exact, not impressionistic:
- 0–25: “Bitcoin Season” — 25% or fewer of the top 100 altcoins beat Bitcoin over the trailing 90 days.
- 26–74: a mixed/transitional zone — no clear rotation either direction. Some trackers subdivide this further (roughly 26–49 as “leaning Bitcoin,” 50–74 as “leaning alts”), but the two hard, named thresholds in the original methodology are 25 and 75.
- 75–100: “Altcoin Season” — 75% or more of the top 100 altcoins beat Bitcoin over the trailing 90 days.
[source: CoinMarketCap Altcoin Season Index methodology; Token Metrics, “Understanding the Altcoin Season Index,” 2026]
Where the Numbers Actually Sit Right Now (as of July 7, 2026) — Not a Signal
As of early July 2026, the Altcoin Season Index read 52 — inside the mixed zone, meaning roughly half of the top 100 altcoins outperformed Bitcoin over the trailing 90 days, with no clear rotation established in either direction [source: Bitget, “Altcoin Season Index Holds at 52: Market Remains in Neutral Territory,” July 2026]. That 52 didn’t arrive from nowhere and it isn’t fixed: two other recent, independently dated readings from the same broad window show the index at 45 and 47 [sources: CryptoRank, “Altcoin Season Index Drops to 45, Signaling Return of Bitcoin Dominance”; CryptoRank, “Altcoin Season Index Falls to 47 as Bitcoin Regains Market Momentum”]. Read together, that’s a number drifting inside a narrow ten-point band over a matter of weeks — exactly the kind of noisy, day-to-day movement the “check the live index, don’t trust a number you read in an article” caveat exists for. By the time you’re reading this, the actual current reading has almost certainly moved.
The commonly cited threshold for an officially confirmed 2026 altcoin season hasn’t been reached: analysts generally look for Bitcoin dominance to fall meaningfully — commentary has pointed to roughly the 50–55% range — alongside the index clearing 75, and neither condition was met as of this reading [source: general 2026 altcoin-season market commentary, cross-referenced across multiple trackers]. That’s a factual description of where two specific numbers sat on one specific date. It is not a countdown, and it is not this article telling you to do anything differently because of it.
Two Real Altseasons, So the Pattern Isn’t Abstract
It’s worth grounding “altseason” in what it actually looked like historically, using Bitcoin dominance as the marker, because the honest version of this topic needs real, dated data rather than a vague gesture at “the good old days”:
- 2017–2018: Bitcoin dominance fell from roughly 86.3% at the end of 2017 to a low of about 38.7% in early 2018, driven substantially by the ICO boom — hundreds of new tokens raising capital and briefly outperforming Bitcoin by wide margins. Ripple moved from roughly $0.006 in January 2017 to over $3 by January 2018; Litecoin moved from roughly $4 to nearly $350 over the same stretch [source: AMBCrypto, “Bitcoin dominance weakens again — Will 2017 and 2021 history repeat?”].
- 2021: Bitcoin dominance fell from a peak above 70% at the start of the year to a low of roughly 40% by May 2021, coinciding with rapid growth in DeFi and NFT activity pulling capital into a much broader set of altcoins [source: AMBCrypto, same].
Both episodes are real, both are large, dated moves in the same direction (falling BTC dominance, broad altcoin outperformance), and both eventually reversed. Neither tells you when the next one starts, how long it lasts, or whether today’s 55.5% dominance and 52 index reading are “early,” “not happening,” or something else — because a 90-day trailing average, by construction, cannot look forward.
Why This Can Only Ever Be a Backward-Looking Number
This is the part worth sitting with, because it’s the whole honest thesis of this article: the Altcoin Season Index measures a trailing 90-day window. A reading of 75 today is arithmetically a statement about the last three months of relative price action — it is not, and cannot be, a forecast of the next three months. By the time the index actually crosses 75 and a headline declares “altseason is officially here,” the outperformance that produced that reading has, definitionally, already happened. Buying into whatever narrative is loudest at that exact moment is buying after the move the index is measuring, not ahead of it. The index is genuinely useful for describing what has been happening in relative terms — it is structurally incapable of being a heads-up about what’s about to happen, and no amount of dashboard-watching changes that math.
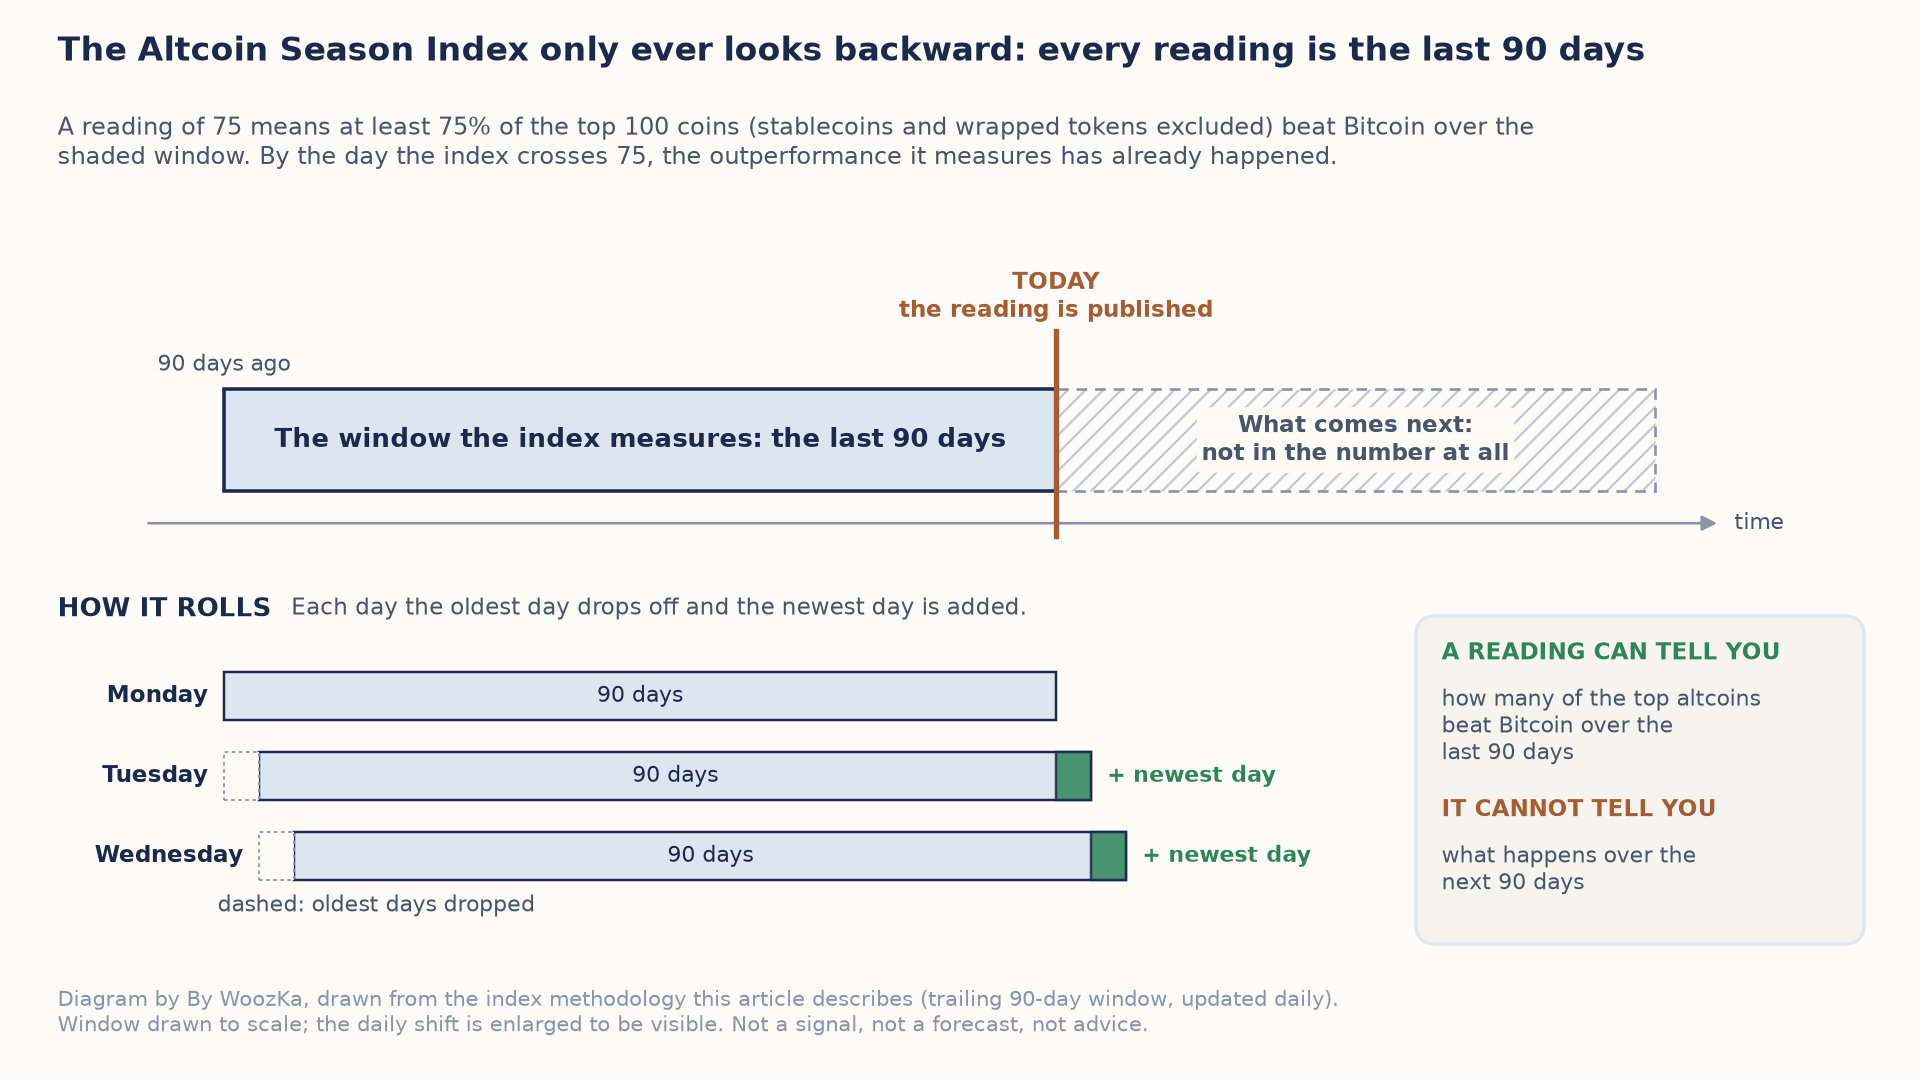
Whatever the index reads today, including a 75, it is a description of the 90 days that just ended; nothing after today is in the number.
What This Is Actually Useful For
Not market timing — that’s true of every indicator in this cluster, and it’s especially true here given the trailing-window mechanics just described. What Bitcoin dominance and the Altcoin Season Index are genuinely good for: giving you precise vocabulary so “altseason,” “BTC dominance flipping,” and “rotation” mean something specific instead of vague hype language; letting you evaluate a claim someone makes online against an actual, checkable number instead of taking their word for it; and recognizing that a reading anywhere in the 26–74 “mixed” zone (where the index has sat for most of 2026 so far) simply means there is no clear rotation story to tell — which is itself useful information, since it means anyone declaring a confident “altseason” narrative in a mixed-zone month is speaking past the data, not from it.
The practical response to genuine uncertainty about rotation, same as everywhere else in this cluster, is position sizing: holding a crypto allocation sized so that being wrong about whether “altseason” arrives — in either direction — doesn’t threaten your financial plan. That’s a durable answer regardless of which zone the index sits in next week.
Anyone who has spent a few weeks in crypto-adjacent group chats or social media during a hot stretch for small-cap tokens has seen the pattern: a handful of altcoins post a big week, “altseason” starts getting typed in all caps, and the loudest declarations tend to cluster right around the point where the move is furthest along, not at the start of it. That’s not a coincidence — it’s the same trailing-window mechanics described above playing out in real time, in language instead of in an index chart.
Where to Go Next
- Crypto Market Cycles: How to Recognize Where We Are — the cluster anchor: the four-year halving cycle, the Fear & Greed Index, and the same no-market-timing discipline applied to the bigger picture this article’s numbers sit inside.
- Is Bitcoin Actually Correlated With Stocks? What the Data Shows — a companion data piece on how Bitcoin’s relationship with equities has shifted over time.
- How to Buy Your First Bitcoin Safely: A Step-by-Step Guide — the pillar this whole silo builds on: risk management first, market narratives last.
- Crypto Position Sizing: How Much of Your Portfolio Should Be Crypto? — the practical response to rotation uncertainty this article keeps pointing to.
If you want markets explained plainly — risk-first, never hyped, no price targets — that’s what the newsletter is for. Subscribe below.
Disclaimer: This article is educational content, not financial advice. I am not a licensed financial advisor, and nothing here is a recommendation to buy or sell any security or asset. Investing and trading involve risk, including the possible loss of the money you invest. Do your own research and consider consulting a licensed financial professional before making investment decisions. Read the full Disclaimer.
Historical and backtested results are hypothetical, carry inherent limitations, and do not guarantee future results. Figures were accurate to the best of my knowledge as of this article’s last-updated date and may have changed.
