Crypto Market Cycles: How to Recognize Where We Are
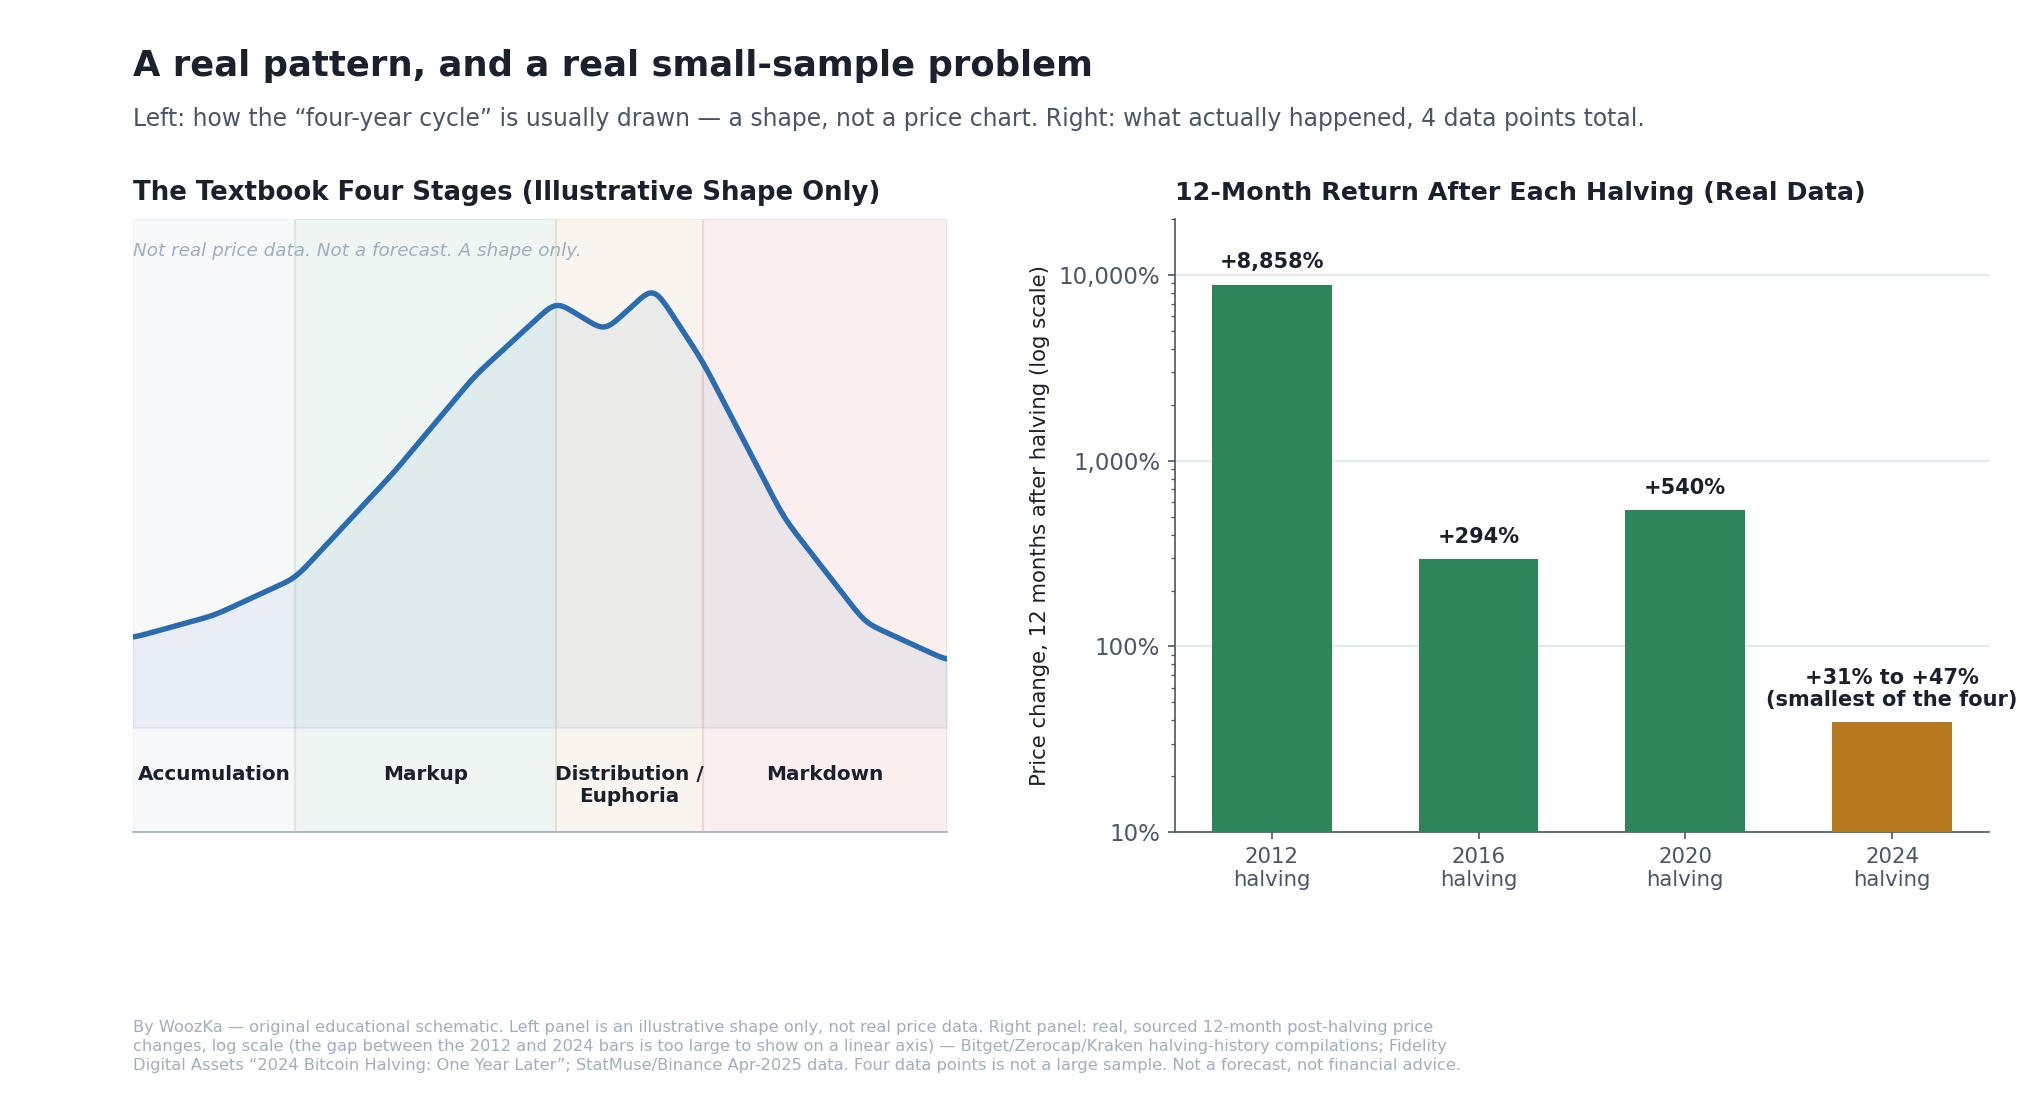
Left: how the “four-year cycle” is typically drawn — a shape, not a chart of real prices. Right: what actually happened in the 12 months after each of the four real halvings so far. The pattern is real. So is the fact that there are only four of them, and the trend across them is shrinking, not repeating.
If you’ve read how to buy your first Bitcoin safely, you’ve probably since run into a wall of market-structure jargon: “we’re in the markup phase,” “altseason is coming,” “Bitcoin dominance is exploding,” “the Fear & Greed Index is flashing extreme fear.” All of these refer to real, well-defined, trackable indicators. None of them is a prediction engine. This article explains what each framework actually measures, is explicit about its limits, and — because this is the honest way to write about crypto cycles — spends real time on the parts of the story that don’t fit neatly into a chart. Nothing here should be read as a signal to buy, sell, or time anything. If you’re looking for that, this isn’t the right article, and no article should be.
The Four-Year Halving Cycle, in Plain Terms
Bitcoin’s protocol cuts the block-reward subsidy paid to miners in half roughly every four years — it has happened four times so far, on November 28, 2012, July 9, 2016, May 11, 2020, and April 20, 2024. The popular “four-year cycle” framework observes that, loosely aligned to that rhythm, Bitcoin’s price history has moved through four recurring-looking stages: an accumulation phase (price basing after a prior decline, low public interest), a markup phase (a sustained climb, often starting before and continuing after a halving), a distribution/euphoria phase (a blow-off top with heavy public and media attention), and a markdown phase (a steep drawdown — historically as severe as roughly 80% for Bitcoin and considerably worse for many altcoins). It’s a genuinely useful mental model for organizing crypto’s price history into a shared vocabulary. It is also, underneath the vocabulary, resting on a much smaller amount of actual data than the confidence with which it’s usually repeated online would suggest.
The Honest Small-Sample Problem
Here’s the part most “four-year cycle” content skips: the entire pattern rests on three completed halvings plus a fourth still playing out — a sample size of three to four. Market commentators analyzing whether the cycle still holds have explicitly flagged this as too small a sample to treat as a settled law of markets [source: general market commentary on the four-year-cycle debate, e.g. Caleb & Brown, “Is Bitcoin’s Four-Year Cycle Broken?”]. Four data points is not nothing — but it’s a long way from a statistically reliable pattern, and the honest way to read it is as an interesting historical observation, not a countdown clock.
The data itself makes the small-sample point better than any caveat can. Here’s the price change in the 12 months following each halving, sourced and dated:
- November 28, 2012 halving: Bitcoin went from roughly $12 to about $1,075 one year later — a gain of roughly +8,858% [source: Bitget, Zerocap, and Kraken halving-history compilations].
- July 9, 2016 halving: roughly $670 to about $2,560 a year later — roughly +294% [source: same].
- May 11, 2020 halving: roughly $8,727 to about $55,847 a year later — roughly +540% [source: same].
- April 20, 2024 halving: Bitcoin traded around $64,000–$67,000 on the halving date and was trading around $83,671 by mid-April 2025 and closed April 2025 near $94,207 — a gain of roughly +31% to +47%, by far the smallest of the four [source: Fidelity Digital Assets, “2024 Bitcoin Halving: One Year Later”; StatMuse and Binance April 2025 price data].
Read plainly, that’s a trend of shrinking gains with each successive halving — not a repeating pattern at all, if you look at the actual magnitude rather than just the direction. That could mean several different things, and this is exactly where the honest disagreement starts.
What Four Data Points Can Actually Support
The section above says the sample is too small to treat as a settled law, and it is right — but it leaves that as a caveat rather than a quantity, and then draws a one-line conclusion from the four numbers that those four numbers do not quite support. Both are worth working through, because the arithmetic makes the article’s own argument stronger than the caveat does. Everything below uses only the prices and dates already listed above; nothing external is added, and nothing here says anything about what comes next.
The Four Halvings, Recomputed
First, a check on the inputs, because an argument about sample size should start by confirming the sample.
| Halving | Stated | Recomputed |
|---|---|---|
| Nov 28, 2012 | +8,858% | +8,858.33% |
| Jul 9, 2016 | +294% | +282.09% |
| May 11, 2020 | +540% | +539.93% |
| Apr 20, 2024, low end | +31% | +30.74% |
| Apr 20, 2024, high end | +47% | +47.20% |
Four of the five reproduce to within 0.33 points. The 2016 row does not: $670 to $2,560 is +282.09%, not the +294% stated — a gap of 11.91 points. Both prices are hedged as “roughly” above, and the stated figure reconciles if either endpoint is rounded, from $649.75 rather than $670, or to $2,639.80 rather than $2,560. This is a rounding question rather than a factual dispute, and it is flagged here rather than quietly changed — but it is worth knowing that the second-cycle number is the one carrying the most slack.
“Shrinking Gains With Each Successive Halving,” Checked
That is the sentence the section above draws from these four figures. Taking the steps one at a time is the whole test.
| Step | Change | Direction |
|---|---|---|
| 2012 → 2016 | ×0.032 | down |
| 2016 → 2020 | ×1.914 | up |
| 2020 → 2024 | ×0.057 | down |
The sequence is not monotonic. The 2016-to-2020 step rose, by a factor of 1.914. Three of the steps fall and one rises, so “shrinking gains with each successive halving” is not what these numbers show. The first-to-last decline is real and enormous — the 2012 cycle is 288.2× the low end of the 2024 one — and that broader claim survives intact. But the per-step version does not, and the distinction matters precisely because a smooth decay is the kind of shape people extrapolate from, while an up-and-down sequence of four is the kind they should not.
What “Too Small a Sample” Costs, as a Number
Here is the strongest version of the argument the section above makes in words. Grant the pattern every benefit of the doubt: assume all four 12-month windows were positive, and ask only whether that record could be told apart from chance.
| Observations | All positive by chance | Clears 5%? |
|---|---|---|
| 3 | 12.5% | no |
| 4 | 6.25% | no |
| 5 | 3.125% | yes |
| 6 | 1.5625% | yes |
If each 12-month window were nothing more than a coin flip, four-for-four would happen 6.25% of the time — which does not clear the conventional 5% threshold. Read that carefully, because it is the sharpest thing on this page: a perfect record, at this sample size, is still not distinguishable from luck by the usual standard. On the three completed halvings the framework mostly leans on, the figure is 12.5%. It would take five consecutive positive windows to reach 3.125% and clear the bar — which, at roughly four years apart, is another cycle away. That is what “too small a sample” costs, and it is why the section above is right to call this an interesting historical observation rather than a countdown clock.
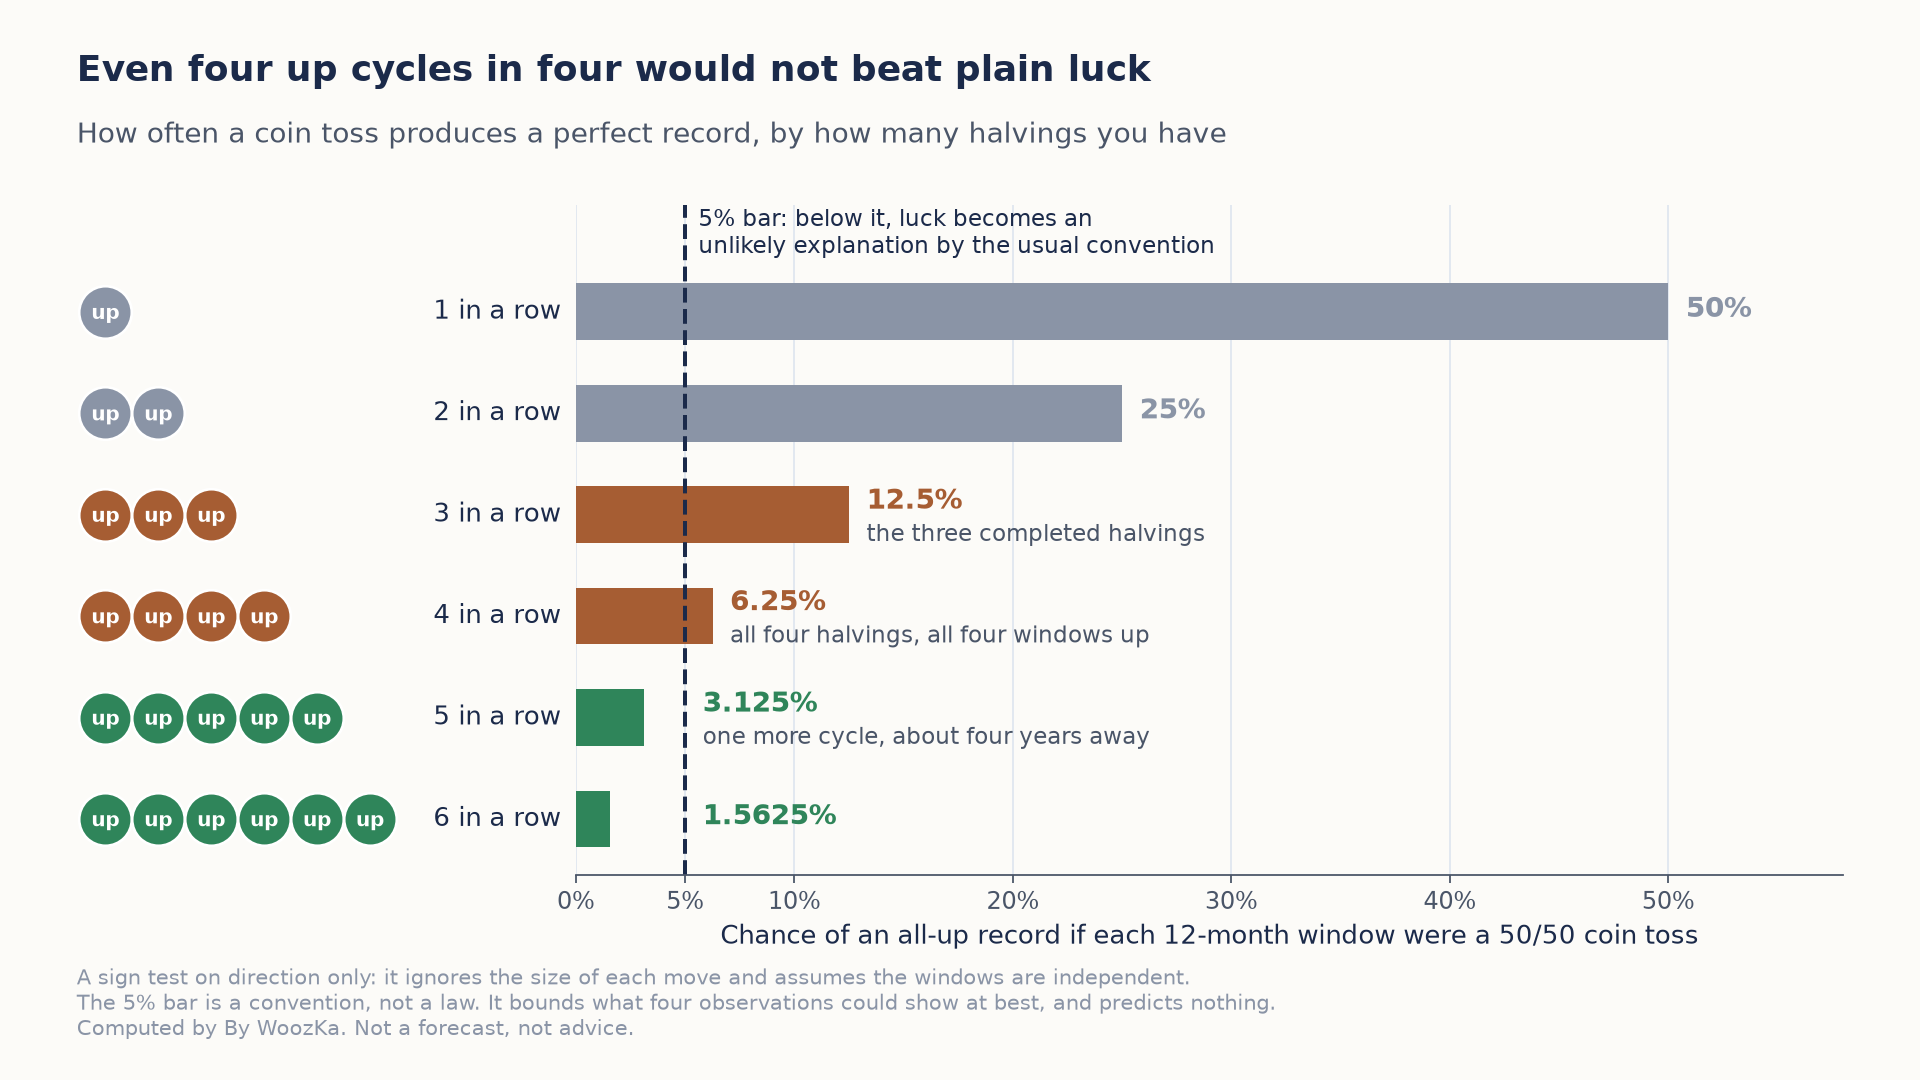
If each post-halving year were a coin toss, a perfect four-for-four record would still happen 6.25% of the time, which does not clear the usual 5% bar. It would take a fifth consecutive up window, another cycle away, to get below it, and even then direction alone says nothing about size.
A small-sample caution, and the method that produced these tables. Every input above is a price, date or percentage this article already publishes and sources; nothing external is imported, and the code behind the tables verifies every published value before reporting. The sign test in the last table is the simplest possible benchmark and not a model of the halving: it looks only at direction, ignores magnitude entirely, and assumes the windows are independent. It is used here for one narrow purpose — to bound what four observations could establish at best — and a real test of the halving would need far more than this article publishes. The 5% threshold is a convention, not a law of nature. Nothing above forecasts a price, a cycle, or a date, and nothing above suggests buying, selling or holding anything; the entire point is what this sample cannot tell you. The Stock-to-Flow fit, the log-time correlation and the 2024 security-budget study are research the article reports rather than figures it publishes, so they are not re-derived here. No shipped calculator covers sample-size arithmetic, so nothing here comes from a tool and none is linked.
Four Competing Explanations — None of Them Settled
The supply-shock story (Stock-to-Flow). The most widely circulated explanation is that halving Bitcoin’s new-supply rate mechanically tightens supply against steady or growing demand, pushing price up — popularized as the “Stock-to-Flow” (S2F) model. The model’s real track record deserves an honest look: it tracked Bitcoin’s price with striking accuracy from roughly 2015 through late 2021, then deviated sharply and has not recovered its predictive fit since [source: model-tracking coverage, e.g. CoinGecko’s Stock-to-Flow explainer]. Formal out-of-sample testing found S2F fails to outperform a naive “assume tomorrow’s price equals today’s price” forecast at one-to-six-month horizons, and a 2026 academic study found the model’s apparent in-sample significance largely vanishes once time-based fixed effects are added to the analysis — its explanatory power turns out to be substantially confounded with Bitcoin’s long-running upward price trend over time (an 80.57% correlation with a simple log-time trend) rather than genuinely explained by the supply mechanics [source: “Bitcoin Price Prediction: Peer-Reviewed Evidence and Social Media Discourse,” 2026, arXiv:2606.00071].
The security-budget counter-effect. A 2024 peer-reviewed study took a more skeptical empirical look at what halvings actually do, examining the 2012, 2016, and 2020 events directly. It found that in the short run, halvings have tended to resemble mild recessionary episodes for the network — price and on-chain transaction value both declining, alongside the obvious cut to miner revenue — and concluded that in the short term, the adverse effect on network security economics has outweighed the positive supply-shock effect on price [source: Mohammadhossein Lashkaripour, “Some stylized facts about bitcoin halving,” Finance Research Letters, 2024]. That’s close to the opposite of the popular narrative’s immediate expectation, even if it doesn’t contradict the longer 12-month figures above.
The adoption/institutional-flow view. On-chain analyst James Check has argued the halving-driven framing has it backwards: Bitcoin’s real market cycles, in his framework, are better explained by adoption phases than by the halving mechanism — an “adoption cycle” (2011–2018, early retail adoption), an “adolescence cycle” (2018–2022, leverage-driven booms and busts), and a “maturity cycle” beginning in 2022, driven by institutional capital, regulatory clarity, and — since January 2024 — spot Bitcoin ETF flows. In his own words: “In my opinion, Bitcoin has experienced three cycles, and they are not anchored around the halvings” [source: James Check, quoted in Cointelegraph, “Bitcoin market cycles not anchored around halvings: Analyst,” August 27, 2025; CoinMarketCap Academy, “Bitcoin Cycles Driven by Adoption Not Halvings, Says Expert”]. Multiple other analyses of the 2024 halving specifically note that its price effect was overshadowed by spot-ETF institutional flows and regulatory developments unfolding around the same time — making it genuinely hard to isolate “the halving’s effect” from everything else that happened that year.
The honest synthesis. These three views are not fully reconcilable, and this article isn’t going to pretend they are. What can be said without overreaching: a supply-side mechanism is real and mechanically true (fewer new coins are created after a halving, full stop); a network-security cost is also real and mechanically true (miner revenue drops, full stop); and the magnitude of every 12-month post-halving move has been getting smaller, alongside a genuinely new structural factor — regulated, exchange-traded institutional demand — that didn’t exist for the first three halvings at all. Whether the fourth halving’s small return reflects a maturing, larger-cap asset simply having less room to multiply, or the halving mechanism becoming less relevant as Check argues, or both, is a live, unresolved debate among people who study this for a living — not something this article is going to resolve for you.
Bitcoin Dominance and the Altcoin Season Index
Two related, narrower indicators sit inside the broader cycle conversation. Bitcoin dominance is simply Bitcoin’s share of total cryptocurrency market capitalization. A rising dominance reading is generally read as capital rotating toward Bitcoin relative to altcoins (sometimes called “risk-off within crypto”); a falling reading as capital rotating toward altcoins (“risk-on within crypto”). That’s a description of what already happened to relative prices, not a forecast of what happens next.
The Altcoin Season Index formalizes a related, specific question: are altcoins, as a group, actually beating Bitcoin? The index is defined as the percentage of the top 100 coins (excluding stablecoins and wrapped tokens) that have outperformed Bitcoin over a trailing 90-day window. A reading of 75 or higher defines “Altcoin Season”; a reading of 25 or lower defines “Bitcoin Season”; the index runs 0–100 and refreshes daily [source: Alternative.me / CoinMarketCap Altcoin Season Index methodology]. As of July 7, 2026, the Altcoin Season Index read 47 — squarely neutral, leaning toward Bitcoin, with no confirmed altcoin season in effect [source: CryptoRank, “Altcoin Season Index Drops to 47 as Bitcoin Regains Market Momentum,” July 2026]. Bitcoin dominance was reported around 55–56% in the same window [source: TV Hub, “Bitcoin Dominance July 2026”]. Both numbers move daily and will be stale by the time you’re reading this — check the live index for the current reading rather than treating the figures above as current. Neither number tells you what happens next; both describe what already happened over the trailing period they measure.
The Fear & Greed Index — and What Its Own Inconsistency Teaches You
The Crypto Fear & Greed Index, published by Alternative.me, compresses several inputs into a single 0 (Extreme Fear) to 100 (Extreme Greed) score: volatility (25%, current drawdowns versus 30/90-day averages), market momentum and volume (25%, current versus 30/90-day averages), social media (15%, hashtag/mention volume and engagement on X/Twitter), Bitcoin dominance (10%), and Google Trends search-volume data (10%); a survey component originally weighted at 15% is currently paused [source: Alternative.me Fear & Greed Index methodology].
Here’s a genuinely useful, honest observation the methodology itself predicts: different providers who track “the” Fear & Greed Index don’t agree on the exact number, because each builds its own version of the composite. In the first week of July 2026, one widely cited tracker read 15 (Extreme Fear), another read 24 (Extreme Fear), and a third read 28 (Fear, bordering Extreme Fear) — three different numbers, all landing in the same “meaningfully afraid” zone, all published within roughly 48 hours of each other [source: Milk Road, feargreedmeter.com, and CoinStats Fear & Greed trackers, early July 2026]. That spread isn’t a data error to be resolved — it’s a direct consequence of the index being one specific vendor’s construction, not an official or unique metric. Treat any single Fear & Greed reading as a rough sentiment gauge, not a precise number, and treat the direction and intensity (extreme fear vs. mild fear vs. neutral) as more meaningful than the exact digit.
Where the Data Currently Reads (as of July 7, 2026) — Not a Signal
Putting the pieces together, purely as a description of the present moment, not a forecast: Bitcoin traded around $63,000 on July 7, 2026, down roughly 50% from its all-time high of $126,198.07 set on October 6, 2025 [source: Fortune, “Current price of Bitcoin for July 7, 2026”]. That’s roughly 27 months after the April 2024 halving. Multiple Fear & Greed trackers read solidly in “Extreme Fear” territory. The Altcoin Season Index sat at 47 — Bitcoin-leaning, not altseason. If you wanted to force this onto the textbook four-stage framework, you might call it markdown-phase-adjacent: a substantial drawdown from a recent high, fear-dominant sentiment.
That label is exactly the kind of retrospective pattern-matching this article has spent several sections warning about, and it’s worth being explicit about why it isn’t a signal to act on. An n of 3–4 doesn’t let anyone say with confidence what phase comes next, or when. The 2024 halving already produced the smallest 12-month gain on record, which is at least as consistent with “the old four-stage playbook is becoming less reliable as the asset matures and institutional flows dominate” as it is with “we’re just later in a familiar rhythm.” A 50% drawdown from an all-time high has, historically, meant very different things at different points in Bitcoin’s history — sometimes a brief correction, sometimes the start of a much longer decline. There is no honest way to look at today’s indicator readings and tell you which of those this is. Anyone telling you they know is selling certainty a small, contested, four-data-point sample genuinely cannot support.
What Actually Is Useful to Do With This Information
Not market timing — that’s the entire point of this article. What these frameworks are genuinely good for: building vocabulary so headlines and social media commentary about “altseason” or “the cycle” are legible instead of intimidating; recognizing that extreme sentiment readings (in either direction) are a description of crowd mood right now, not a trading edge; and understanding that every indicator above is backward-looking by construction, describing a trailing window of what already happened. The practical response to genuine uncertainty about where a cycle is headed isn’t trying to time it more precisely — it’s the boring, durable answer this entire silo keeps returning to: position sizing that assumes you could be wrong about the cycle stage entirely, sized so a large, sustained drawdown is survivable rather than catastrophic, regardless of which “phase” turns out to be correct in hindsight.
There’s a familiar rhythm to how cycle calls tend to age online: a confident “we’re definitely in the markup phase now” or “this is clearly the top” post gets shared widely near a local price extreme, the market does something else in the following months, and the post quietly stops getting referenced — never retracted, just forgotten. That pattern repeats across every platform and every cycle, and it’s a genuinely useful tell: the confidence of a cycle-stage claim carries almost no information about its accuracy.
Where to Go Next
- How to Buy Your First Bitcoin Safely: A Step-by-Step Guide — the pillar this article builds on: risk management first, price speculation last.
- Crypto Position Sizing: How Much of Your Portfolio Should Be Crypto? — the practical response to cycle uncertainty this article keeps pointing to.
- Bitcoin Halving Explained: What Actually Happens to Price? — the supply-schedule mechanics behind the halving dates used throughout this article, without any of the cycle-stage debate.
- On-Chain Data 101: What Metrics Actually Matter? — data-driven ways to read current network conditions that go beyond price and sentiment indexes alone.
If you want markets explained plainly — risk-first, never hyped, no price targets — that’s what the newsletter is for. Subscribe below.
Disclaimer: This article is educational content, not financial advice. I am not a licensed financial advisor, and nothing here is a recommendation to buy or sell any security or asset. Investing and trading involve risk, including the possible loss of the money you invest. Do your own research and consider consulting a licensed financial professional before making investment decisions. Read the full Disclaimer.
Historical and backtested results are hypothetical, carry inherent limitations, and do not guarantee future results. Figures were accurate to the best of my knowledge as of this article’s last-updated date and may have changed.
