Growth Investing Is Priced In: Why a Great Company Can Be a Terrible Stock
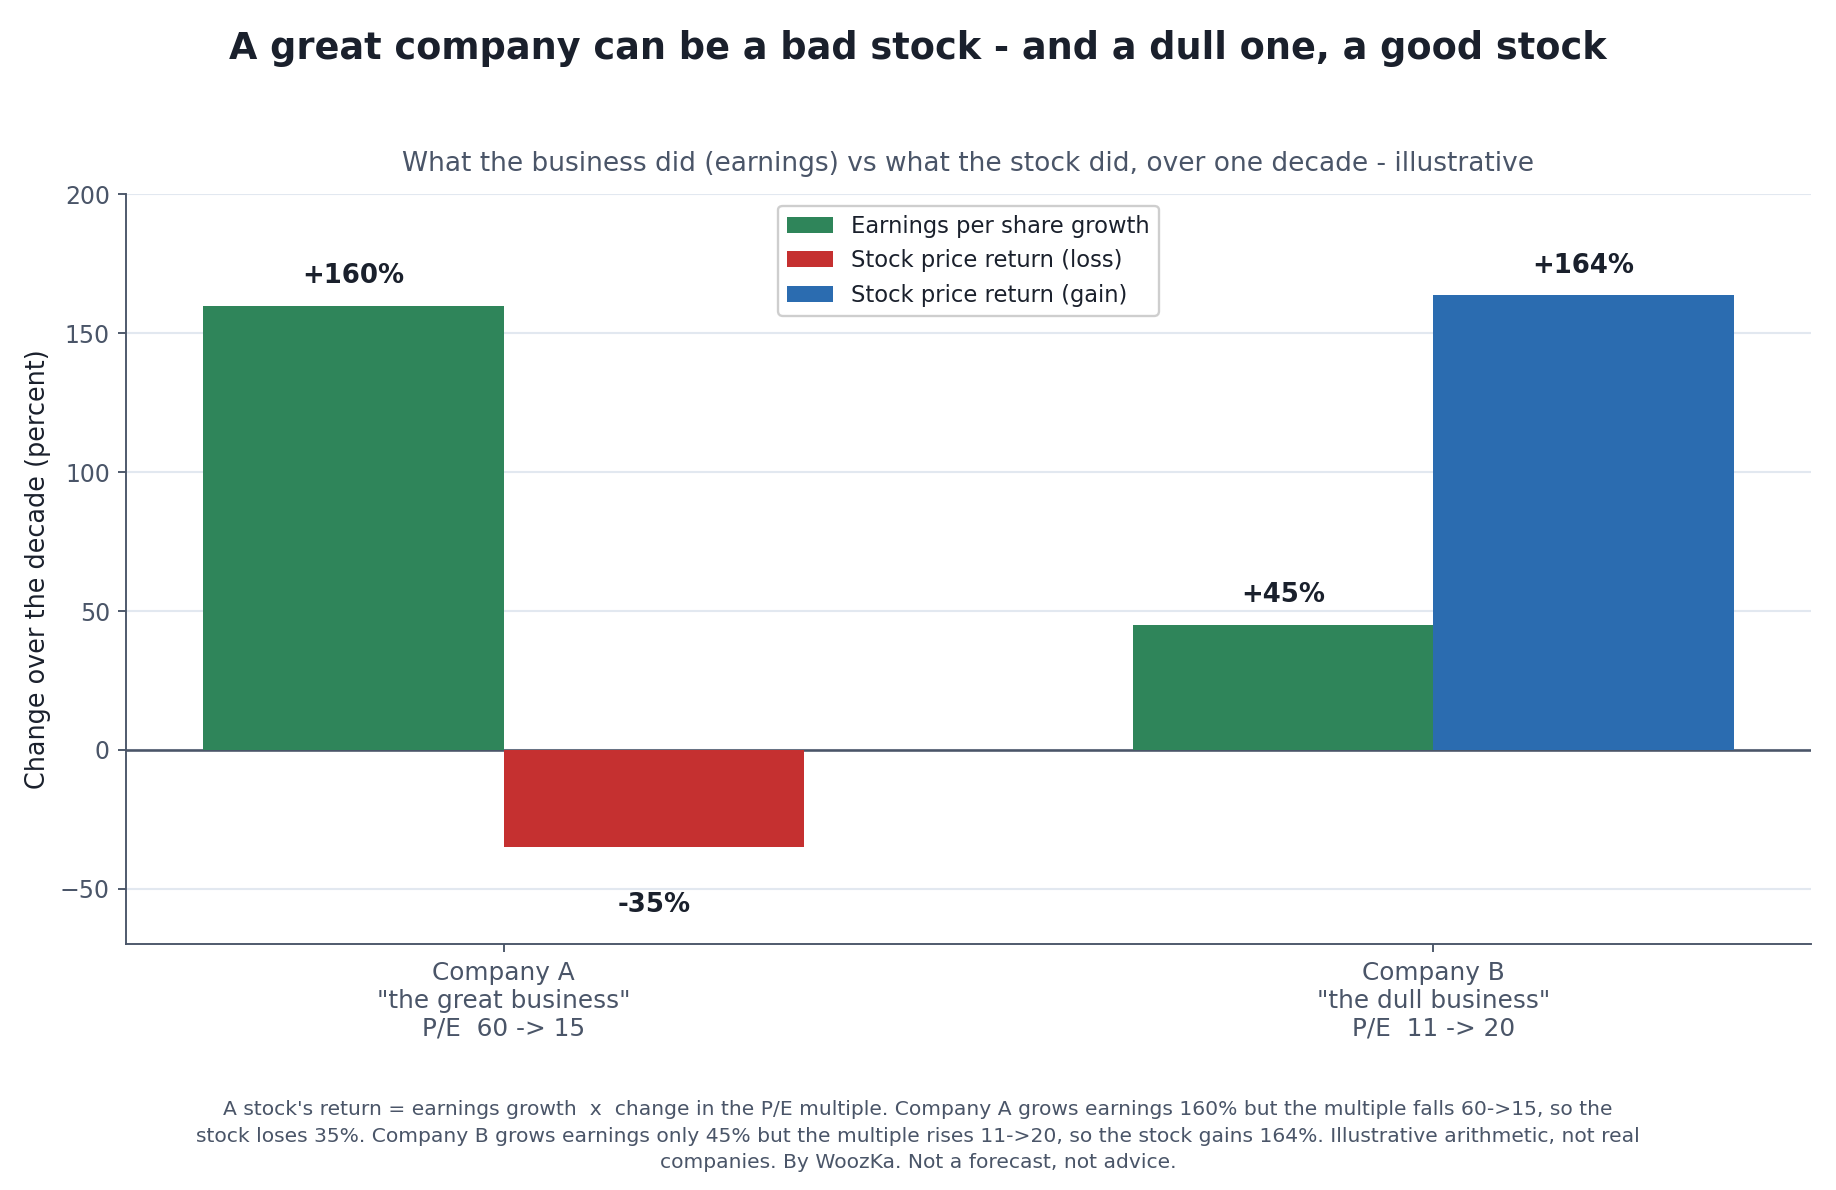
Everything this article argues, in one picture. The green bars are what each business did; the colored bars are what the stock did. They disagree because a stock’s return is not its earnings growth — it is its earnings growth times the change in the price the market is willing to pay for a dollar of those earnings. Buy that price too high and a wonderful business can still lose you money.
Most people meet growth investing as a simple promise: find the fast-growing companies, hold them, and their growth becomes your return. It is intuitive, and it is wrong in a specific and expensive way. A growth stock’s price already contains a forecast — a demanding one — of exactly how fast the company will grow. You do not get paid for the growth. You get paid only for the growth that beats what was already priced in. That gap between what the market expects and what the company delivers is the whole game, and it is why a genuinely great company, growing for years, can hand its shareholders nothing.
This is a stocks article, and the silo disclaimer governs every line: nothing here recommends growth investing, value investing, or any security. The goal is to teach the style honestly — including the precise way it hurts people who do everything “right” — so you can decide whether it fits you.
The Price Is a Forecast, Not a Fact
Start with what a stock price actually is. The value of a company is the cash it will return to shareholders over its life, discounted back to today. For a mature, slow business, most of that cash is near-term and the price barely reaches into the future. For a fast grower trading at a rich multiple — 40 times earnings, say, when the broad market is nearer 18 — the price only makes arithmetic sense if the company grows earnings quickly for years. That required growth is not your reward for being smart. It is the entry fee, already embedded in the number you pay.
This is the core insight of expectations investing, the framework Alfred Rappaport and Michael Mauboussin built around a single move: instead of forecasting a company’s future and comparing it to the price, start with the price and read out the expectations the market has already baked in [source: Rappaport & Mauboussin, Expectations Investing: Reading Stock Prices for Better Returns, revised ed., Columbia University Press, 2021]. Their central finding is the uncomfortable one for growth investors: stock prices relate only tenuously to earnings growth itself; what moves a stock is a change in expectations about future cash flows [source: Rappaport & Mauboussin, 2021]. You can be completely right about the company and still lose, because the price already agreed with you.
So the question a growth investor is really answering is never “will this company grow?” It is the far harder “will this company grow faster than the price already assumes?” — and the price assumes a lot.
The Treadmill: You Have to Beat the Forecast, Not Just Grow
Here is the mechanism made concrete. Suppose a stock trades at 40 times earnings while the market trades near 15, and suppose that over the next decade its multiple drifts back toward the market’s — the usual fate of a rich multiple as growth matures. Your ten-year return is then earnings growth working against a shrinking multiple:
Total return = (growth factor over 10 years) × (ending multiple ÷ starting multiple) − 1
Run the arithmetic. If earnings grow 10% a year — tripling the business’s profit in a decade, a genuinely strong result — but the multiple falls from 40 to 15, your stock returns almost nothing, because the near-tripling of earnings is very nearly canceled by the multiple shrinking to three-eighths of where it started. To simply break even over the decade, this stock needs earnings to compound at about 10.3% a year, every year, for ten years — and that is the reward for merely standing still. Everything below that line is a loss on a company that grew the whole time.
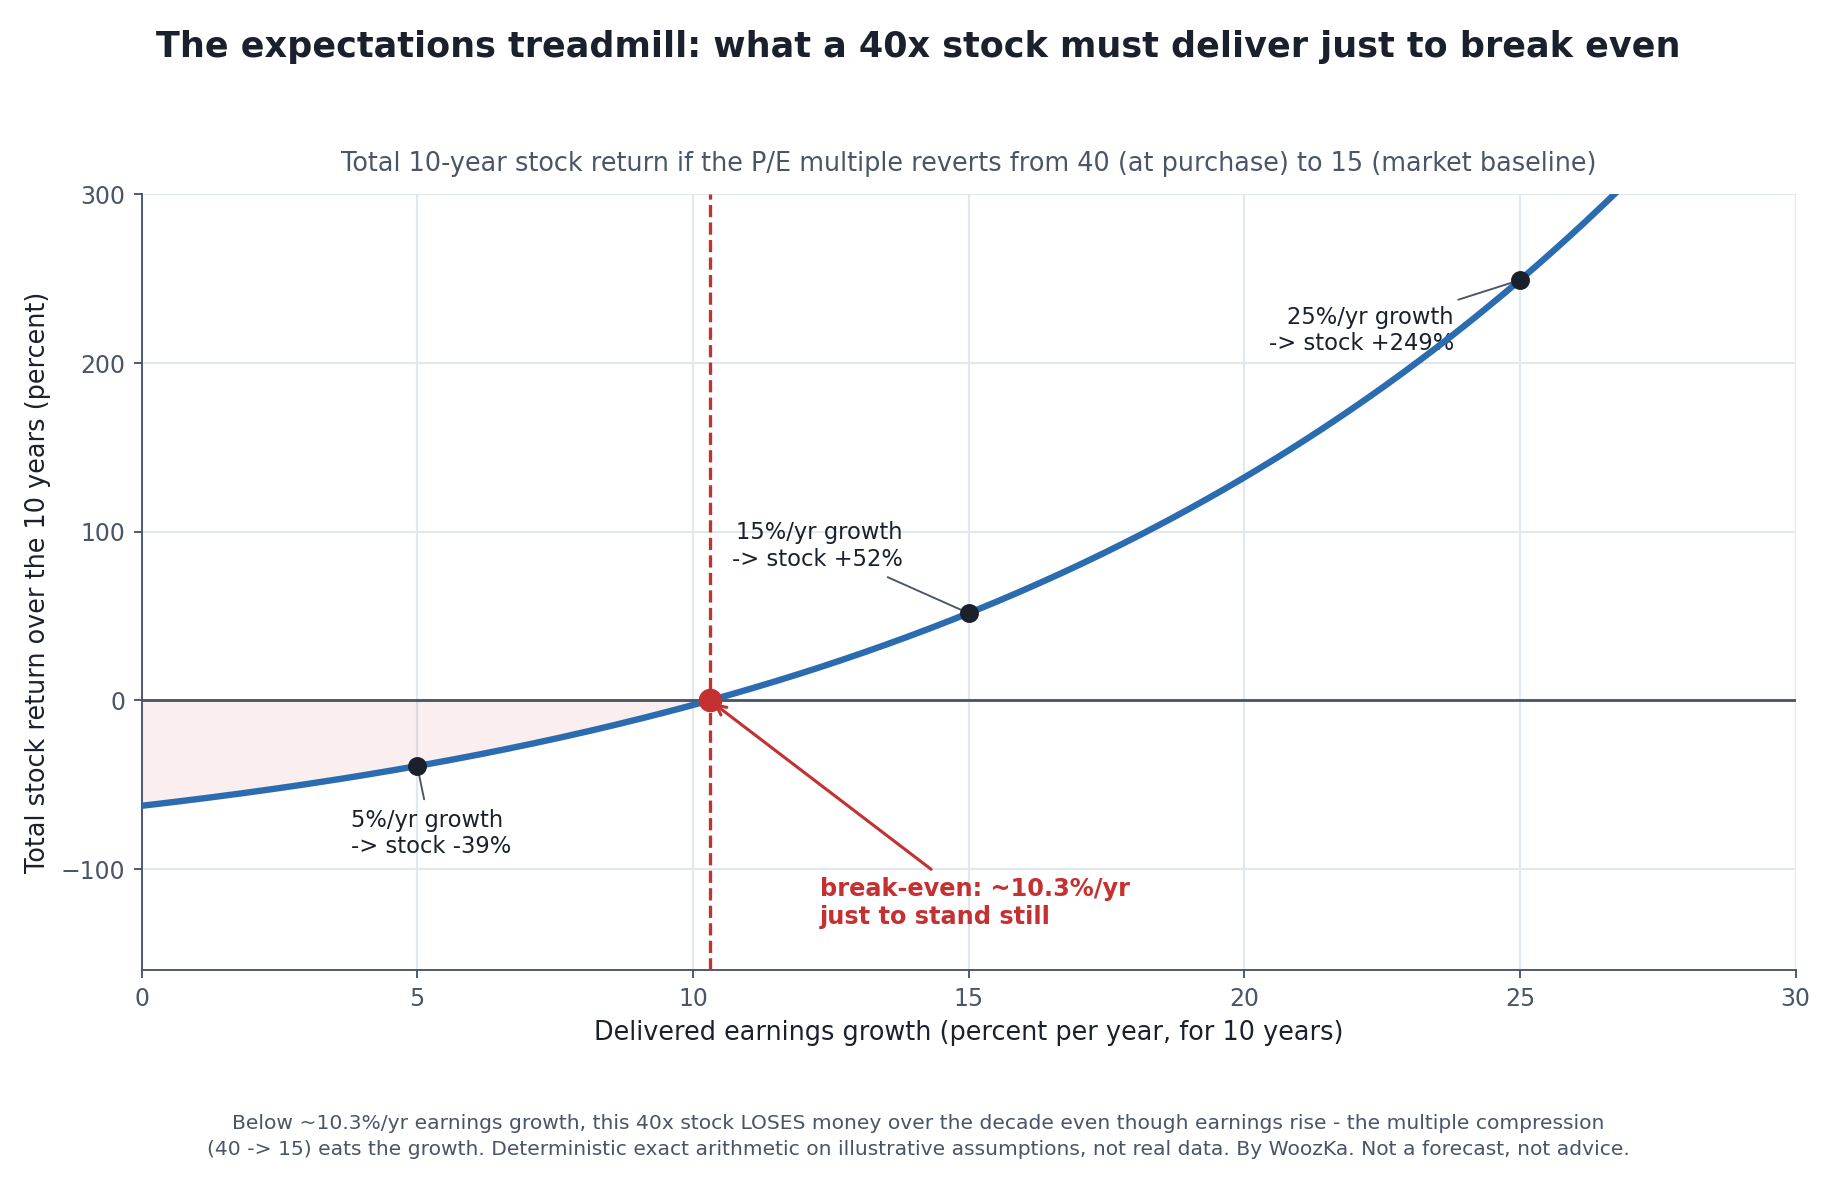
The treadmill drawn out. The steeper you buy — the higher the starting multiple — the faster you have to run just to keep still, because a rich multiple has only one way to go over time. Growth that would thrill a business owner can still leave the stockholder underwater once the entry price is paid back to the market.
Two honest points about this picture. First, the exact break-even depends on the assumptions (how far and how fast the multiple reverts), which is why the chart is labeled illustrative rather than a claim about any real stock — but the shape is general: a higher starting multiple always raises the growth bar. Second, this is not an argument against growth. It is an argument against overpaying for it. A stock at 40 times earnings that grows 25% a year for a decade returns a fortune, treadmill and all. The style’s edge lives entirely in whether the growth you’ll get is above or below the growth you’re paying for.
Two Real Round Trips: Cisco and Microsoft
This is not a theoretical hazard. It is one of the best-documented patterns in market history, and the two cleanest cases are two of the greatest companies of their era.
Cisco Systems closed at an all-time high of $80.06 on March 27, 2000, when it briefly became the most valuable company on earth [source: CNBC, “Cisco’s stock closes at record for first time since dot-com peak,” Dec 10, 2025; the March 27, 2000 peak of $80.06]. Its business did not collapse — Cisco kept selling the plumbing of the internet, growing revenue and profit for the next quarter-century. But the stock lost about 90% of its value into the 2002 bottom and did not close above its 2000 high again until December 2025, more than 25 years later [source: CNBC, Dec 10, 2025; Cisco reached a new high of $80.82]. Shareholders who bought a magnificent, growing company at the wrong price waited a generation to get their money back, nominal — and far longer in real, inflation-adjusted terms.
Microsoft tells the quieter, more instructive version. It peaked near $58.72 in December 1999 and did not durably exceed that price until 2016 — sixteen years of what the market nicknamed “dead money” [source: GeekWire, “Microsoft closes week at all-time stock high of $59.66,” 2016]. And yet the business boomed the entire time: earnings per share roughly tripled across those years. Every cent of that growth went into paying down the valuation, not into the stock, because Microsoft’s price-to-earnings multiple compressed from about 83 at the 1999 peak to about 28 by the time the stock finally broke even (a flat price while earnings roughly tripled requires exactly that: the multiple falling to about a third of its peak) [source: arithmetic on the sourced numbers — each closing price above divided by Microsoft’s reported diluted earnings per share: 0.71 dollars for fiscal 1999, restated for the February 2003 two-for-one split in Microsoft’s fiscal 2003 Form 10-K so that it stands on the same split basis as the prices, and 2.10 dollars for fiscal 2016 as reported in that year’s Form 10-K]. The company did superbly. The stock did nothing for sixteen years. The difference was the price the buyer paid in 1999.
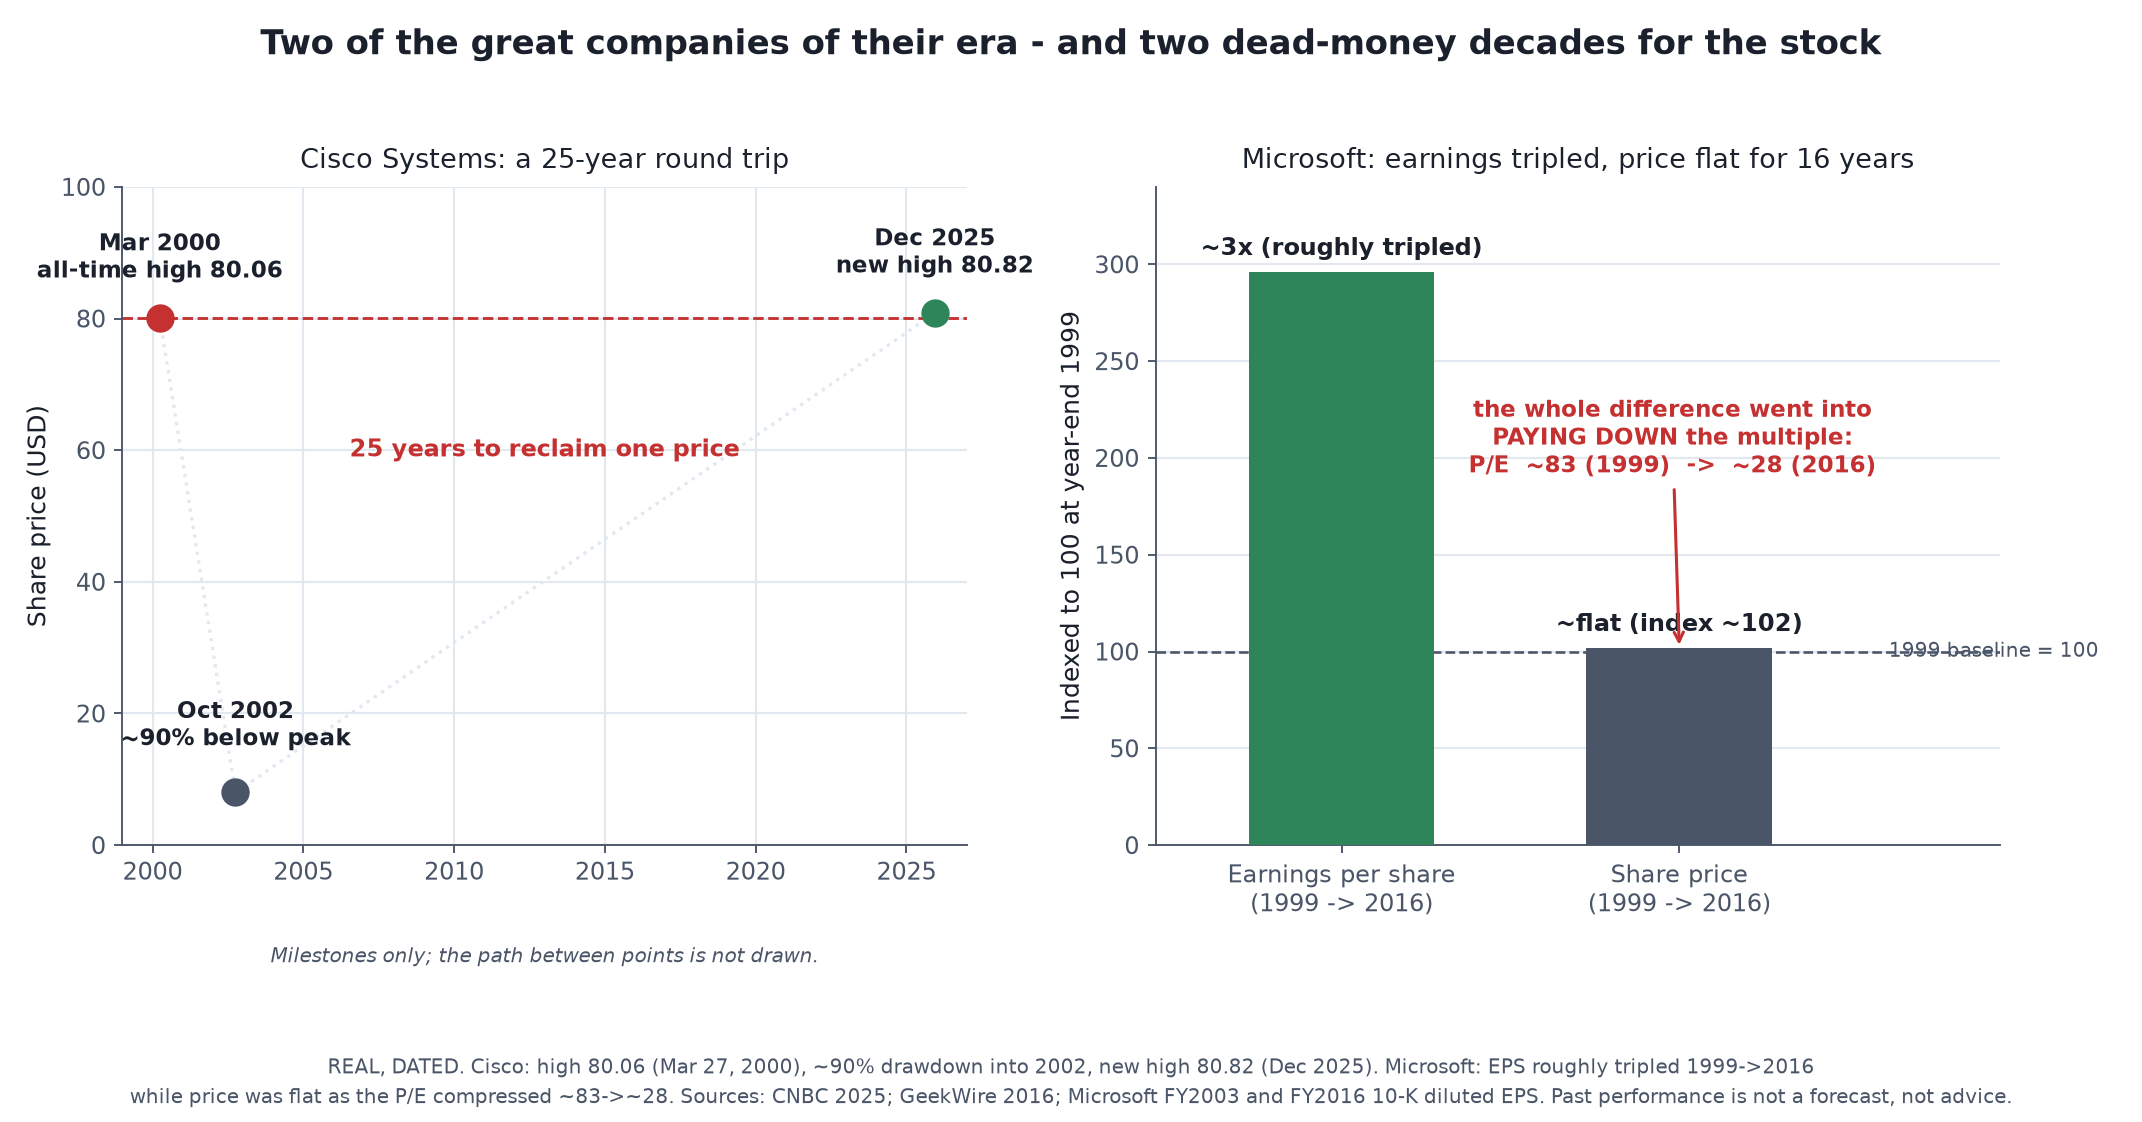
Two of the finest businesses of their generation were dead money for 16 and 25 years — not because they stumbled, but because their 1999–2000 prices had already priced in decades of the growth they went on to deliver. This is the expectations treadmill in real life: the company ran hard, and the stock stood still while the valuation came back to earth.
The Price You Pay Is the Whole Variable
If the treadmill chart varied the growth and held the price fixed, the other half of the lesson is what happens when you hold the growth story roughly fixed and vary the entry price. It is the cleanest way to see that in growth investing the valuation you pay is not a detail — it is very nearly the entire outcome.
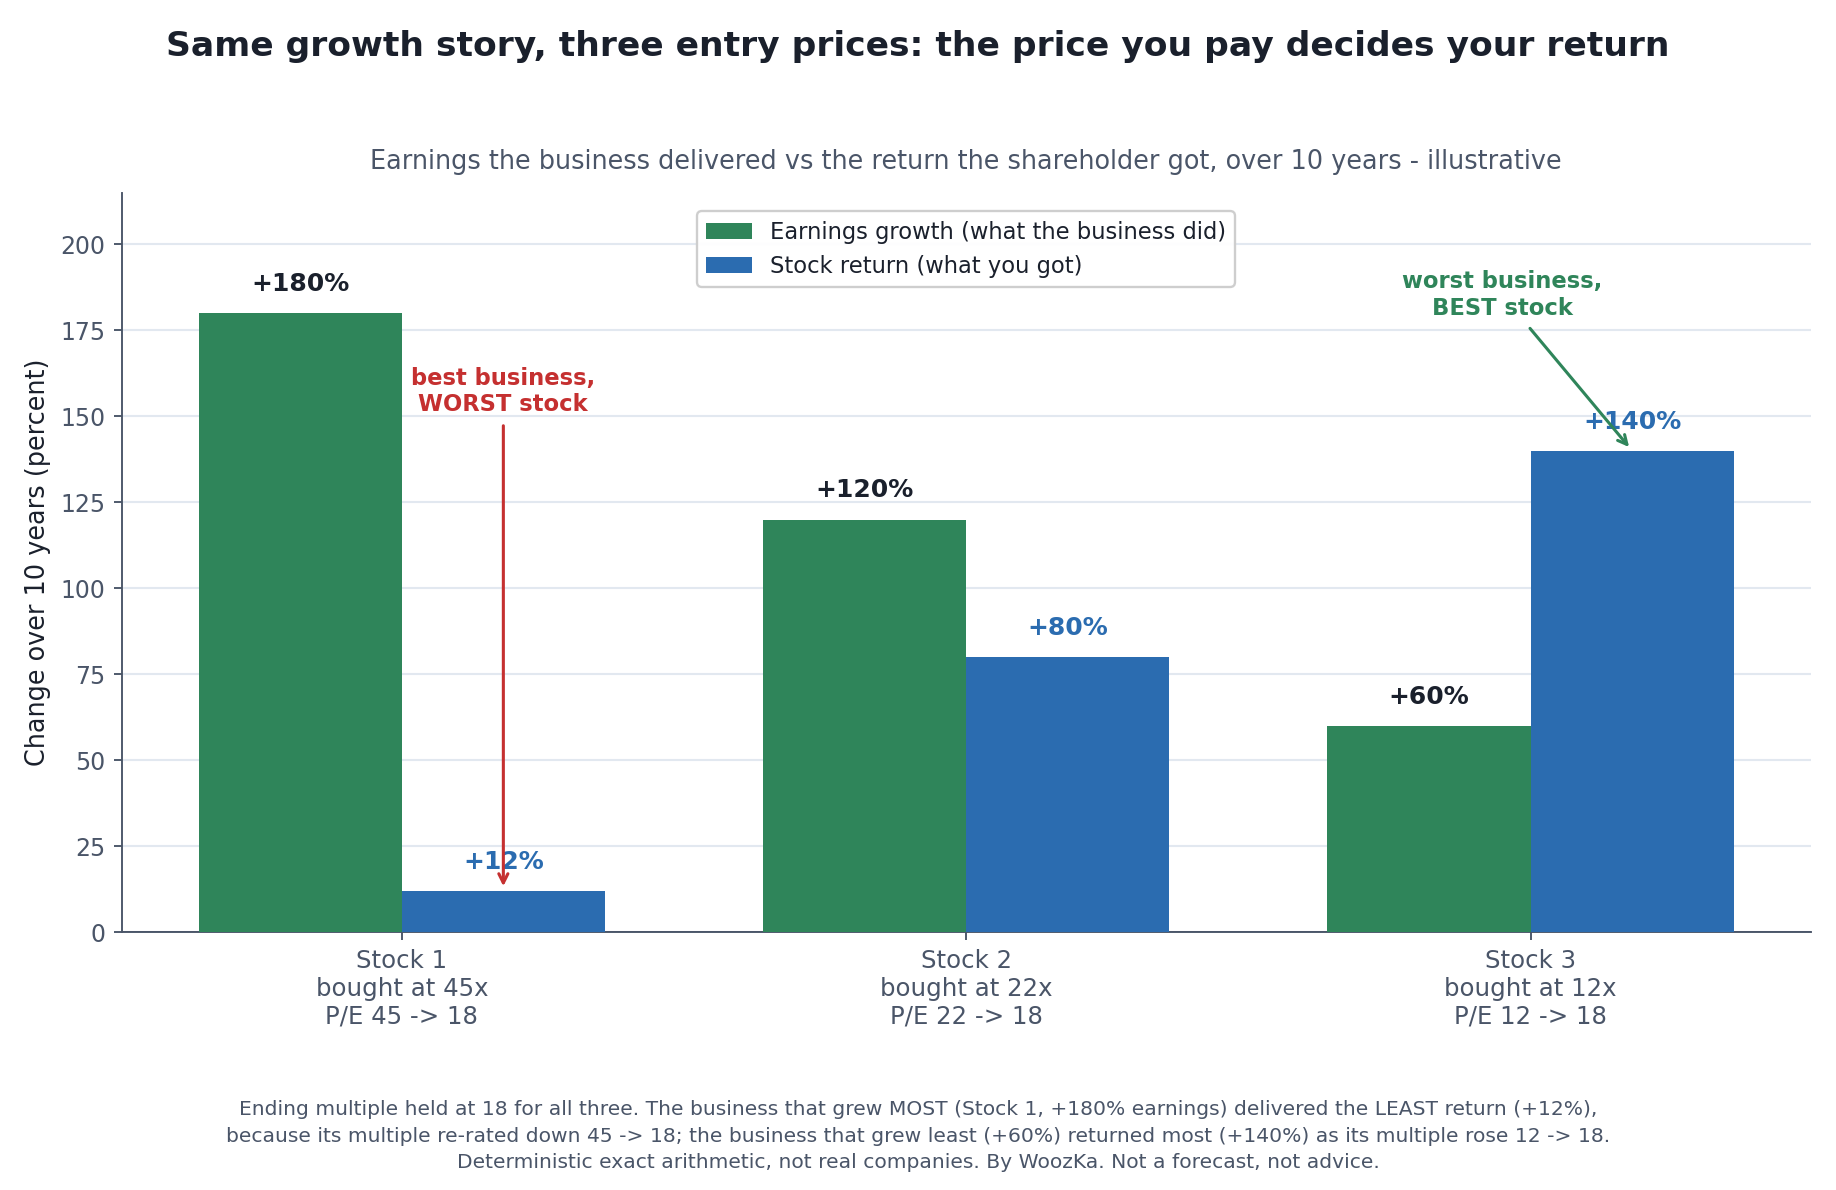
The most counterintuitive chart on the page. Ranked by how well the business grew, the order is Stock 1, Stock 2, Stock 3. Ranked by what the shareholder earned, the order reverses. The only thing that changed was the multiple each buyer paid at the door — proof that in growth investing, “great company” and “great investment” are different claims, joined only by price.
Notice what this does not say. It does not say cheap always wins or that growth is a mistake — Stock 3’s re-rating up is exactly the mirror risk in reverse, and paying up for a company that then grows into and beyond its multiple is how the genuine growth winners are made. It says that the return you earn is always earnings growth times the change in the multiple, and that the multiple you pay going in fixes how much of that second term is working for you or against you. Ignore it and you are betting on only one of the two forces that move your stock.
The entry fee, priced across every multiple you might pay
The treadmill chart earlier fixed one case: in at 40x, out at 15x. But the entry multiple is a choice, and it is the variable this section is about. Here is the same arithmetic run across the grid — each cell is the earnings growth a company must deliver every year for ten years for its shareholder to end exactly where they started:
| Breakeven annual earnings growth | Exit at 12x | Exit at 15x | Exit at 18x | Exit at 20x |
|---|---|---|---|---|
| You pay 20x | 5.2% | 2.9% | 1.1% | 0.0% |
| You pay 30x | 9.6% | 7.2% | 5.2% | 4.1% |
| You pay 40x | 12.8% | 10.3% | 8.3% | 7.2% |
| You pay 60x | 17.5% | 14.9% | 12.8% | 11.6% |
The column you exit in barely matters next to the row you enter in. Buy the same company at 20x and, if the multiple settles at 15x, you need 2.9% a year to stand still. Buy it at 60x and you need 14.9% — a decade of growth most companies never manage, bought purely to break even. Same business, same decade, same exit; the only thing that changed was the price on the day you bought it. That is what “the price you pay is the whole variable” means once it is a number.
And the reward for clearing the bar, or missing it, from the 40x entry the article has been using:
| If earnings actually grow | Exit at 12x | Exit at 15x | Exit at 18x | Exit at 20x |
|---|---|---|---|---|
| 5% a year | -51% | -39% | -27% | -19% |
| 10% a year | -22% | -3% | +17% | +30% |
| 15% a year | +21% | +52% | +82% | +102% |
| 20% a year | +86% | +132% | +179% | +210% |
| 25% a year | +179% | +249% | +319% | +366% |
Look at the 10% a year row. A decade of double-digit compounding — a genuinely strong operating result that most companies do not deliver — returns -3% if the multiple lands at 15x, and -22% if it lands at 12x. The company did everything asked of it. The shareholder got nothing, because the forecast was already in the price on the way in.
One trap worth naming, because it is the intuitive way to do this and it is wrong. It is tempting to add the two effects: earnings up 159%, multiple down -62%, so call it roughly +97% and feel good. They do not add, they multiply, and the true answer is -2.7%. The shortcut is off by about a hundred percentage points and it errs in the flattering direction — which is exactly why it survives in people’s heads.
No market data is used and no company is named. The multiples, the growth rates and the ten-year horizon are stated inputs; what is shown is the identity relating them, which holds whatever stock you had in mind. Real multiples do not glide smoothly to a resting place, and a business that compounds at 25% for a decade may well deserve to keep a rich multiple — the grid is the arithmetic of the trade, not a forecast of where any multiple will land.
Method: total return over ten years is the growth factor (1 + g)10 multiplied by the ratio of ending to starting multiple, minus one; the breakeven rate inverts that to (start ÷ end)1/10 − 1. The script asserts that total return is exactly zero at every breakeven rate in the grid, that the closed-form growth factor matches year-by-year compounding, that an unchanged multiple reduces the result to pure earnings growth, that breakeven rises with the entry multiple, and that annualizing round-trips. It also reproduces this article’s own 10.3% figure from scratch rather than accepting it.
What the Style Costs You
Every style teaches best when you say plainly what it costs, so here it is for growth, without softening:
- You can be right about the company and wrong about the stock. This is the signature failure mode. Correctly identifying a great, fast-growing business is necessary but nowhere near sufficient; if its price already assumed that greatness, your reward for being right is zero, as Cisco and Microsoft holders learned across 16 to 25 years.
- A high multiple is a high bar you must clear every year. The richer the price, the faster the required growth — and required growth compounds. A company that grows fast but merely well, rather than spectacularly, can see its stock fall for years as the multiple reverts, even with rising earnings.
- Multiple compression is a headwind you did not choose and cannot control. How the market re-rates your stock depends on rates, sentiment, and the maturing of the growth story — none of which you steer. You chose the entry price; the market chooses the exit multiple.
- The feedback is cruel and slow. Because the business keeps doing well, every instinct says hold, and the stock can punish that instinct for a decade. Nothing in the earnings tells you that you overpaid; only the price does, and it tells you slowly.
None of that makes growth investing a bad style. It makes it a specific style with a specific discipline attached: the discipline of valuing the growth you are buying, not just admiring it. Growth investing done honestly is not “buy great companies.” It is “buy great companies only when the price does not already assume more greatness than they can deliver” — which is why the most defensible retail expression of a growth tilt is a broad growth index fund that owns the whole bucket, capturing the rare stocks that beat their embedded expectations without requiring you to pick them in advance. The concentrated, pay-any-price version asks you to out-forecast a market that has already written its forecast into the tag.
It took me an embarrassingly long time to separate “this is a great company” from “this is a great stock.” They’re not the same sentence, and the market quietly charges you for confusing them.
If you have ever held a company that kept posting terrific results while its stock went nowhere, and wondered what you were missing, the answer may be that you missed nothing about the business — you simply paid for growth the price had already spent. Knowing that in advance is the difference between a risk you priced and one that priced you.
Where to Go Next
- Growth Investing Is a Bet on Duration — the companion growth-style piece and the other half of this one. That article is the discount-rate (denominator) mechanism; this is the expectations (numerator) mechanism. Together they explain almost everything that moves a growth stock.
- Growth vs Value Investing: Which Approach Fits Your Goals? — the head-to-head comparison of the two styles, if you want the value side of the ledger.
- What Is Overfitting in Backtesting — why reading one favorable stretch as proof of a superior style is a trap.
- Nominal vs Real Return: Why Your 7% Isn’t 7% — because a 16-to-25-year round trip that only breaks even nominally is a real loss once inflation is counted.
If you want the plain-English, rigor-first read on styles and the mechanisms under them — explained honestly, never hyped — that is what the newsletter is for. Subscribe below.
Disclaimer: This article is educational content, not financial advice. I am not a licensed financial advisor, and nothing here is a recommendation to buy or sell any security or asset. Investing and trading involve risk, including the possible loss of the money you invest. Do your own research and consider consulting a licensed financial professional before making investment decisions. Read the full Disclaimer.
Historical and backtested results are hypothetical, carry inherent limitations, and do not guarantee future results. Figures were accurate to the best of my knowledge as of this article’s last-updated date and may have changed.
