The Difference Between Trading and Investing (And Why It Matters)
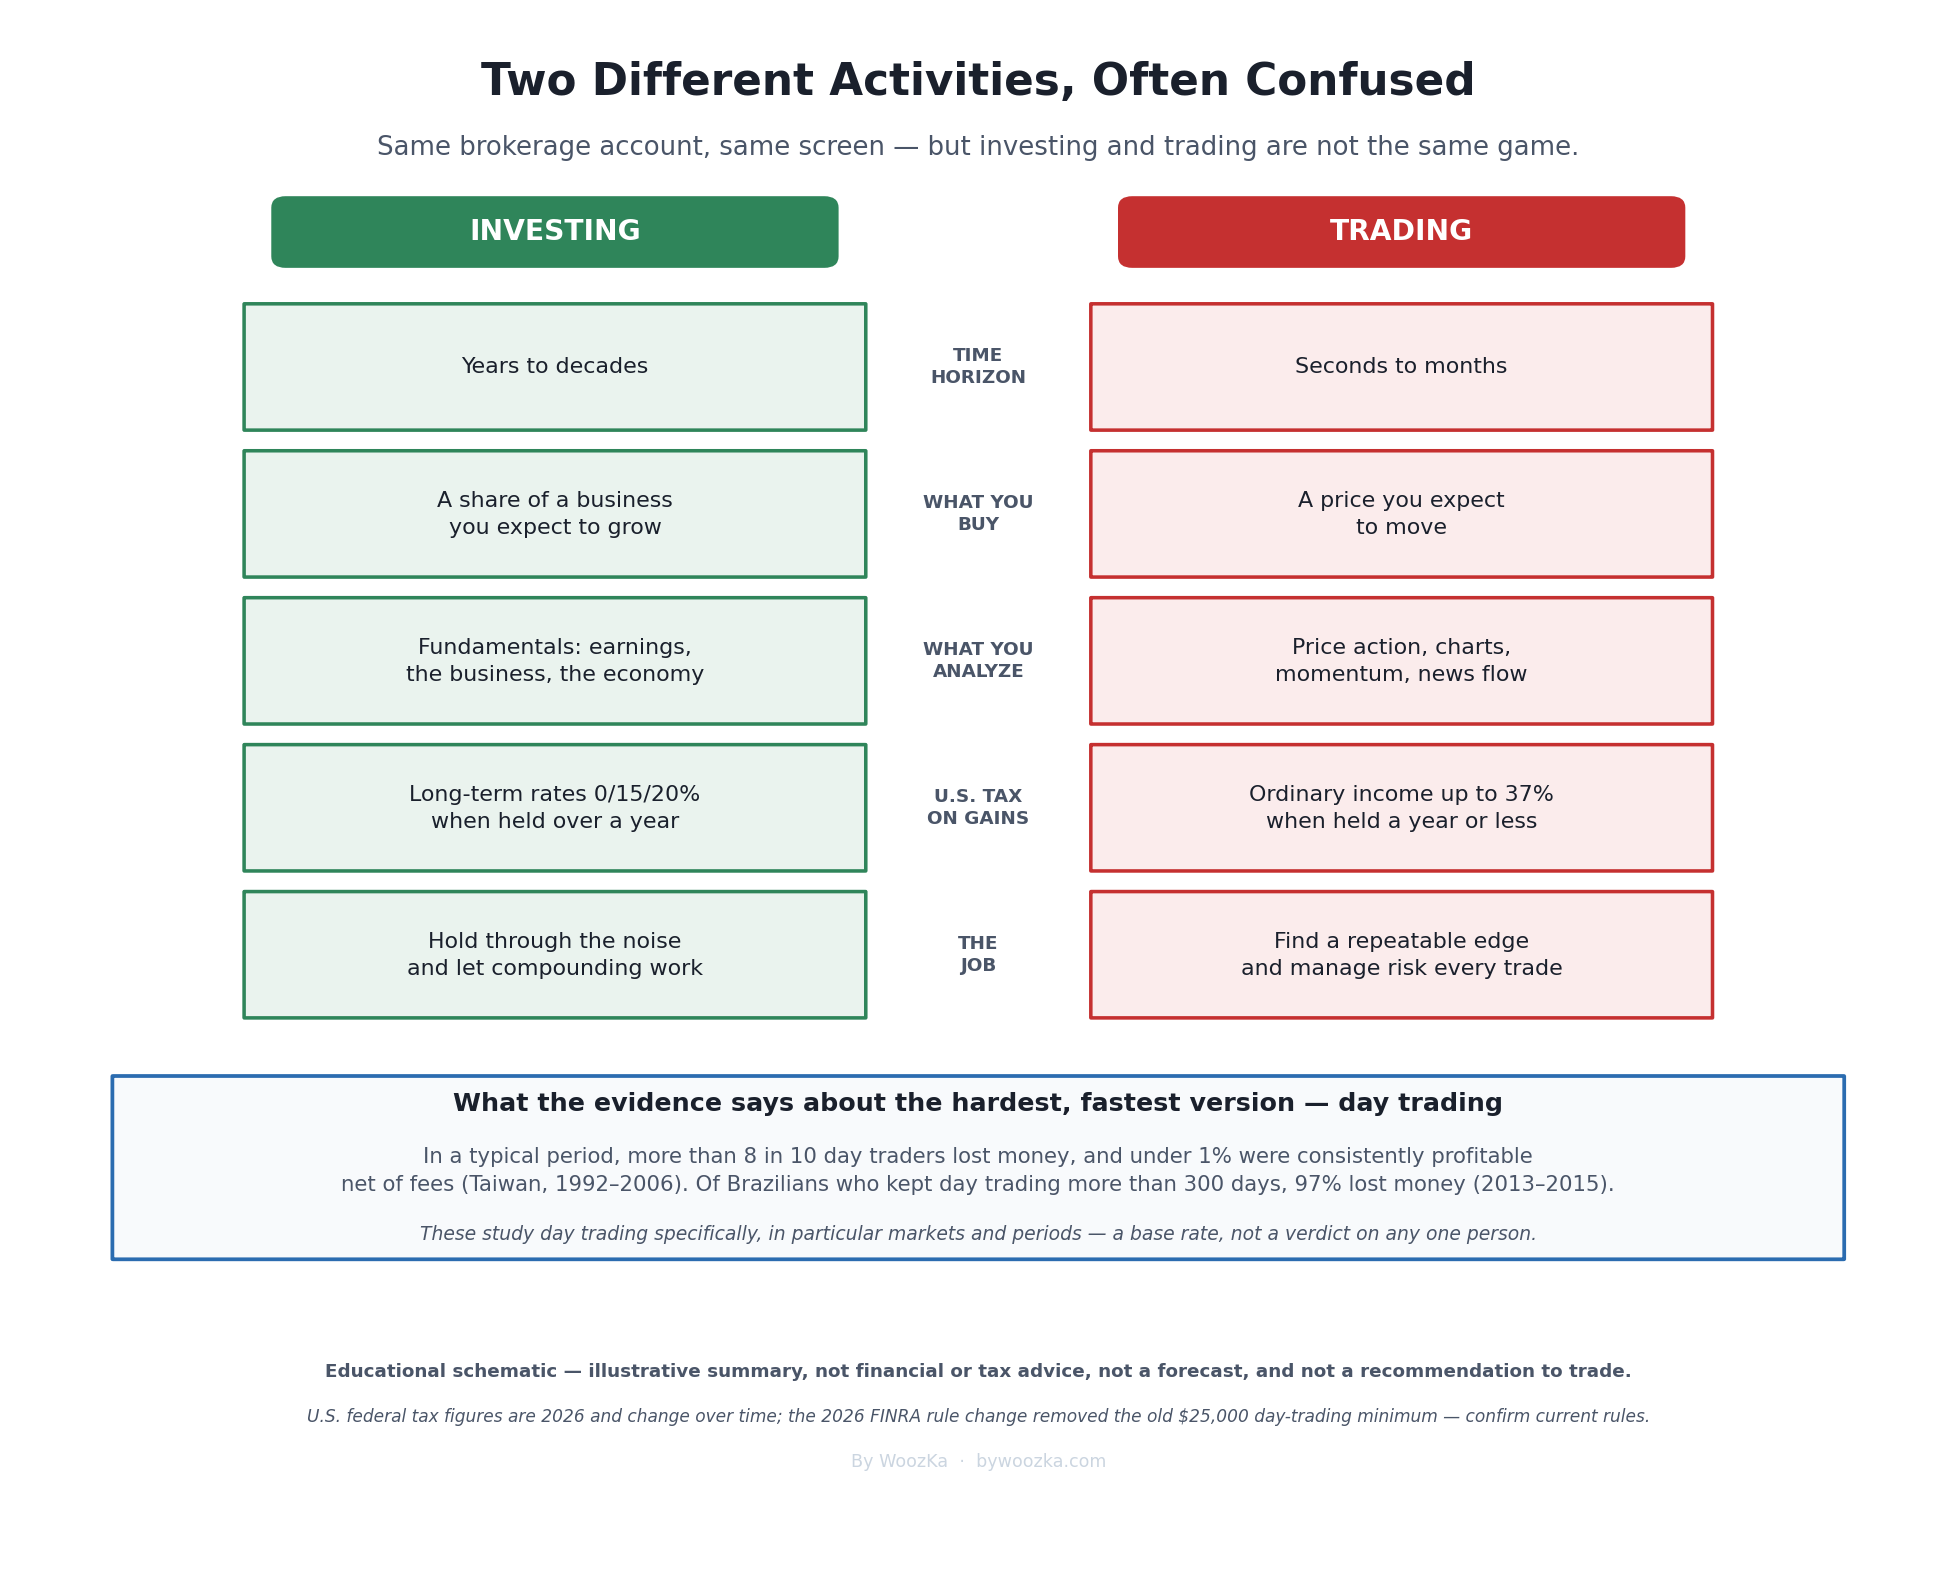
People use “trading” and “investing” as if they’re the same thing done at different speeds. They’re not. They’re two different activities with different time horizons, different tax treatment, and — for the fast, speculative end of trading — very different odds. Educational schematic, not advice.
“Trading” and “investing” get used interchangeably in everyday conversation. Someone says they’re “investing in a stock” when they bought it yesterday and plan to sell it next week; someone else says they “trade index funds” when they’ve held the same three funds for a decade. The words blur together, and that blur is not harmless. Confusing the two is one of the most expensive mistakes a beginner can make, because the strategy, the tax bill, the mindset, and the realistic odds are all different depending on which one you’re actually doing.
This guide lays out the real difference — not as a value judgment about which is “smarter,” but as a practical distinction you need in order to know what game you’re playing. We’ll cover the core split (time horizon and what you’re really buying), the difference the tax code cares about, a rule change in 2026 that reshaped the mechanics of active trading, and — most importantly — what decades of data actually say about how short-term trading tends to go. If you haven’t opened an account yet, start with the pillar for this section, How to Open Your First Brokerage Account, because everything below assumes you can see real quotes and place real orders.
The One-Sentence Difference
Strip away the jargon and it comes down to time and to what you’re actually buying.
An investor buys a slice of something they expect to grow, and plans to hold it for a long time — years, often decades. When you invest in a broad stock fund or a share of a solid business, you’re buying a claim on future earnings, dividends, and growth. Your thesis is the thing I own will be worth more later because the underlying business (or basket of businesses) grows. [source: U.S. Securities and Exchange Commission investor education, investor.gov; FINRA, “Investing Basics”]
A trader buys a price they expect to move, and plans to sell it soon — sometimes within seconds, sometimes within weeks. When you trade, you generally don’t care much about where the company will be in ten years; you care about where the price will be by your exit, which might be this afternoon. Your thesis is this price is going to move in my favor, and I’ll be out before the story changes. [source: Investopedia, “Investing vs. Trading: What’s the Difference?”]
That’s the whole distinction in a sentence: investing is about owning something as it grows; trading is about profiting from the move. Everything else — the tax treatment, the tools, the psychology, the odds — flows from that difference in time horizon.
The two activities side by side. Same brokerage account, different job.
| Investing | Trading | |
|---|---|---|
| Time horizon | Years to decades | Seconds to months |
| What you are buying | A share of a business you expect to grow | A price you expect to move |
| What you analyze | Fundamentals — earnings, the business, the economy | Price action, charts, momentum, news flow |
| Typical US tax on gains | Long-term rates (0/15/20%) if held more than a year | Ordinary-income rates (up to 37%) on anything held a year or less |
| The job | Hold through the noise and let compounding work | Find a repeatable edge and manage risk on every position |
Investing: Owning a Slice of Something That Grows
The investor’s entire edge is time. Historically, the broad stock market has trended upward over long periods despite frequent, sometimes brutal, interruptions — and the longer your holding period, the more the odds have worked in a diversified holder’s favor. This is why the recurring advice on this site is about staying invested rather than jumping in and out: the evidence on dollar-cost averaging and why most investors underperform all points the same direction — the hard part of investing isn’t picking, it’s holding.
Investors typically make decisions based on fundamentals — a company’s earnings and the story behind them. Tools like the P/E ratio and an earnings report exist to help you judge a business, not to time a price. An investor accepts that the price will swing violently in the short run and treats those swings as noise around a long-term trend, not as signals to act. The goal is to let compounding do the heavy lifting over years, which it can only do if you leave the money alone.
That patience is not glamorous, and it is exactly why it works. There’s no adrenaline in “I bought a diversified fund and did nothing for eleven years,” but doing nothing is frequently the highest-skill move available to an investor.
Trading: Trying to Profit From the Move, Not the Business
Trading is a fundamentally different activity that happens to use the same brokerage account. A trader is trying to profit from short-term price movements, so the analysis shifts from is this a good business? to where is this price likely to go next, and how will I manage the risk if I’m wrong? Traders lean on price action, charts, momentum, volume, and news flow rather than long-term fundamentals [source: Investopedia, “Investing vs. Trading”]. Common styles sit on a spectrum of speed: position traders hold for weeks or months, swing traders for days to weeks, day traders open and close within the same day, and scalpers hold for seconds to minutes.
The critical thing to understand is that trading is a skill-based job with an entry cost, not “investing but faster.” A profitable trader needs a genuine, repeatable edge — some tendency in prices they can exploit more often than not — plus strict risk management on every single position (position sizing, stop-losses, and the discipline to take small losses rather than let them run). Even in a world of zero-commission trades, a trader still pays the bid-ask spread on every round trip and, in a taxable account, a heavier tax bill (more on that next). Those costs compound against frequency: the more you trade, the more friction you feed.
None of this makes trading illegitimate. Skilled professional traders and market makers exist and earn a living. But it does mean trading is not a shortcut around the patience that investing requires — it’s a different, harder job with its own tuition.
The Difference the IRS Cares About
Here’s a concrete, dollars-and-cents difference that catches many beginners by surprise: how long you hold something changes how the gain is taxed (in the United States).
The dividing line is one year. If you sell an asset you’ve held for more than one year, any profit is a long-term capital gain, taxed at preferential rates of 0%, 15%, or 20% depending on your income (2026 figures) [source: IRS, “Topic no. 409, Capital gains and losses,” irs.gov]. If you sell something you’ve held for one year or less, the profit is a short-term capital gain, taxed as ordinary income — the same brackets as your paycheck, ranging up to 37% federally, with a possible additional 3.8% net investment income tax at higher incomes [source: IRS Topic no. 409; NerdWallet, “2025 and 2026 Capital Gains Tax Rates”].
Sit with what that means. Two people can make the exact same $10,000 gain on the exact same stock, and the one who held it thirteen months can owe dramatically less tax than the one who held it eleven months — potentially the difference between a 15% and a 37% federal rate on that gain. Because trading, by definition, means selling quickly, active traders in taxable accounts tend to generate mostly short-term gains taxed at those higher ordinary rates. That’s a structural headwind on frequent trading that has nothing to do with whether your individual trades are any good.
Two honest caveats. First, these rates and income thresholds are current as of 2026 and change over time — confirm the numbers for your own situation and filing status, and note this is U.S. federal treatment only. Second, this all applies to taxable brokerage accounts; inside tax-advantaged retirement accounts (like an IRA or 401(k)), you generally don’t owe capital-gains tax on trades within the account, which changes the calculus. This is general education, not tax advice — a tax professional can tell you how it applies to you.
The Rules Around Active Trading Just Changed (2026)
If you read older articles about day trading, you’ll see a lot about the “Pattern Day Trader” (PDT) rule and a $25,000 minimum. That guidance is now out of date, which is itself a useful lesson in always confirming current rules.
For over two decades, FINRA’s rules defined a “pattern day trader” as anyone who made four or more day trades within five business days in a margin account, and required such accounts to hold a minimum equity of $25,000 [source: FINRA, “Understanding the New Intraday Margin Requirements,” finra.org, April 2026, describing the prior rule]. As of June 4, 2026, FINRA replaced the pattern-day-trader rules with new “intraday margin requirements.” Under the new approach there is no $25,000 minimum equity requirement and no “pattern day trader” designation based on counting trades; instead, your firm monitors your account to ensure you maintain adequate equity during the trading day relative to your open positions, and repeatedly failing to cover an intraday margin deficit can get your account restricted for up to 90 days [source: FINRA, “Understanding the New Intraday Margin Requirements,” April 20, 2026; FINRA Regulatory Notice 26-10]. There’s an extended transition window (through October 20, 2027) during which some brokerages may still operate under the old rules, so the exact mechanics you’ll face depend on your firm — contact them to be sure [source: FINRA, same].
Two things worth underlining. First, this is exactly why every rule and number on this site is date-stamped and caveated with “confirm current” — even the regulatory plumbing changes. Second, FINRA’s own guidance is blunt that removing the $25,000 floor does not make frequent trading safer: it describes trading with margin as remaining “a high-risk activity that requires careful management of your funds,” and reminds traders to “only use money that you can afford to lose” [source: FINRA, same]. A rule getting easier is not the market getting easier.
What the Evidence Actually Says
This is the part that gets left out of most “trading vs investing” explainers, and it’s the part that matters most. When researchers have looked at the actual trading records of real people, the results for short-term, active trading have been consistently sobering.
The landmark study is Barber and Odean’s “Trading Is Hazardous to Your Wealth” (2000), which examined the accounts of 66,465 U.S. households at a large discount broker from 1991 to 1996. The households that traded the most earned an average annual net return of about 11.4%, while the market returned roughly 17.9% over the same period — a punishing gap, driven by the costs and mistakes of frequent trading [source: Barber & Odean, “Trading Is Hazardous to Your Wealth,” Journal of Finance 55 (2000); working paper at faculty.haas.berkeley.edu/odean]. Their one-line explanation has become famous in behavioral finance: overconfidence leads people to trade too much, and trading too much lowers returns.
It gets starker at the extreme, fast end — day trading. Studying the complete records of the Taiwan market from 1992 to 2006, Barber, Lee, Liu, and Odean found that in a typical six-month period more than eight out of ten day traders lost money, and fewer than 1% were able to earn profits reliably, net of fees [source: Barber, Lee, Liu & Odean, “Do Day Traders Rationally Learn About Their Ability?” / “Do Individual Day Traders Make Money? Evidence from Taiwan,” faculty.haas.berkeley.edu/odean]. A separate study of Brazilian equity-futures day traders from 2013 to 2015 found that among people who persisted at it for more than 300 trading days, 97% lost money, and only about 1% earned more than the Brazilian minimum wage [source: Chague, De-Losso & Giovannetti, “Day Trading for a Living?” (2020), widely cited working paper].
Read these numbers carefully, because it’s easy to over-read them. They study day trading specifically — the most extreme, highest-frequency version of trading — in particular markets and time periods; they are not proof that “all trading always loses” or a prediction about any one person. Skilled traders exist. But the base rate is brutal and remarkably consistent across countries and decades: the faster and more frequently people trade, the more likely they are to underperform a simple buy-and-hold approach, and the small minority who profit consistently at high frequency are exactly that — a small minority. If you go in, go in with eyes open, small money you can afford to lose, and no illusion that you’re the default case rather than the exception.
Neither Is “Better” — But Confusing Them Is Dangerous
Both trading and investing are legitimate activities. The real danger isn’t picking the “wrong” one — it’s doing one while telling yourself you’re doing the other.
The most common version is treating a trade like an investment. You buy something for a quick pop, it drops instead, and you suddenly become a “long-term investor” in it — not because you believe in the business, but because you can’t stomach the loss. The short-term trade with no exit plan quietly turns into a bag you hold for years, hoping it “comes back.” That’s not investing; it’s a losing trade wearing an investor’s costume.
I’ll put my own version of this on the table, because I lived the mislabeling problem from the inside. My account was small, and I talked myself into the idea that a long-term plan simply couldn’t do anything useful with that little money — so the faster route was to learn to trade my way up to a number worth investing. Early on I made money, and I filed that away as ability rather than luck. The size went up accordingly. Then a position went against me, and instead of taking the loss I reclassified it: this wasn’t a bad trade anymore, it was something I’d hold until it came back. Admitting otherwise meant admitting I’d been wrong. I held until the loss was too big to have a choice about. That cycle ran more than once, and what compounded across those years was the losses, not the balance. A fixed amount into an index fund over the same stretch — or, frankly, leaving it in savings — would have left me better off than all that effort did.
The mirror image is treating an investment like a trade — panic-selling a diversified, long-term holding during a scary week because it feels like you should “do something,” locking in a loss and often missing the recovery. The research on missing the market’s best days shows how costly that reflex can be, since the biggest up-days cluster shockingly close to the worst ones.
The fix is to decide in advance, for every position, which activity it is. An investment has a long time horizon and a thesis about the underlying business; a trade has a defined entry, a defined exit, and a predetermined amount you’ll lose if you’re wrong. Write it down before you buy. The label determines everything that follows — how you’ll react to a drop, how long you’ll hold, and how the gain gets taxed.
The Headwind, Priced
Two sections above are describing the same force from opposite ends, and they never meet in the middle. The tax section names a rate gap, sets up a $10,000 example, and stops one multiplication short of the answer. The evidence section names a return gap and never asks what tax does to it. Both halves are already on this page and already sourced, so joining them needs nothing but arithmetic.
One boundary before any of it. Everything here is US federal income tax only, in a taxable brokerage account, at the rates this article already cites. The three studies quoted earlier stay inside their own countries and decades; none of their percentages is combined with another’s, because a figure built that way would belong to no study at all. Nothing below introduces a fact this article does not already publish.
What One Year and One Day Is Worth
Start with the example the article sets up and leaves unfinished: the same $10,000 gain, one person selling at thirteen months and the other at eleven. At the top ordinary rate the eleven-month seller owes $3,700.
| Long-term rate | Tax owed | Gap vs 37% | Gap if 3.8% applies |
|---|---|---|---|
| 0% | $0.00 | $3,700.00 | Does not arise |
| 15% | $1,500.00 | $2,200.00 | $2,200.00 |
| 20% | $2,000.00 | $1,700.00 | $1,700.00 |
The pair the article singles out, 15% against 37%, is worth exactly $2,200.00. Two days of calendar on either side of the one-year line move that much money, and nothing else about the two sales differs.
The last column is the one worth reading twice. The article introduces the extra 3.8% in the same breath as short-term gains, which invites you to attach it to the trading side of the comparison. It does not attach there. That surcharge turns on income, not on how long you held, and both kinds of capital gain count toward it — so wherever it lands at all, it lands on both sales equally. It adds $380.00 to each bill and exactly $0.00 to the distance between them. The one row where the question does not arise is the 0% row, and for a reason the article supplies itself: the zero rate belongs to the low end of the income range and the surcharge to the high end, so the two never meet in the same taxpayer.
The Same Fact as a Hurdle
The article calls this “a structural headwind on frequent trading that has nothing to do with whether your individual trades are any good.” That is exactly right, and a headwind has a size. Measure it the way a trader would actually feel it: not as a bill, but as how much more you have to make before tax to end up with the same money in hand.
| Long-term rate | Short-term rate | Trader must earn | Uplift needed |
|---|---|---|---|
| 0% | 37.0% | $15,873.02 | +58.73% |
| 15% | 37.0% | $13,492.06 | +34.92% |
| 20% | 37.0% | $12,698.41 | +26.98% |
| 18.8% | 40.8% | $13,716.22 | +37.16% |
| 23.8% | 40.8% | $12,871.62 | +28.72% |
Each row asks the same question: the long-term seller banks a $10,000 gain and keeps what the rate leaves — $8,500.00 in the middle row — so what must the short-term seller earn before tax to walk away with that identical amount? On the article’s headline pair the answer is $13,492.06. The trader has to be 34.92% better, every year, permanently, just to draw level. The bottom two rows repeat the exercise with the 3.8% surcharge added to both sides.
Two things fall out of that table which the dollar figures above cannot show.
The first is that the gain cancels out of the algebra. What the trader needs is the ratio of the two amounts left after tax, and the size of the position never enters it, so the same 34.92% governs a $100 gain and a $100,000 one. Framing the difference as $2,200 makes it sound like a problem that arrives once your account is large. It is a rate, and it is completely blind to how much money you have.
The second is that the 3.8% surcharge, which was exactly neutral a moment ago, is not neutral here at all: it lifts the requirement from 34.92% to 37.16%. Both readings are correct, and the disagreement is the useful part. Adding the same rate to both sides leaves a fixed gain’s dollar gap untouched, while raising the bar for required outperformance, because that same addition eats proportionally more of the smaller of the two amounts left after tax. Which number you want depends on which question you asked. Comparing two routes to one gain, the surcharge drops out. Asking how much better a trader has to be, it makes the job harder.
The Return Gap, Taxed
Now the join. The evidence section reports that the most active households earned about 11.4% a year while the market returned about 17.9% — a difference of 6.50 points, which the article calls punishing without ever naming. The tax section says active traders in taxable accounts realize mostly short-term gains. Apply the second statement to the first, at the rates the article itself puts on each activity, and the trader’s 11.4% becomes 7.182% while the market’s 17.9% becomes 15.215%. The gap widens from 6.50 points to 8.033. Tax treatment alone adds 1.533 points a year to a gap the article already calls punishing.
Carried forward on $10,000, that yearly difference stops looking small. The middle column sells and settles up every year; the right-hand column buys once, holds, and pays 15% on the whole gain at the end, which is what buying and holding actually involves.
| Horizon | Trader | Investor, selling yearly | Investor, holding |
|---|---|---|---|
| 1 year | $10,718.20 | $11,521.50 | $11,521.50 |
| 10 years | $20,008.69 | $41,218.32 | $45,612.02 |
| 20 years | $40,034.75 | $169,894.96 | $230,425.95 |
Read the first row as a check on the table rather than a result: at one year there is nothing yet to postpone, so the two investor columns must agree, and they agree to the cent.
After that, three things emerge, in rising order of how much they matter.
Tax does not simply take a toll off the top; it multiplies the distance. On the article’s own pre-tax figures the investor finishes 3.109 times ahead of the most active households at twenty years. Taxed as the article describes, that becomes 4.244 times. The tax treatment by itself accounts for 36.5% more relative advantage than the raw return difference implies.
Then there is the part the article states the cause of without ever pricing: that compounding can only do the heavy lifting if you leave the money alone. Paying 15% once at the end rather than every year along the way is worth $60,531.00 on a $10,000 stake across twenty years — 35.63% more money — for no additional return, no additional risk, and no additional skill. It is the single largest number in this whole section and it is earned by not selling.
Put the two together and the investor who simply holds finishes 5.756 times the most active trader, against the 3.109 times the return gap alone would suggest. The tax section and the evidence section were measuring one headwind from two sides, and neither of them alone shows its size.
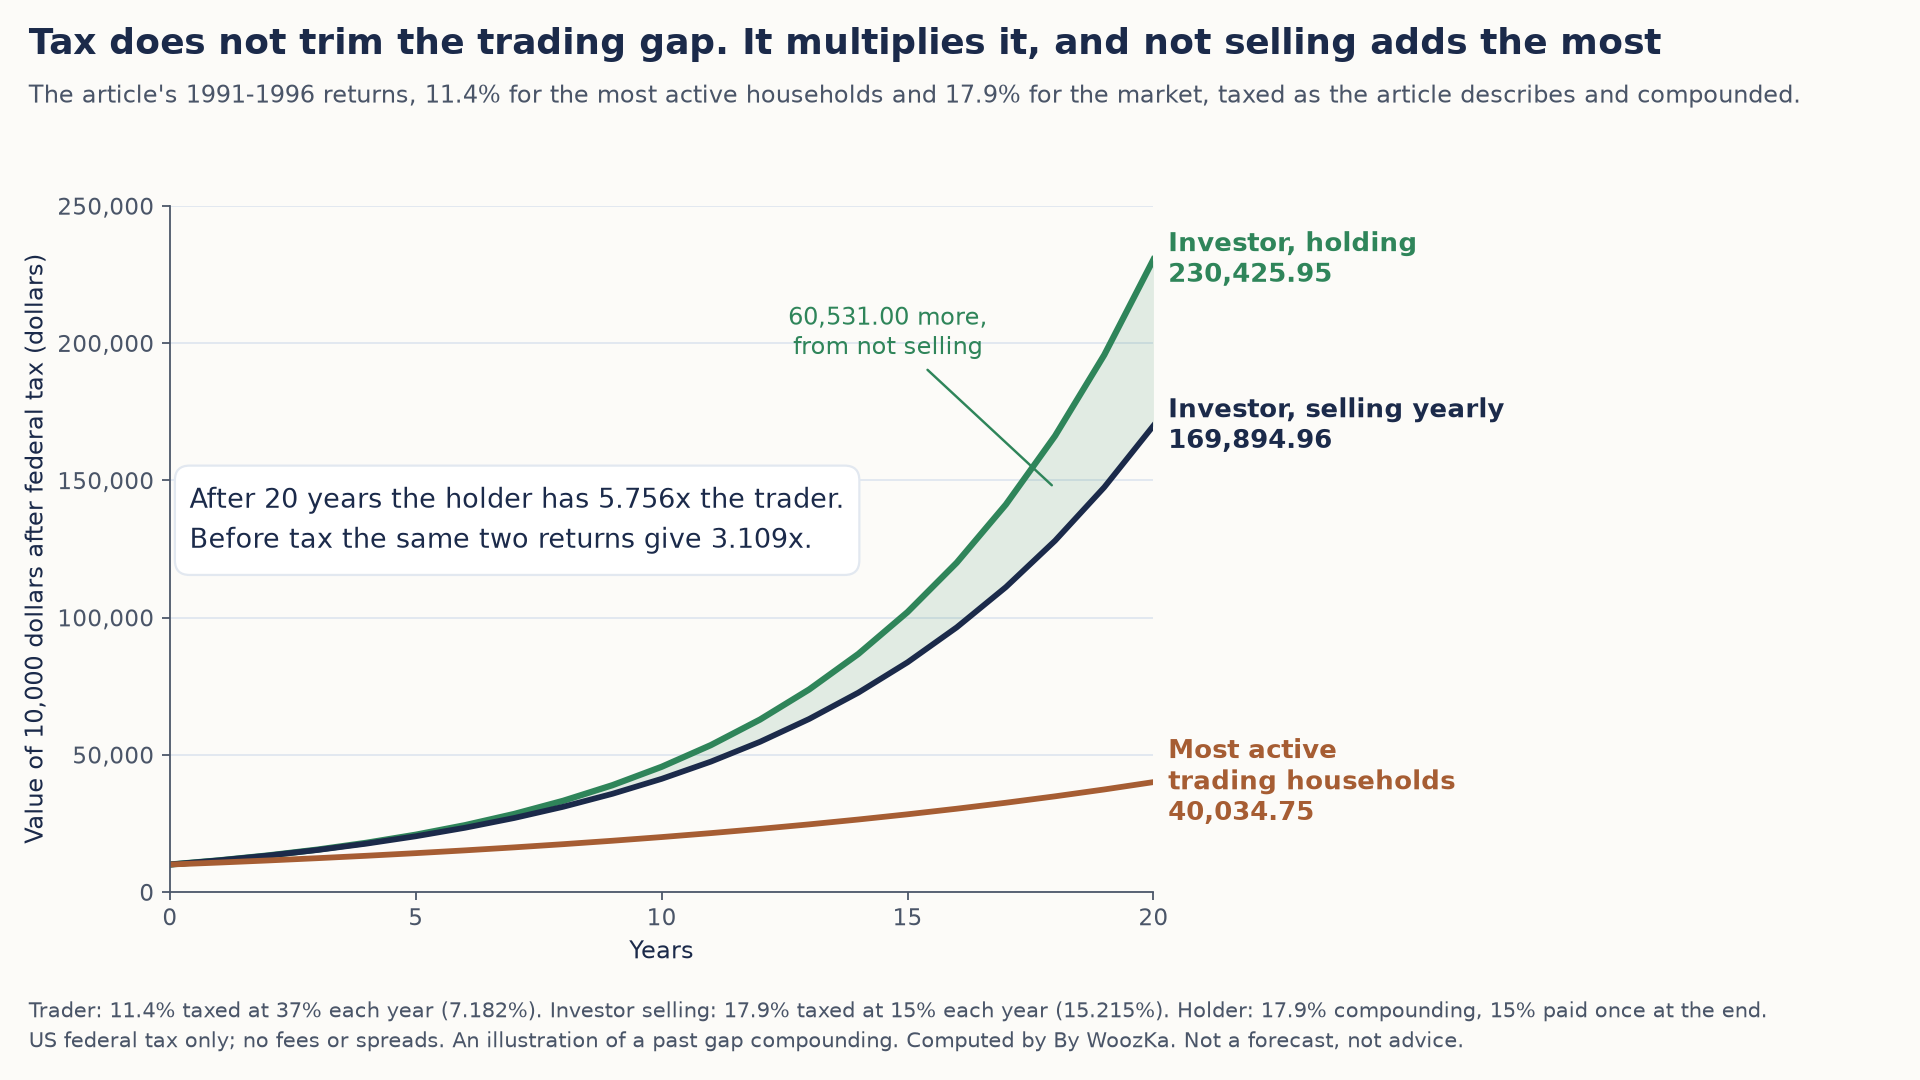
Taxed as the article describes, the gap between the most active traders and the market is 4.244 times after twenty years, against 3.109 times before tax, and holding instead of selling each year takes it to 5.756 times.
Every one of these figures runs in the conservative direction. They count federal tax and nothing else, they charge the investor a fund fee of zero, they ignore the bid-ask spread this article correctly names as a real cost of trading, and the 11.4% they start from is already net of what those traders paid to trade. Each omission understates the difference rather than inflating it.
None of this makes the article’s verdict wrong. Neither activity is better than the other, and a person who trades a small walled-off amount with a real edge is doing something legitimate. What the arithmetic adds is the size of the entry fee. The bar is not “make money.” It is “make 34.92% more than the index did, after costs, every year.” The studies quoted above are the record of how many people clear it.
Run the horizon yourself: the right-hand column above is $10,000 growing at 15.215% a year, compounded annually, with the 15% settled at the end. The Compound Growth Calculator produced every figure in that table, and changing the rate to your own assumption shows how fast the gap between two rates turns into a gap between two balances.
Method and limits: every compounding figure came off the shipped code behind the Compound Growth Calculator, transcribed rather than worked out by hand; separate code re-derives all of them and checks each one against that calculator’s own output to full precision before it reports anything. The tax rates, the $10,000 example and the 11.4% and 17.9% return figures are this article’s own, from the sources cited beside them. Carrying a measured 1991 to 1996 result forward across twenty years is an illustration of what a gap does when it compounds, not a forecast — that stretch was an unusually strong one for US stocks and no one should plan on 17.9%. Rates and thresholds change, this is US federal treatment in a taxable account only, and none of it applies inside an IRA or 401(k), where trades are not taxed as they happen. As the article says above, confirm your own situation with a tax professional.
So Which One Are You Doing?
You don’t have to choose a team. Plenty of people invest the core of their money for the long run and separately trade a small, clearly-walled-off amount they can afford to lose. That’s fine — as long as the two buckets never get confused with each other.
Ask yourself, honestly, before you place an order: Am I buying this because I want to own it as it grows over years, or because I think the price is about to move and I plan to sell soon? If it’s the first, you’re investing, and your job is to hold through the noise. If it’s the second, you’re trading, and your job is to have an edge, size the position small, and know your exit before you enter. Both can be done responsibly. What can’t be done responsibly is not knowing which one you’re doing.
The natural next steps in this section build on this distinction: what a P/E ratio actually measures is a tool for the investor’s job of judging a business, and how to read an earnings report shows where a company’s value actually comes from. The weekly plain-English newsletter below is where these ideas get connected over time — without the noise that pushes people to overtrade.
Disclaimer: This article is educational content, not financial advice. I am not a licensed financial advisor, and nothing here is a recommendation to buy or sell any security or asset. Investing and trading involve risk, including the possible loss of the money you invest. Do your own research and consider consulting a licensed financial professional before making investment decisions. Read the full Disclaimer.
Historical and backtested results are hypothetical, carry inherent limitations, and do not guarantee future results. Figures were accurate to the best of my knowledge as of this article’s last-updated date and may have changed.
