REITs Explained: Should Real Estate Be Part of Your Portfolio?
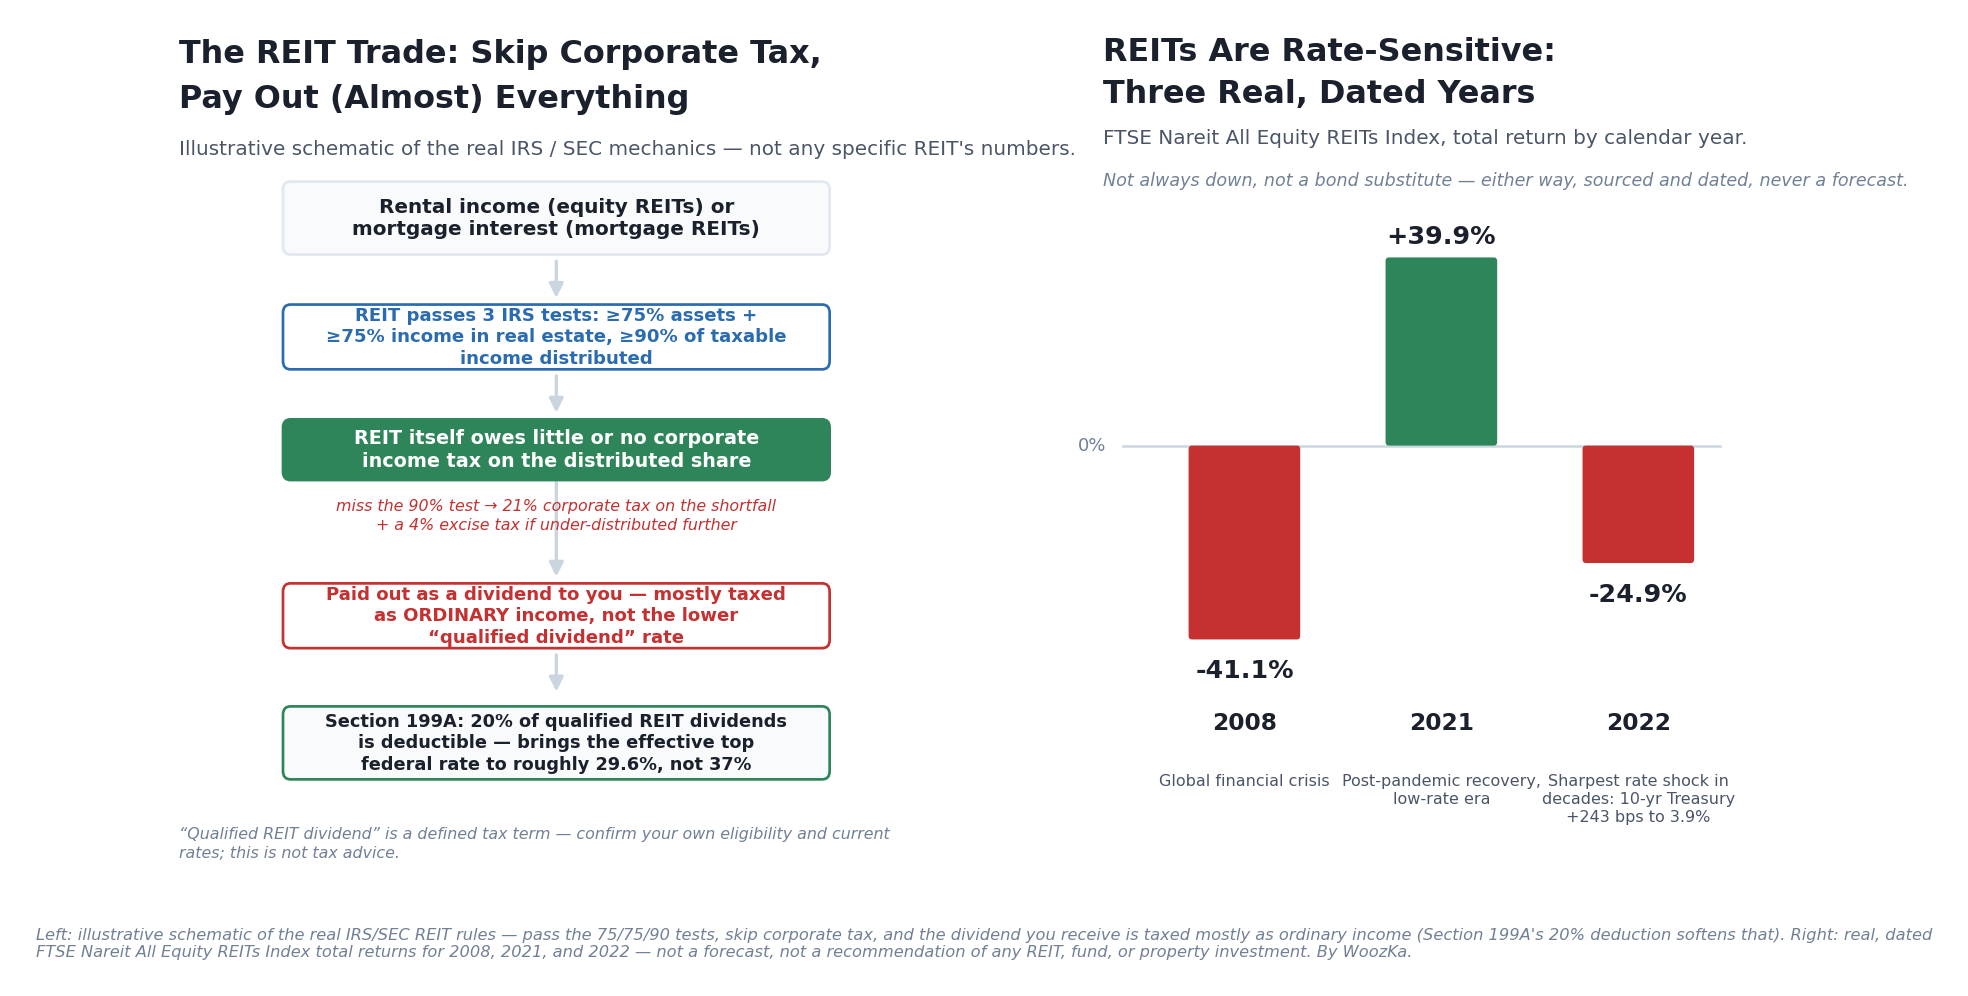
Left: the actual tax trade a REIT makes — skip the corporate tax, but hand over almost all the income, most of which then lands on your return as ordinary income. Right: three real, dated years of REIT index returns, chosen specifically because they don’t all point the same direction. Educational schematic, not advice.
Real estate has a certain pull that index funds don’t. Everyone understands what a building is; almost nobody’s ex-dividend date. A real estate investment trust (REIT) promises to bottle that appeal into something you can buy with a brokerage account — no mortgage application, no tenant screening, no 2 a.m. call about a broken water heater. That promise is largely true. It’s also a lot more nuanced than “real estate, but easier,” and the nuances are exactly the parts that get skipped in most REIT pitches.
This article covers what a REIT legally is and why that legal structure exists, the three types of REITs, how REIT dividends are actually taxed (it’s not what most people assume), why REITs behave more like rate-sensitive stocks than like the house down the street, and how a REIT compares to just buying property yourself. Nothing here tells you what percentage of a portfolio — if any — should go into real estate; that’s a personal question tied to your goals, timeline, and the property exposure you may already have (a home you own counts). If you haven’t built the foundation yet, the 3-fund portfolio guide is the place to start; this is the next-layer question once that foundation is in place.
What a REIT Actually Is
A REIT is a company — not a fund wrapper, an actual operating company — that owns, and usually operates, income-producing real estate: office buildings, shopping centers, apartment complexes, hotels, self-storage facilities, warehouses, data centers, cell towers, or mortgages secured by real property. You buy shares of the REIT the same way you’d buy shares of any public company, and those shares trade on an exchange throughout the day if the REIT is publicly listed [source: U.S. Securities and Exchange Commission, Investor.gov, “Real Estate Investment Trusts (REITs)”].
To legally qualify as a REIT — and get the tax treatment that makes the structure worth using — a company must satisfy several IRS tests: invest at least 75% of its total assets in real estate and cash, derive at least 75% of its gross income from real-estate-related sources (rents, mortgage interest), distribute at least 90% of its taxable income to shareholders as dividends, have at least 100 shareholders after its first year, and have no more than 50% of its shares held by five or fewer individuals [source: 26 U.S.C. §856(a)(5)–(6), (c)(3)–(4) and §857(a)(1), the statutory REIT qualification tests; general description at Investor.gov, “Real Estate Investment Trusts (REITs)”]. Congress created this structure in 1960 specifically so ordinary investors — not just institutions and the wealthy — could pool money into large-scale, income-producing real estate [source: Investor.gov, “Real Estate Investment Trusts (REITs)”].
Three Types of REITs (Most Are Not What You Picture)
Equity REITs own physical properties directly and make money mainly through rent — this is what most people picture when they hear “REIT,” and it’s also the large majority of the REIT market by both count and market value [source: Investor.gov, “Real Estate Investment Trusts (REITs)”].
Mortgage REITs (mREITs) don’t own buildings at all. They finance real estate by originating or buying mortgages and mortgage-backed securities, and earn income from the interest spread — the gap between what they earn on those loans and what it costs them to borrow the money to fund them. That borrowing is usually done with meaningful leverage, which makes mortgage REITs considerably more interest-rate-sensitive and volatile than equity REITs [source: Investor.gov, “Real Estate Investment Trusts (REITs)”].
Hybrid REITs combine both approaches. The featured chart’s left panel uses “rental income (equity REITs) or mortgage interest (mortgage REITs)” as the entry point specifically because the tax rules that follow apply to all three types — the source of the income differs; the 90% distribution requirement and its consequences don’t.
There’s a fourth distinction that matters more than the equity/mortgage split for a beginner: publicly traded REITs trade on a stock exchange (NYSE, Nasdaq) just like any other stock — you can buy or sell in seconds during market hours, and the price is set continuously by the market. Non-traded REITs, by contrast, are not listed on any exchange. The SEC has specifically cautioned investors about them: they’re illiquid for long stretches — often eight years or more before you can reasonably expect to sell — carry sales fees and expenses that can run as high as 15% of the offering price, and their per-share value isn’t set by a live market, which makes it hard to know what you actually own is worth at any given moment. Distributions from non-traded REITs have, in some documented cases, been subsidized by borrowed money or by returning investors’ own capital rather than being paid entirely from operating income [source: SEC/Investor.gov, “Investor Bulletin: Non-Traded REITs”; FINRA investor alert on public non-traded REITs]. Everything past this point in the article is written with publicly traded, exchange-listed REITs in mind — the accessible, liquid version most beginner investors would actually encounter through a brokerage account or fund. If someone ever pitches you a non-traded REIT, that liquidity and fee gap is exactly what to scrutinize before anything else.
The 90% Rule — and the Trade It Represents
Here’s the mechanic worth actually understanding, not just knowing exists: a REIT that meets the IRS tests above generally owes little or no federal corporate income tax on the income it distributes. That’s a real structural advantage — most companies pay corporate tax on their profits and their shareholders pay tax again on dividends (the so-called “double taxation” of corporate income). A REIT mostly sidesteps the first layer, in exchange for a strict rule: distribute at least 90% of its taxable income, every year, like clockwork [source: Investor.gov, “Real Estate Investment Trusts (REITs)”; IRS Instructions for Form 1120-REIT].
That’s not a soft guideline. If a REIT distributes less than 90% of its taxable income (excluding certain capital gains), it can owe corporate tax on the retained amount, and if distributions fall below 85% of ordinary income and 95% of net capital gain, a 4% excise tax kicks in on the shortfall [source: IRS Instructions for Form 1120-REIT; Cohen & Co, “Year-End Tax Planning Strategies for REITs and Real Estate Funds”]. That’s the red side-note in the chart’s left panel — the 90% rule has real teeth, and it’s a big part of why REITs pay out such a large share of their earnings as dividends compared to, say, a growth-oriented tech company that reinvests almost everything.
That same rule has a second-order consequence worth knowing: because a REIT is required to distribute nearly all its taxable income, it retains very little cash internally to fund new acquisitions or development. To grow, REITs typically have to raise new capital — issuing more shares, or, more commonly, taking on debt. That reliance on external financing, especially debt, is a big part of why REIT valuations move with interest rates more than a typical stock’s does. More on that below.
How REIT Dividends Are Actually Taxed
This is the part most REIT content glosses over, and it’s genuinely important if income is part of why you’re considering one.
Regular stock dividends often qualify for the lower long-term capital-gains tax rates (0%, 15%, or 20%, depending on income) — that’s what’s called a “qualified dividend.” REIT dividends mostly don’t get that treatment. Because the REIT itself already avoided corporate tax by distributing the income, the IRS generally taxes what lands in your account as ordinary income — the same rate schedule as your paycheck, which tops out at 37% federal for the highest earners [source: IRS Topic No. 404, “Dividends”; industry tax-guide summaries citing IRC Section 857]. That’s a real, structural difference from a stock like an S&P 500 dividend payer, and it’s the reason tax-advantaged accounts (an IRA or 401(k)) are frequently mentioned as a natural home for REIT income — the same logic covered in Dividend Investing 101 for high-turnover or high-ordinary-income holdings generally.
There is real relief here, and it’s worth knowing about: Section 199A of the tax code allows a 20% deduction on “qualified REIT dividends,” and this provision was made permanent by the One Big Beautiful Bill Act (OBBBA) after previously being scheduled to expire. In practice, that deduction brings the effective top federal rate on qualified REIT dividends down to roughly 29.6% instead of 37% — still ordinary-income territory, not qualified-dividend territory, but meaningfully softened [source: IRC Section 199A; 2026 practitioner summaries, Beancount.io and CountryTaxCalc REIT tax guides — confirm current thresholds and your own eligibility]. This is genuinely technical territory that depends on your specific income and filing situation, so treat this section as a map of the terrain, not a calculation of your own tax bill, and talk to a tax professional before making decisions based on it.
REITs Are Rate-Sensitive — Real Numbers, Not Theory
The chart’s right panel isn’t illustrative — those are real, dated total returns for the FTSE Nareit All Equity REITs Index, the standard benchmark for the U.S. publicly traded equity REIT market:
- 2008: -41.1%. The global financial crisis. REITs, heavily reliant on debt financing and directly exposed to a collapsing credit market and falling property values, fell further than many parts of the broader stock market that year [source: Nareit, “Why REITs Underperformed Broader Markets in 2022,” which cites the 2022 decline as the steepest since this 2008 figure].
- 2021: +39.9%. The flip side — a strong recovery year in an environment of historically low interest rates and reopening demand [source: Nareit, Annual Index Values & Returns data, FTSE Nareit All Equity REITs Index].
- 2022: -24.9%. The sharpest interest-rate shock in decades. Over the course of 2022 the 10-year Treasury yield rose 243 basis points to end the year at 3.9%. Every property sector posted a negative return that year — office was hit hardest at -37.6%, while more defensive sectors like specialty (-0.8%) held up far better — a reminder that “REITs” is not one monolithic bet, sector matters enormously [source: Nareit, “Why REITs Underperformed Broader Markets in 2022”].
Two honest lessons sit side by side in that chart, on purpose. First: REITs are not a one-way-down asset — 2021 was a genuinely strong year, and treating REITs as permanently bad because of 2008 or 2022 would be just as wrong as treating them as safe income because of 2021. Second, and more important: REITs are not a substitute for bonds. A REIT is equity in a real estate operating company, funded substantially with debt, and its price responds to interest-rate moves in a way that resembles a rate-sensitive stock a lot more than it resembles a savings account or a Treasury bond. If you’re holding REITs expecting bond-like stability with a better yield, the 2022 bar in that chart is the honest counter-evidence.
That rate sensitivity has a mechanical explanation worth naming, not just observing: rising rates raise a REIT’s own borrowing costs (more expensive debt to refinance or fund new acquisitions), and they also make the REIT’s dividend yield look comparatively less attractive next to a Treasury bond that now pays more with none of the equity risk — both pressures tend to pull REIT prices down when rates rise quickly, and support them when rates fall.
One more nuance on the diversification pitch specifically: REITs are often sold as a way to diversify away from stocks. Nareit’s own research on REIT-stock correlations found that during the 2008 crisis, correlations between REITs and the broader stock market by property sector generally stayed in a moderate range — roughly the 40%–55% area for sectors studied — rather than spiking to 1 (perfectly correlated) [source: Nareit, “The REIT-Stock Correlation Has NOT ‘Spiked to One’ During Market Crises”]. That’s a real, partial diversification benefit — REITs don’t move in lockstep with the rest of the stock market — but “partial” and “moderate” are the operative words. It is not the same as owning an asset that’s genuinely uncorrelated with stocks, and in the most acute stretches of market stress, correlations across nearly all equity-like assets tend to rise, REITs included.
REITs vs. Actually Owning Property
This is the comparison that gets the least honest treatment anywhere in REIT marketing, so it’s worth being direct: a publicly traded REIT is a share of a company that trades like a stock. It is not a piece of a specific building, and it doesn’t behave like the house you might own.
Liquidity. A publicly traded REIT can be bought or sold in seconds during market hours. Selling a physical property typically takes weeks to months, plus closing costs, agent commissions, and paperwork. This is one of the clearest, most genuine advantages a REIT has over direct ownership.
Minimum investment. You can buy one share of a REIT (or a fraction of one, as covered here) for whatever that share costs. Buying a rental property typically requires a substantial down payment, financing, and ongoing capital reserves.
Diversification. A single rental property concentrates your real estate risk in one building, one location, one tenant pool. A REIT — and especially a diversified REIT index fund — spreads exposure across dozens or hundreds of properties, tenants, and often multiple property types and geographies.
Management. A REIT is professionally managed — no leases to negotiate, no maintenance calls, no eviction process to navigate yourself. That convenience is also a cost: you’re paying management overhead embedded in the REIT’s expenses, the same way any fund has ongoing costs (see Expense Ratios Explained for how that math compounds).
Leverage and control. Direct property ownership lets you choose your own financing terms and gives you direct operational control. A REIT’s leverage decisions are made by its management team, not by you, and while that’s often more disciplined than an individual landlord’s financing choices, you have zero say in it.
Neither of these is “better” as a category — they’re different instruments with different risk and liquidity profiles, and plenty of investors reasonably hold both a home (or rental property) and REIT exposure without it being a contradiction. What’s genuinely misleading is marketing that blurs the line and implies a REIT gives you “real estate” in the same sense as owning a building — it gives you a stock-like claim on a real estate operating company, with all the liquidity benefits and rate-sensitivity that implies.
How Someone Might Access REIT Exposure
Two broad routes exist, as categories — not recommendations of any specific security:
Individual REIT stocks. Buying shares of a specific REIT concentrates you in that company’s property type, geography, and management quality — the same concentration risk as buying any single stock, discussed in Dividend Investing 101.
A diversified REIT index fund or ETF. A broad real estate fund spreads exposure across many REITs and property sectors in one purchase, at a low ongoing cost. As one labeled, confirm-current example of the category (not an endorsement): the Vanguard Real Estate ETF (ticker VNQ) carries an expense ratio of about 0.13% and a trailing dividend yield in the high-3% range as of mid-2026 [source: Vanguard fund materials; confirm current figures directly with the provider before acting on them, as both drift over time]. Whether a name like that, a different provider’s real estate fund, or no dedicated real estate allocation at all is appropriate is a personal decision tied to what real estate exposure you may already have (again — a home you own is real estate exposure) and your own goals; this article isn’t making that call for you.
What That Trade Is Actually Worth
A heading earlier on this page calls the 90% rule a trade: skip a layer of tax at the company, hand over almost all the income, and take what arrives at the higher ordinary rate. That is a fair description, and it is missing a price. Everything needed to compute one is already above — the 90% threshold, the 85% and 95% excise thresholds, the 37% ordinary rate, the 20% qualified rate, the 20% Section 199A deduction, five dated index returns and an expense ratio. What follows multiplies those numbers together instead of listing them, and one of the answers runs against the way this article has been describing the structure.
Three Thresholds, and the One That Cannot Bite
Two separate rules were stated above. To qualify as a REIT at all, a company must distribute at least 90% of its taxable income. Separately, a 4% excise tax applies if distributions fall below 85% of ordinary income or 95% of net capital gain. Those were presented in sequence, as though the second stacked more teeth on top of the first. Laid side by side against the same income, they do not both reach.
| Rule | Applies to | Distribute | Can it bind? |
|---|---|---|---|
| REIT qualification | taxable income | 90% | Yes |
| 4% excise tax | ordinary income | 85% | No |
| 4% excise tax | net capital gain | 95% | Yes |
On the ordinary-income side the 85% threshold is slack by a full 5 points. A REIT that has cleared the 90% qualification test has already cleared it, with room to spare, and cannot trip the excise tax there without first having stopped being a REIT — at which point a 4% excise charge is the smaller of its two problems. The excise tax’s teeth are real, but they are almost entirely on the other row: net capital gain is excluded from the 90% test, so the 95% threshold is the only one guarding it, and it sits 5 points tighter than the qualification rule rather than looser. The sentence above leads with the threshold that cannot bind and buries the one that does.
The distribution column carries the other consequence. Above, this article says a REIT “retains very little cash internally” and must therefore raise money to grow. That has an exact size: at most 10% of taxable income stays inside. A REIT wanting to invest an amount equal to a full year of taxable income must find the other 90% outside, which is $9.00 of new debt or equity for every $1 it was allowed to keep. The 9:1 ratio is not an estimate of typical behavior; it is what the 90% rule permits at its most favorable, and the reason the rate sensitivity described above is structural rather than incidental.
Pricing the Trade Itself
Now the trade. Take $1 of pre-tax income at the company and follow it to the shareholder’s pocket under each structure. One rule matters for making this fair: the filer is held fixed. The 37% ordinary rate and the 20% qualified rate are the same top-bracket person’s two rates, so the only thing changing between rows is the structure, not the taxpayer. The last column asks the question backward — at what corporate tax rate would the two structures tie? — so that the corporate rate is an output of the comparison rather than an assumption fed into it.
| Structure | Company tax | Holder rate | Holder keeps | Ties at |
|---|---|---|---|---|
| REIT, with 199A | 0% | 29.60% | $0.704 | 12.00% |
| REIT, no 199A | 0% | 37.00% | $0.630 | 21.25% |
| Ordinary company | 21% | 20.00% | $0.632 | — |
First, a small confirmation: the “roughly 29.6%” quoted above is not roughly anything. A 20% deduction against a 37% rate is 29.6% exactly, and because 199A is a deduction from income rather than a credit, it is worth precisely one fifth of whatever rate applies — 7.4 points at the top, proportionally less at every bracket below it. It is not a flat benefit, and it is worth the most to the people already paying the most.
Now the part worth sitting with. With Section 199A in place the REIT structure delivers 7.2 cents more per pre-tax dollar than an ordinary company paying a qualified dividend — 70.4 cents against 63.2, about 11.4% more after-tax income. Take 199A away and the same structure delivers 63.0 cents against 63.2. It is slightly worse. Not dramatically — two tenths of a cent is a rounding error in anyone’s real return — but the direction is the point. Skipping the corporate layer and paying 37% instead of 20% at the top bracket is, at a 21% corporate rate, very nearly an even swap.
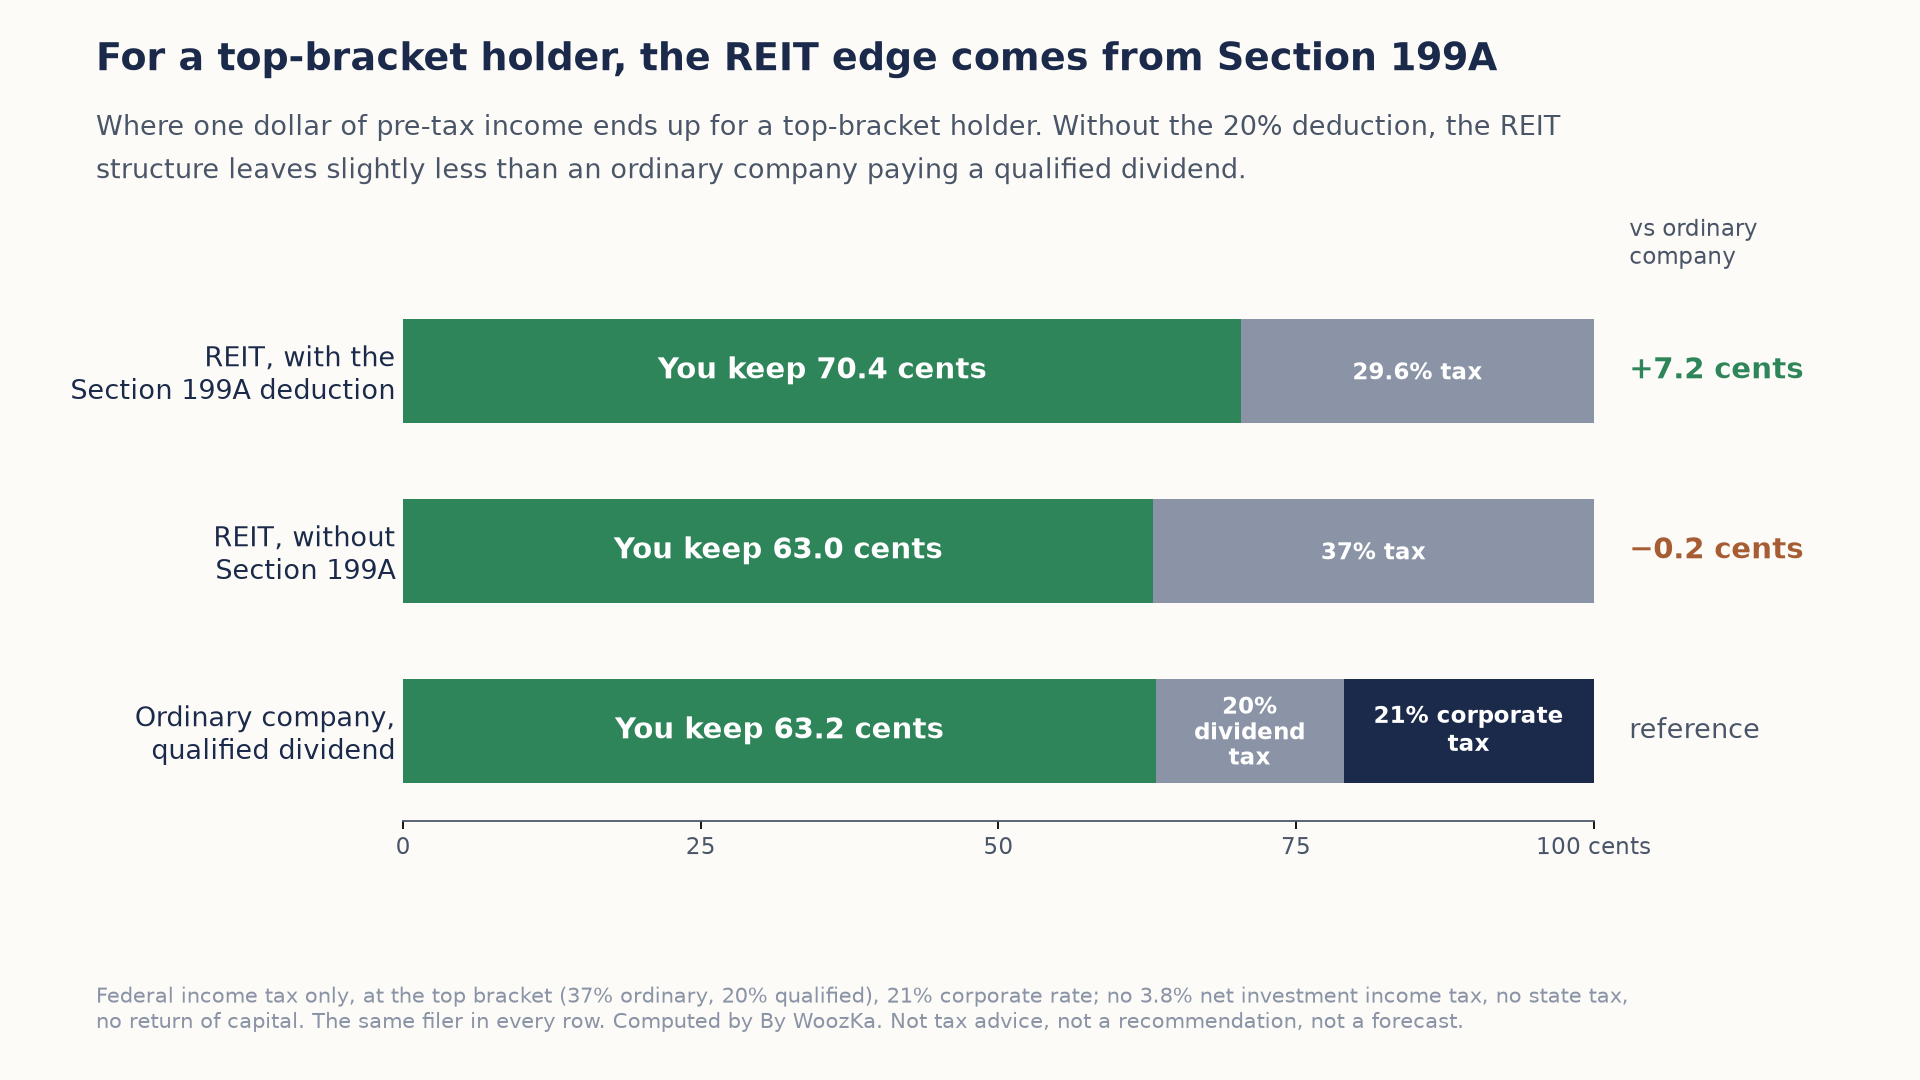
Skipping the corporate tax but paying 37% instead of 20% leaves a top-bracket holder almost exactly where an ordinary company would. The 20% Section 199A deduction is what turns that near tie into a 7.2-cent edge.
The tie-point column says the same thing more precisely. Without 199A, the two structures break even when the corporate rate is 21.25%, which sits a quarter of a point above the statutory 21% [source: IRS, Instructions for Form 1120 (2025), Schedule J, line 1a]. With 199A the tie-point drops to 12.00%, meaning the REIT structure now wins against any corporate rate above 12%. That 9.25-point shift is the whole margin. This article introduced Section 199A as “real relief” that softens an otherwise unfavorable rate, arriving after the structural advantage had already been established. On its own numbers the order is the other way around: at today’s corporate rate the avoided company-level tax is worth approximately nothing to a top-bracket holder, and 199A is not the softening — it is the advantage.
Two things that does not mean. It is not an argument for or against owning REITs, which depends on far more than one line of tax arithmetic and on a bracket most readers are not in. And it is not a claim that the structure is pointless: the comparison prices a distributed dollar, because that is the comparison this article sets up, and an ordinary company that retains its earnings instead simply defers the second layer — a real advantage this table does not credit it with, and one the 90% rule denies a REIT by design.
“Sector Matters Enormously,” in Numbers
The rate-sensitivity section calls its figures real numbers rather than theory, then draws only verbal lessons from them. Two arithmetic ones are sitting right there. The first is a subtraction: if the 10-year Treasury rose 243 basis points during 2022 and ended at 3.9%, it began the year at 1.47%. Stated that way the shock reads differently — 2.43 points is a 165.3% relative increase, a yield multiplying by more than two and a half. That ratio, not the basis-point count, is why a move of that size did what it did to assets valued off a yield comparison.
The second is what “sector matters enormously” is worth if you take the ratio.
| Series, year | Return | Needed to recover | vs. index | vs. 2008 |
|---|---|---|---|---|
| Index, 2008 | −41.1% | +69.78% | 1.00x | 100.0% |
| Index, 2022 | −24.9% | +33.16% | 1.00x | 60.6% |
| Office, 2022 | −37.6% | +60.26% | 1.51x | 91.5% |
| Specialty, 2022 | −0.8% | +0.81% | 0.032x | 1.9% |
Within one year, holding the asset class and the macro environment constant, office fell 47 times as far as specialty. The gap between the best and worst sectors named above is 36.8 percentage points — wider than the index’s own decline that year. And office’s single rate-shock year landed within 3.5 points of what the whole index lost in the global financial crisis. “REITs” being a poor description of one bet is not a hedge in that sentence; it is the largest effect in the table.
The recovery column is the other thing these numbers invite and never get. A 41.1% loss needs a 69.78% gain to return to level, not a 41.1% one, and the largest single-year gain reported anywhere above is +39.9% — 57.2% of the move required. The two honest lessons this article puts side by side are that REITs are not a one-way-down asset and not a bond substitute; the arithmetic adds a third, which is that the good year on this page does not cover the bad one. Note what is deliberately not done here: 2008, 2021 and 2022 are three isolated years with gaps between them, and multiplying them into a compounded path would invent a return series that never happened. Each row stands alone.
One last cost, because this article names it and then sends you elsewhere for the math. The example fund mentioned above carries a 0.13% expense ratio. Run forward on the compound growth calculator, that fee alone takes 2.568% of a balance over 20 years and 3.827% over 30. Set against it, the ordinary-income treatment costs 9.6 cents of every distributed dollar (29.6% versus 20.0%), which as a share of assets is 9.6% of the distribution yield. The two costs are therefore equal at a yield of 1.354% — and above that, the tax treatment is the larger of the two. At the high-3% yield described above it runs 0.355% to 0.374% a year, roughly 2.7 to 2.9 times the entire expense ratio, compounding to 6.9%–7.2% of the balance over the same 20 years. Fee comparisons get most of the attention in fund selection; on this asset, in a taxable account, the account type is the bigger decision, which is exactly why the tax section above points at IRAs.
Origins of the figures above, and the limits that attach to them. Every threshold, rate, return and expense figure above is this article’s own, restated and multiplied — the one exception is the 21% corporate rate, sourced and linked. Compounded figures came from computeCompound, the shipped function behind this site’s compound growth calculator, called directly and transcribed; separate code re-derives every number here and checks each against the calculator’s own output before it reports anything, and it recomputed this article’s published 29.6% and confirmed it exact. The tax comparison is federal income tax only at the top bracket: no 3.8% net investment income tax, no state tax, no partial return-of-capital treatment, and no account for the fact that most real distributions mix ordinary income, capital gain and return of capital rather than being one thing. Real tax outcomes depend on your bracket, your account type and your own situation, and none of this is tax advice or a recommendation to hold any allocation to real estate. Nothing above forecasts a rate move or a return; it is arithmetic on figures already published, and dated figures at that.
The Honest Take
A REIT is a genuinely useful structure — it opened large-scale, professionally managed real estate investing to ordinary investors who could never buy a shopping mall outright, and the underlying rule that forces REITs to distribute almost all their income is a real, meaningful protection for income-seeking shareholders. None of that makes REITs a bond substitute, a diversification cure-all, or a tax-efficient income source by default. The honest summary: expect the dividend to be sizable (the 90% rule guarantees that), expect it to be taxed mostly as ordinary income (with Section 199A softening, not eliminating, that), expect the price to move with interest rates more than the word “real estate” suggests, and expect a real — but partial, not complete — diversification benefit versus a plain stock portfolio.
If real estate income is one piece of a broader income strategy, the natural next stop is Dividend Investing 101 for the total-return mindset that applies just as much here, or back to How to Build a 3-Fund Portfolio to see where — if anywhere — a real estate allocation might fit into a broader plan. The weekly newsletter, linked below, is where these portfolio-construction pieces get tied together over time.
Disclaimer: This article is educational content, not financial advice. I am not a licensed financial advisor, and nothing here is a recommendation to buy or sell any security or asset. Investing and trading involve risk, including the possible loss of the money you invest. Do your own research and consider consulting a licensed financial professional before making investment decisions. Read the full Disclaimer.
Historical and backtested results are hypothetical, carry inherent limitations, and do not guarantee future results. Figures were accurate to the best of my knowledge as of this article’s last-updated date and may have changed.
