How to Read an Earnings Report Without an MBA
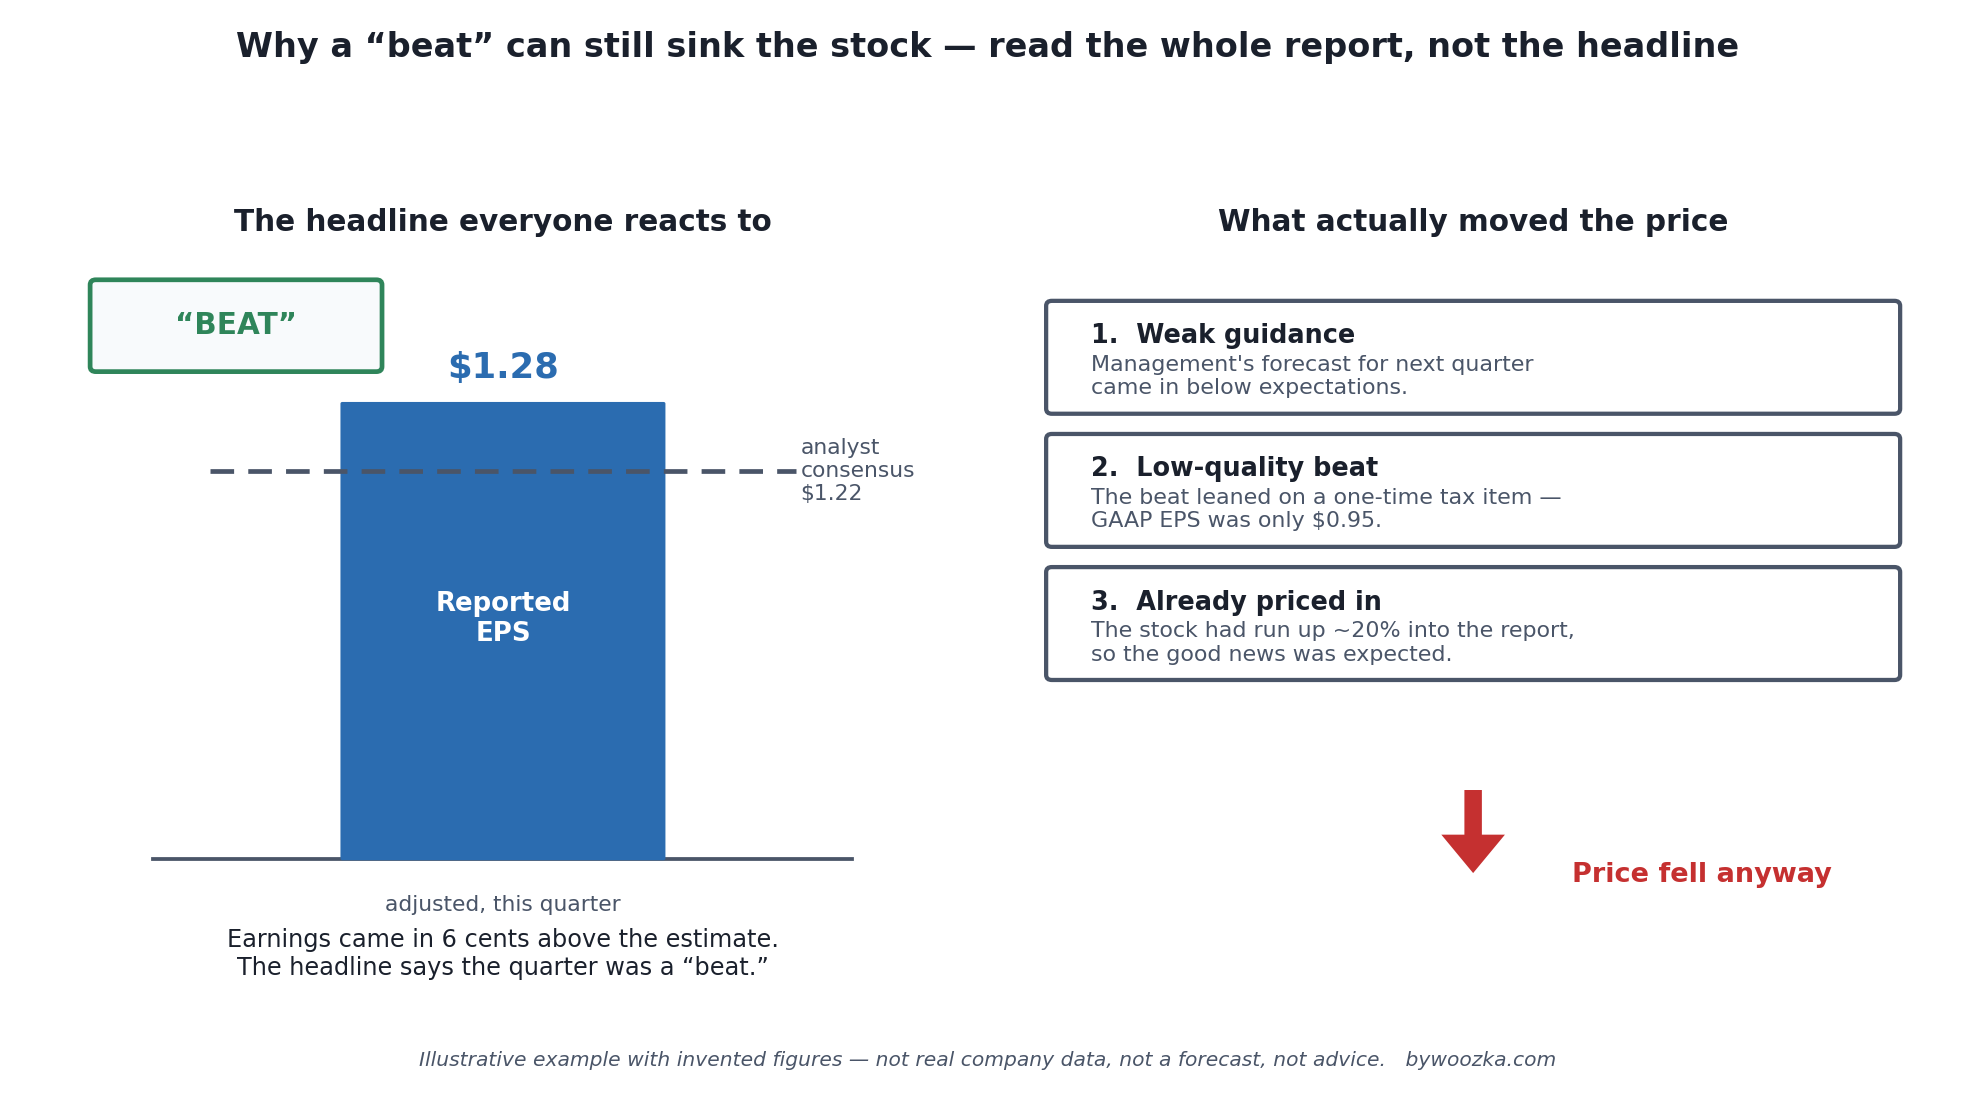
An earnings report is not a single number that grades a company “good” or “bad.” It’s a package — a press release, a formal SEC filing, and usually a call — and the headline EPS is the least interesting part once you know where to look. Illustrative example, not advice.
Four times a year, every public company you can buy has to open its books. For a few weeks each quarter — what the financial press calls “earnings season” — headlines fill with words like beat, miss, EPS, guidance, and adjusted, and a stock can jump or drop 10% in an afternoon on the strength of a report almost no one has actually read past the first sentence. It looks like a language you’d need an accounting degree to follow. You don’t.
This guide walks through what actually lands each quarter, in plain English: what an “earnings report” even is (it’s really three separate things), which numbers matter and which are noise, the single most common way the headline number misleads people, and why a company can post a great quarter and still watch its stock fall. It’s written for someone who has already opened a brokerage account and wants to understand what they own — the companion to the broader framework in how to analyze a company before you buy the stock. And before the first number, one honest disclaimer that shapes everything below.
Why a “beat” can still sink the stock. Reported adjusted EPS of $1.28 against an analyst consensus of $1.22 is a beat — and the price fell anyway, for three reasons the headline never carried:
- Guidance for next quarter was cut below expectations.
- The “beat” leaned on a one-time tax item — GAAP EPS was $0.95.
- The stock had already run up 20% into the report.
Illustrative example with invented figures, not real company data, not advice, not a forecast.
First, What Reading This Can and Can’t Do for You
Learning to read an earnings report is genuinely useful — it’s how you understand a business instead of trusting a headline or a stranger on the internet. But it is not a way to beat the market, and it’s worth being clear-eyed about why.
By the time you read a report, so has everyone else — instantly, and with far more firepower. U.S. securities rules require companies to release material information to all investors at the same time, not feed it selectively to favored professionals: that’s Regulation Fair Disclosure (Reg FD), which the SEC adopted in August 2000 specifically to stop selective disclosure to market pros and big shareholders [source: SEC, “Selective Disclosure and Insider Trading” (Reg FD), 2000; Vorys, “Regulation FD: A Refresher”]. That’s the good news: the same earnings release, the same filing, and the same webcast call that a Wall Street analyst sees are free and public to you too. The sobering news is that thousands of those analysts, plus algorithms, digest it in milliseconds and trade on it before you’ve finished the first paragraph.
So read earnings reports to understand what you own — is the business actually profitable, is the profit real cash, is it growing or quietly shrinking — not to find a number that tells you the stock will go up. As covered in the companion framework, even most full-time professional fund managers underperform a plain index fund over time, which is exactly why, for the core of most people’s money, a low-cost index fund bought steadily through dollar-cost averaging is the sensible default, with individual-company reading as something you layer on afterward. Nothing here is a recommendation to buy or sell anything.
With that settled, here’s what actually shows up.
An “Earnings Report” Is Really Three Documents
People say “the earnings report” as if it’s one thing. It’s usually three, released together, and they serve different purposes.
1. The earnings press release. This is the short, polished document the company puts out — often after the market closes — announcing the quarter’s headline results: revenue, earnings, EPS, and frequently the forward guidance (management’s own forecast for the next quarter or year). It’s what the news reacts to. Companies typically furnish this release to the SEC as an exhibit attached to a Form 8-K, the “current report” used to disclose material events between the regular quarterly filings [source: SEC / Investor.gov, “Form 8-K”; NYPL Research Guides, “SEC Documents”]. It’s written by the company’s investor-relations team, so read it as the company’s own framing of its quarter — accurate, but curated.
2. The formal SEC filing (10-Q or 10-K). This is the real substance: the full, standardized report filed with the SEC. Every quarter (for the first three quarters of the fiscal year) a company files a Form 10-Q; once a year it files a Form 10-K covering the full year, with the fourth quarter’s detail rolled into it — which is why companies file only three 10-Qs a year, not four [source: SEC / Investor.gov, “Form 10-K”; Wikipedia, “Form 10-K”]. Two differences matter to you as a reader: the 10-K is audited by an outside accounting firm and is the most complete picture of the company, while the 10-Q is generally unaudited and less detailed [source: SEC / Investor.gov; NYPL Research Guides, “SEC Documents”]. These filings are due on a clock — the 10-K within 60 days of year-end for the largest companies (75 or 90 days for smaller filers), and the 10-Q within 40 days of quarter-end (45 for the smallest) — so the filing may arrive days or weeks after the flashy press release [source: PwC, “The accelerated filer system”; Mayer Brown, “2026 SEC Filing Deadlines,” summarizing SEC deadlines].
3. The earnings call. Shortly after the release, management hosts a conference call (webcast and later transcribed) walking through results and — the part professionals care about most — taking analysts’ questions and discussing the outlook. Because of Reg FD, that call is public; you can listen live or read the transcript afterward [source: SEC, Reg FD, 2000].
You can get all three, free, from two places: the company’s own investor relations page, and the SEC’s EDGAR database, which offers free public access to filings from more than 500,000 companies [source: SEC, “Search Filings” / EDGAR; UC Law SF LibGuides, “SEC Filings”]. You do not need a paid data terminal to read a company’s earnings.
The Headline Numbers: Revenue and EPS
Two numbers dominate every earnings headline. Both are simpler than they sound.
Revenue (the “top line”) is total sales for the quarter — the money that came in before any costs. It’s called the top line because it sits at the top of the income statement.
Earnings per share (EPS) is the “bottom line” profit sliced per share of stock. Mechanically, EPS is the income available to common shareholders divided by the weighted-average number of shares outstanding during the period (weighted because share count changes as companies issue or buy back stock) [source: PwC Viewpoint, “Types of EPS computations”; AnalystPrep, “Basic vs. Diluted EPS”]. You’ll see two versions side by side:
- Basic EPS uses the shares actually outstanding.
- Diluted EPS also counts shares that could be created from things like employee stock options and convertible securities — so diluted EPS is always equal to or lower than basic EPS, and it’s the more conservative, more honest figure to anchor on [source: PwC Viewpoint, “Diluted EPS”; AnalystPrep].
One habit separates careful readers from headline-skimmers: compare to the same quarter a year ago, not to last quarter. Many businesses are seasonal — a retailer’s holiday quarter dwarfs its spring quarter — so year-over-year (YoY) comparison strips out that seasonality in a way quarter-over-quarter (QoQ) can’t. A “revenue fell from last quarter” panic is often just winter following the holidays.
The GAAP-vs-“Adjusted” Trap (Read This Part Twice)
Here is the single most common way an earnings headline misleads a beginner, and once you see it you can’t unsee it.
Companies report earnings two ways. GAAP earnings follow Generally Accepted Accounting Principles — the standardized, auditable rulebook. Non-GAAP earnings, usually labeled “adjusted,” are the company’s own version, with certain items stripped out (restructuring charges, stock-based compensation, one-time legal costs, and so on). The press-release headline almost always leads with the flattering adjusted number, because management chooses what to exclude.
This isn’t a loophole the company invented — it’s regulated. Under the SEC’s Regulation G, whenever a company reports a non-GAAP measure it must also present the most directly comparable GAAP figure and a reconciliation between the two, with the GAAP number given equal or greater prominence — the SEC has specifically flagged putting the adjusted number first, or burying the GAAP one, as improper [source: SEC, “Conditions for Use of Non-GAAP Financial Measures” (Reg G / Item 10(e)); Cooley CapitalXchange, “Non-GAAP Financial Metrics and Disclosures,” 2025]. That reconciliation table is a gift to you: it’s the company showing its work. Find it, and read the GAAP number the adjusted headline was built on.
The literacy rule is simple. Adjusted numbers can be legitimate — genuinely one-time costs do muddy the picture. But “adjusted” is where a weak quarter goes to look strong, so treat a big, persistent gap between adjusted and GAAP earnings as a question to investigate, not a number to trust. If a company excludes the same “one-time” charge every quarter for three years, it isn’t one-time.
“Beat,” “Miss,” and Why a Great Quarter Can Sink the Stock
New investors are constantly baffled by this: a company reports record revenue, “beats” earnings, and the stock falls 8%. It’s not a glitch. It’s the most important thing to understand about how markets treat earnings.
A stock doesn’t move on whether results were good — it moves on whether they were better or worse than what the market already expected. Analysts publish estimates; the average is the “consensus.” Coming in above it is a “beat,” below it a “miss.” But that consensus is only the visible expectation. Institutions run their own models, and traders talk about unofficial “whisper” numbers that can sit well above the published consensus, so a technical “beat” versus the printed estimate can still be a disappointment versus what big money actually expected [source: Kavout, “Why Do Stocks Drop Even After Beating Earnings”; StableBread, “Why Stock Prices Fall After Beating Earnings”].
Three forces routinely turn a “beat” into a sell-off:
- Guidance. Markets price the future, so weak forward guidance can outweigh a strong quarter that’s already in the past. A great Q2 paired with a cautious outlook for Q3 often falls [source: Kavout; StableBread].
- Expectations already priced in. If a stock ran up 20% into the report, the good news may already be baked into the price — the classic “buy the rumor, sell the news,” where investors lock in gains once the event passes [source: StableBread; Kavout].
- The quality of the beat. A beat driven by a one-time tax benefit or an accounting adjustment is worth far less than one driven by growing sales — which loops right back to the GAAP-vs-adjusted point above.
This is the part of earnings season that cost me the most to learn, and it wasn’t really about accounting. I used to treat conviction as though it were information. It isn’t. Strong conviction mostly measures how thoroughly a single idea has taken over your own head, and that has no dependable relationship to what the stock then does. Earnings are where the gap shows up in public: the numbers come in genuinely good, and the stock falls anyway, because what came attached to them was an uncertain outlook. Seeing that happen often enough is what broke my habit of treating a strong opinion as a reason to hold more. There are people who bet earnings from statistical base rates, which is a different activity with its own arithmetic. Picking the direction of a report because you feel certain isn’t sizing at all — it’s a wager dressed up as analysis.
The takeaway isn’t to try to trade around these reactions — that’s a game professionals with millisecond systems usually lose against each other. It’s to understand that the earnings headline and the stock’s reaction are answering two different questions: “how did the business do?” versus “how did it do relative to expectations, and what’s the outlook?” You care mostly about the first.
Don’t Stop at the Press Release: Cash Flow and the MD&A
The press release is the company’s highlight reel. Two less-glamorous parts of the actual filing tell you more.
The cash flow statement answers whether the reported profit is real cash. Because net income involves accounting judgments, a company can post an accounting profit while cash walks out the door; the cash flow statement shows the actual cash moving in and out. As detailed in the company-analysis framework, the figure worth finding is free cash flow — operating cash flow minus capital expenditures — the cash genuinely left over after the business pays to maintain and grow itself [source: Corporate Finance Institute, “Free Cash Flow”]. Rising reported earnings sitting on top of stagnant or falling free cash flow is one of the most reliable “look closer” signals there is.
The Management’s Discussion and Analysis (MD&A) is the plain-language narrative section the SEC requires in the 10-Q and 10-K, where management explains the results, the trends behind them, and known risks and uncertainties in their own words [source: SEC, “Commission Guidance Regarding Management’s Discussion and Analysis,” 2003; Deloitte DART, “Management’s Discussion and Analysis”]. It’s the most readable part of the whole filing and often the most revealing — both for what it explains and for what it conspicuously doesn’t.
A Simple Order to Read One In
You don’t read an earnings report front to back. A practical order for a beginner, roughly ten minutes:
- Revenue, year-over-year. Growing, flat, or shrinking versus the same quarter last year?
- Diluted EPS, year-over-year — and glance at whether the headline is GAAP or “adjusted.”
- Find the GAAP-to-adjusted reconciliation. How big is the gap, and what’s being excluded? Is it plausibly one-time?
- Guidance. What is management forecasting for next quarter/year, and did that outlook rise or fall?
- Free cash flow. Is the profit turning into cash, or diverging from it?
- Skim the MD&A for the “why,” the risks, and anything that contradicts the press-release cheerfulness.
That sequence tells you more about a business than the day’s headline ever will — and none of it requires an accounting degree, just the willingness to scroll past the first paragraph.
The Gap, Actually Measured
The GAAP-versus-“adjusted” section names a gap, calls it the single most common way an earnings headline misleads a beginner, and tells you to treat a big, persistent one as a question worth investigating. It never measures a gap. The opening example supplies everything needed to measure one: adjusted earnings per share of $1.28, an analyst consensus of $1.22, and a GAAP figure of $0.95 — three numbers printed within a few lines of each other and never once subtracted. Those figures are this article’s own illustration with invented numbers. They are not any real company’s results and nothing below turns them into one. What the arithmetic shows is structural, and holds for any three numbers of the same shape.
One Quarter, Three Verdicts
| Comparison | Difference | Percent | Verdict |
|---|---|---|---|
| Adjusted vs consensus | +$0.06 | +4.918% | Beat |
| GAAP vs consensus | -$0.27 | -22.131% | Miss |
| Adjusted vs GAAP | +$0.33 | +34.737% | Excluded |
The same quarter, the same company, the same afternoon. Measured against the number the press release leads with, management beat expectations by 4.918%. Measured against the number the auditors will stand behind, it missed by 22.131%. That is a swing of 27.049 percentage points produced by nothing except which line of the same document you read.
The proportion is the part worth keeping. The exclusion is $0.33 and the beat is $0.06, so the amount stripped out is 5.5 times the size of the outperformance being celebrated. The headline is not reporting a good quarter with a small asterisk attached; the asterisk is five and a half times larger than the news. That ratio is the section’s advice in usable form: when the gap dwarfs the beat, the beat is a property of the adjustment rather than of the business.
Why the Three-Year Test Has To Be Counted in Quarters
The section closes on a test — if a company excludes the same “one-time” charge every quarter for three years, it isn’t one-time. Three years is twelve quarters, and holding that same $0.33 exclusion steady across them costs one multiplication per row.
| Elapsed | Adjusted | GAAP | Excluded | Share of claimed |
|---|---|---|---|---|
| 1 quarter | $1.28 | $0.95 | $0.33 | 25.781% |
| 1 year | $5.12 | $3.80 | $1.32 | 25.781% |
| 2 years | $10.24 | $7.60 | $2.64 | 25.781% |
| 3 years | $15.36 | $11.40 | $3.96 | 25.781% |
The last column does not move. The excluded amount is 25.781% of everything claimed at one quarter and 25.781% of everything claimed at twelve; measured against real earnings instead, it sits at 34.737% in every single row. The percentage is scale-invariant — a reader who checks one quarter and a reader who checks three years see the identical figure. That is why persistence cannot be caught by asking how big the gap is. It can only be caught by counting how often the gap recurs and adding up the dollars, which is exactly what the test asks for, and exactly why it has to be phrased in quarters rather than in percent.
The cumulative column is where that lands. One full year of this company’s real, GAAP earnings comes to $3.80. Three years of “one-time” charges come to $3.96, and the crossing happens at 11.52 quarters — so somewhere inside the twelfth quarter the pile of separately non-recurring items grows larger than an entire year of everything the company actually earned. No individual disclosure along the way ever looked different from the first one.
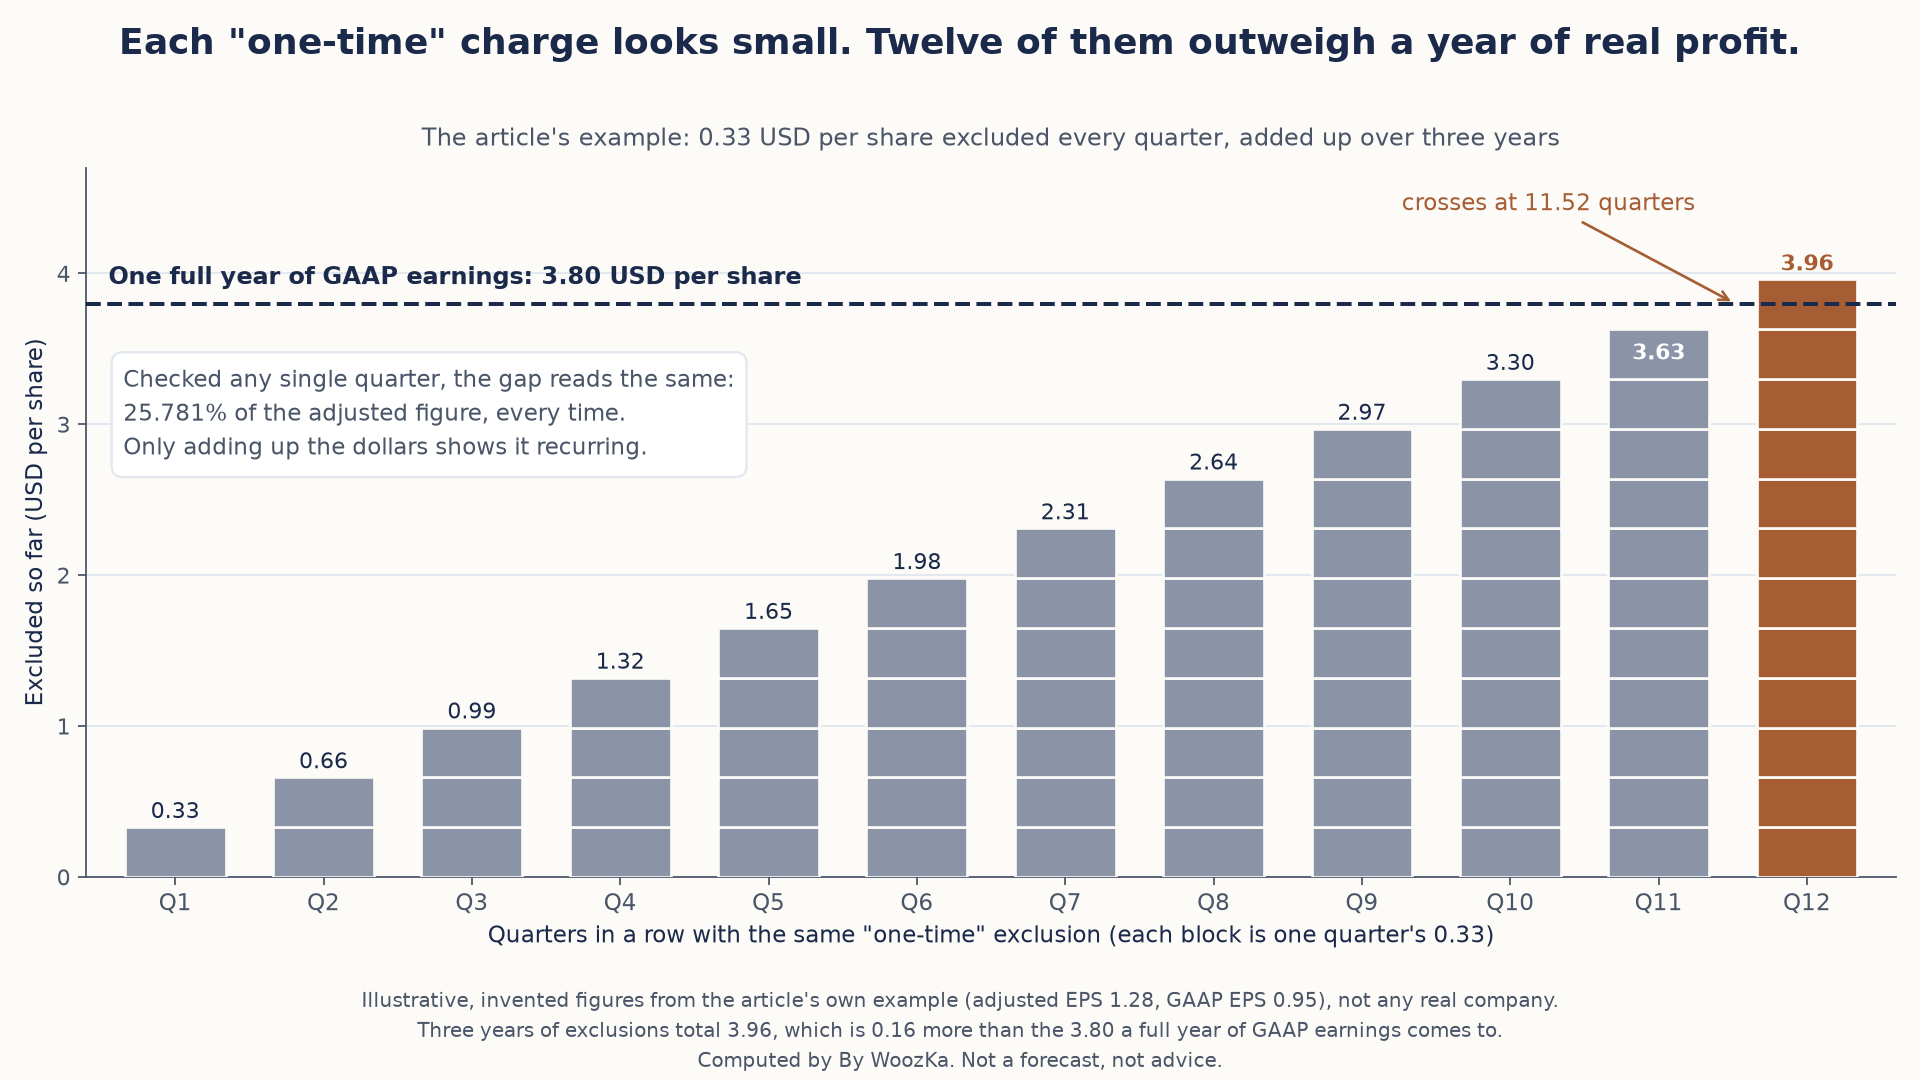
Checked one quarter at a time, the gap never changes size, which is why a recurring exclusion is easy to miss. Added up, three years of it exceed a whole year of what the company actually earned.
The Ten-Minute Order That Takes Weeks
The six-step order above is offered as roughly ten minutes of work. Four of the six steps can be done the moment the release lands: revenue, diluted earnings per share, the GAAP-to-adjusted reconciliation that must accompany any non-GAAP figure a company reports, and guidance. The other two cannot. Free cash flow and the MD&A exist only inside the 10-Q or the 10-K, whose deadlines this article gives in full several sections earlier without ever connecting them to the order it later recommends. Connected, they say that a third of the sequence is unavailable on the day everyone else is reacting.
| Filer class | Q1-Q3 wait | Q4 wait | Extra wait | Multiple |
|---|---|---|---|---|
| Largest filers | 40 days | 60 days | +20 days | 1.500x |
| Smaller filers | 40 days | 75 days | +35 days | 1.875x |
| Smallest filers | 45 days | 90 days | +45 days | 2.000x |
The fourth quarter is the anomaly, and it follows from something this article states plainly elsewhere: companies file only three 10-Qs a year, because the 10-K absorbs the fourth quarter. So the release that arrives carrying full-year results and next year’s guidance — the most heavily covered of the four — is also the one whose standardized, MD&A-bearing document is permitted to arrive last. For the smallest filers that wait is exactly double the other three quarters; for the largest it is half again as long. Averaged across a year, the outer limit runs 45.00 days for the largest filers and 56.25 for the smallest.
None of that is an argument for skipping the release. It is the reason the reading order is worth returning to rather than performing once: the two steps that test whether the profit was real are the two that are not there yet.
What the three tables use, and the boundary around them. Every figure above is arithmetic on numbers this article already publishes — the three earnings figures from its own opening example, the twelve-quarter span from its own three-year test, and the filing deadlines from its own summary of them. Nothing is sourced from outside the article and no new claim about any company is made. The three earnings figures are, in this article’s own words, an illustrative example with invented figures; multiplying an illustration leaves it an illustration, so the dollar amounts describe nobody. The structural results do not depend on those inputs and are proved rather than asserted: scale-invariance holds across a grid of adjusted-to-GAAP pairs at every quarter count from one to forty, and the claim that diluted earnings per share can never exceed basic was checked over 38,025 combinations of income, share count and dilutive shares. The filing figures are the outer limits the deadlines permit, not typical practice — many companies file well inside them, and the article’s own claim is only that the filing arrives after the release. Whether an exclusion is legitimate is a judgment this arithmetic cannot make; a genuinely one-time charge produces the same gap in a single quarter as a permanent one, which is the whole reason the test counts quarters. Nothing here models a share price and no result depends on one. The calculation behind these tables uses exact fractions, reports every figure above, and confirms that this article’s own arithmetic re-derives before it reports anything — that $1.28 against $1.22 is a beat, that $0.95 against $1.22 is not, and that four quarters minus the one the 10-K absorbs leaves the three 10-Qs the article says a company files. All of it does.
A Few Red Flags Worth a Second Look
Offered as things to investigate, never as automatic verdicts: an “adjusted” number that keeps excluding the same charge quarter after quarter; EPS that grows mainly because the company keeps buying back shares (shrinking the denominator) while actual net income is flat; revenue that only grows by acquiring other companies; accounts receivable or inventory rising much faster than sales (profit that hasn’t turned into collected cash); and a guidance cut tucked quietly into the call while the press-release headline stays upbeat. Each is a prompt to dig, not a conclusion — but a report that trips several of them at once deserves real skepticism.
The Honest Limits of All This
Read an earnings report carefully and you’ll understand a company far better than the person reacting to a one-line headline. What you won’t have is an edge. Reg FD means you can access the very same release, filing, and call the professionals see — but they, and their algorithms, have already read and traded on it before most of us open the page, which is a large part of why stock-picking is so hard and why most professionals still trail a simple index fund over time.
That’s not a reason to skip the reading; it’s a reason to be honest about why you’re doing it. Read earnings reports to know what you own, to catch the obvious problems, and to make deliberate decisions instead of emotional ones. For the core of most people’s money, the humble default — broad, low-cost index funds bought steadily — quietly outperforms most stock-pickers anyway, and reading individual companies is best treated as something you do with a portion of your money, eyes open, once that boring base is in place.
The natural next steps in this section build directly on this one: What Is a P/E Ratio and How Do You Actually Use It? turns the “E” you just learned to read into a valuation tool, How to Analyze a Company Before You Buy the Stock puts the earnings report inside a full top-down framework, and The Difference Between Trading and Investing frames how much any single quarter should drive your decisions. The weekly plain-English newsletter below is where these ideas get connected over time.
Disclaimer: This article is educational content, not financial advice. I am not a licensed financial advisor, and nothing here is a recommendation to buy or sell any security or asset. Investing and trading involve risk, including the possible loss of the money you invest. Do your own research and consider consulting a licensed financial professional before making investment decisions. Read the full Disclaimer.
Historical and backtested results are hypothetical, carry inherent limitations, and do not guarantee future results. Figures were accurate to the best of my knowledge as of this article’s last-updated date and may have changed.
