The Value Trap: How to Tell ‘Cheap’ From ‘Cheap for a Reason’
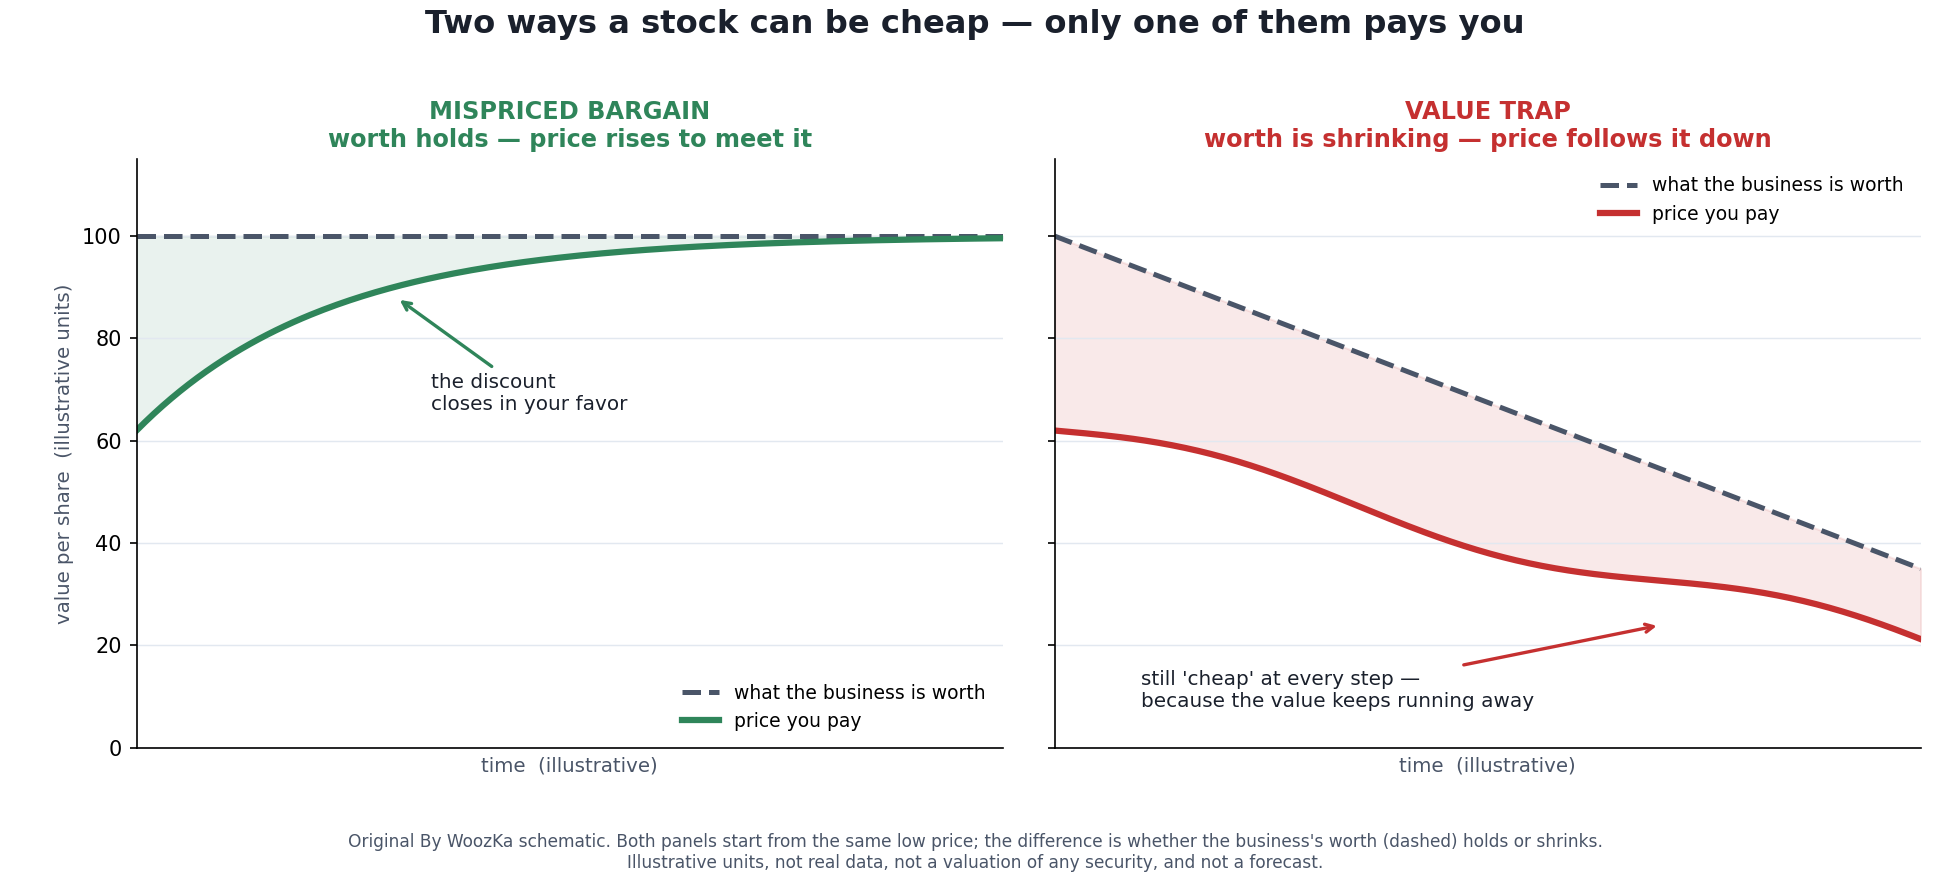
The whole problem in one picture. A cheap price can mean the market is wrong about a stable business — the discount closes and you get paid. Or it can mean the business is quietly shrinking and the price is right — the stock stays “cheap” the whole way down while the value runs away from you. From the outside, on the day you buy, the two look identical. Illustrative schematic, not real data.
Cheap stocks are seductive for an obvious reason: everyone wants to buy a dollar for sixty cents. But there’s a second, quieter reason a stock can trade for sixty cents, and it’s the one that empties accounts — the dollar was never a dollar. It’s ninety cents, and falling, and by the time you finish reading the balance sheet it’s eighty.
That’s a value trap: a stock that looks cheap on the numbers and stays cheap, or gets cheaper, because the business underneath it is genuinely deteriorating. The companion piece to this one, Value Investing, Honestly, calls distinguishing a real bargain from a trap “the actual skill of value investing” — and then, like most write-ups, moves on without teaching it. This article is the part that gets skipped: how you actually tell the two apart before you buy, why the most common tool for spotting bargains is also the one that hides traps, and the uncomfortable admission at the end that no diagnostic gets this right for free.
This is a stocks article about a single, well-worn idea in value investing. It is not a recommendation to buy, avoid, or short any company named here, and every figure below is history, not a forecast.
Cheap Is Not a Verdict. It’s a Question.
Start with what a low valuation actually tells you, because the mistake begins here. A stock trading at a low price-to-earnings ratio, a low price-to-book, or an eye-catching dividend yield is telling you one thing for certain: other investors are unwilling to pay more. That’s it. The low multiple is the market’s collective shrug. It does not tell you whether the market is being too pessimistic — the bargain — or exactly pessimistic enough — the trap.
The value investor’s whole edge rests on the market sometimes being wrong. And it is, sometimes. But “the market is too gloomy about this” and “the market has correctly priced a dying business” produce the identical symptom: a cheap-looking stock. The number in the screen is the same. The difference is entirely in the business behind it, and the business is where you have to look. A cheap price is the beginning of the analysis, not the conclusion of it.
Here’s the framing I’d want a beginner to internalize before anything else: the market is not a charity that leaves twenty-dollar bills on the sidewalk for no reason. Usually, when something is cheap, there’s a reason, and the reason is often good. Your job isn’t to assume the reason is wrong. It’s to find the reason, look straight at it, and decide — with a margin for being mistaken — whether the market has overreacted to it. Most people who lose money in “value” stocks skipped that step. They saw a low multiple, felt clever, and bought the shrug.
The Denominator Problem: Why Low P/E Lies Loudest When It Matters Most
The single most common way a trap disguises itself as a bargain runs through the most popular cheapness metric of all: the price-to-earnings ratio. And the flaw is arithmetic, not psychological.
A trailing P/E divides today’s price by the last year’s earnings. Those earnings already happened. If a business is deteriorating, last year’s earnings are the high-water mark — the best number it will post for a while — and dividing by them makes the stock look its cheapest at the exact moment it’s becoming most dangerous. The multiple isn’t measuring the future you’re buying. It’s measuring a past that’s ending.
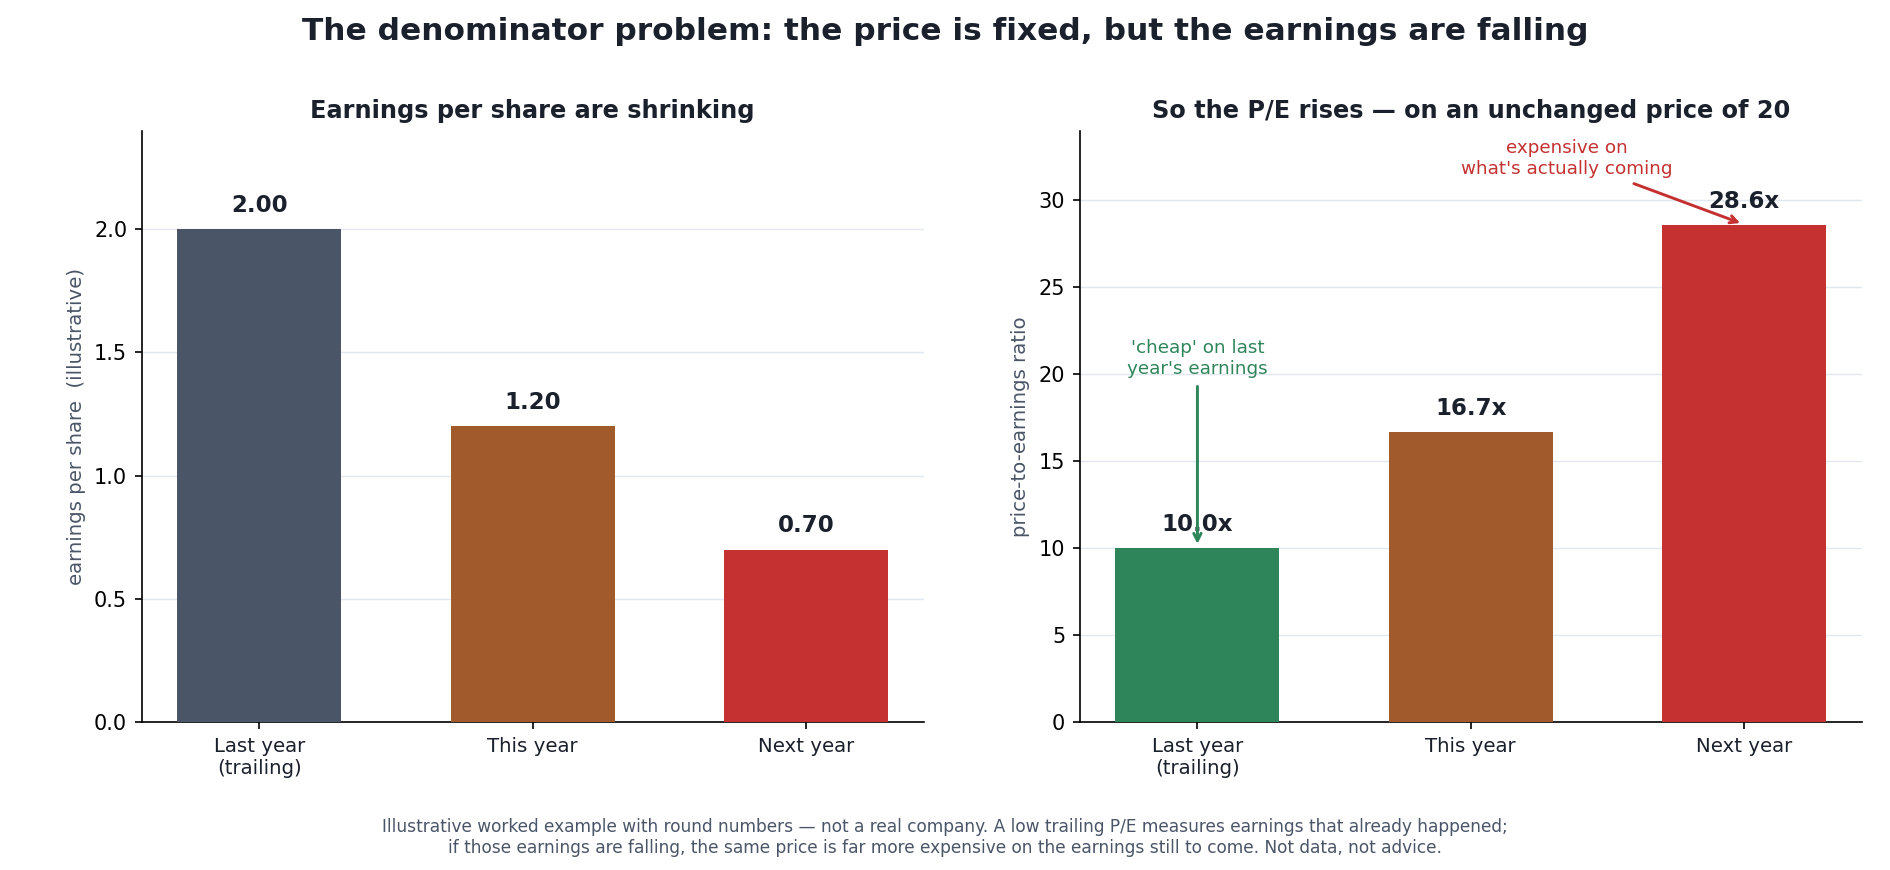
Watch the trick. The price never moves — it sits at 20 the whole time. But because earnings are falling, the same price is a “cheap” 10 times last year’s earnings and an expensive 28.6 times next year’s. The low trailing P/E that pulled you in was a photograph of a business that no longer exists. Illustrative numbers, chosen to make the mechanism visible.
This is why “it’s only trading at 8 times earnings!” is not, on its own, an argument for anything. Eight times what earnings? If those earnings are stable or growing, eight times is genuinely interesting. If they’re sliding — because a product is being disrupted, a commodity cycle is rolling over, or a one-time boom is unwinding — then eight times trailing is really twenty times next year, and you’ve bought expensive while feeling thrifty. The fix is not complicated to state, though it takes real work to do: judge cheapness against durable, forward earning power, not the trailing number the screener hands you. A big gap between a low trailing P/E and a much higher forward P/E is one of the loudest trap alarms there is.
The same denominator trap wears other costumes. A dividend yield that suddenly looks generous is often generous because the price collapsed, not because the payout grew — and a market pricing in a dividend cut is usually right. A low price-to-book on a company whose assets are worth less than the accountants say — obsolete inventory, a factory nobody wants, goodwill from a bad acquisition — is cheap against a book value that’s fiction. In every version, the cheapness is real and the thing it’s cheap relative to is quietly rotting.
A Six-Question Diagnostic
There’s no formula that sorts bargains from traps, and anyone selling one is selling the thing that doesn’t exist. What you can do is interrogate the business along the dimensions where deterioration actually shows up. None of these is decisive alone. Together they shift the odds, which is the most any honest process claims.
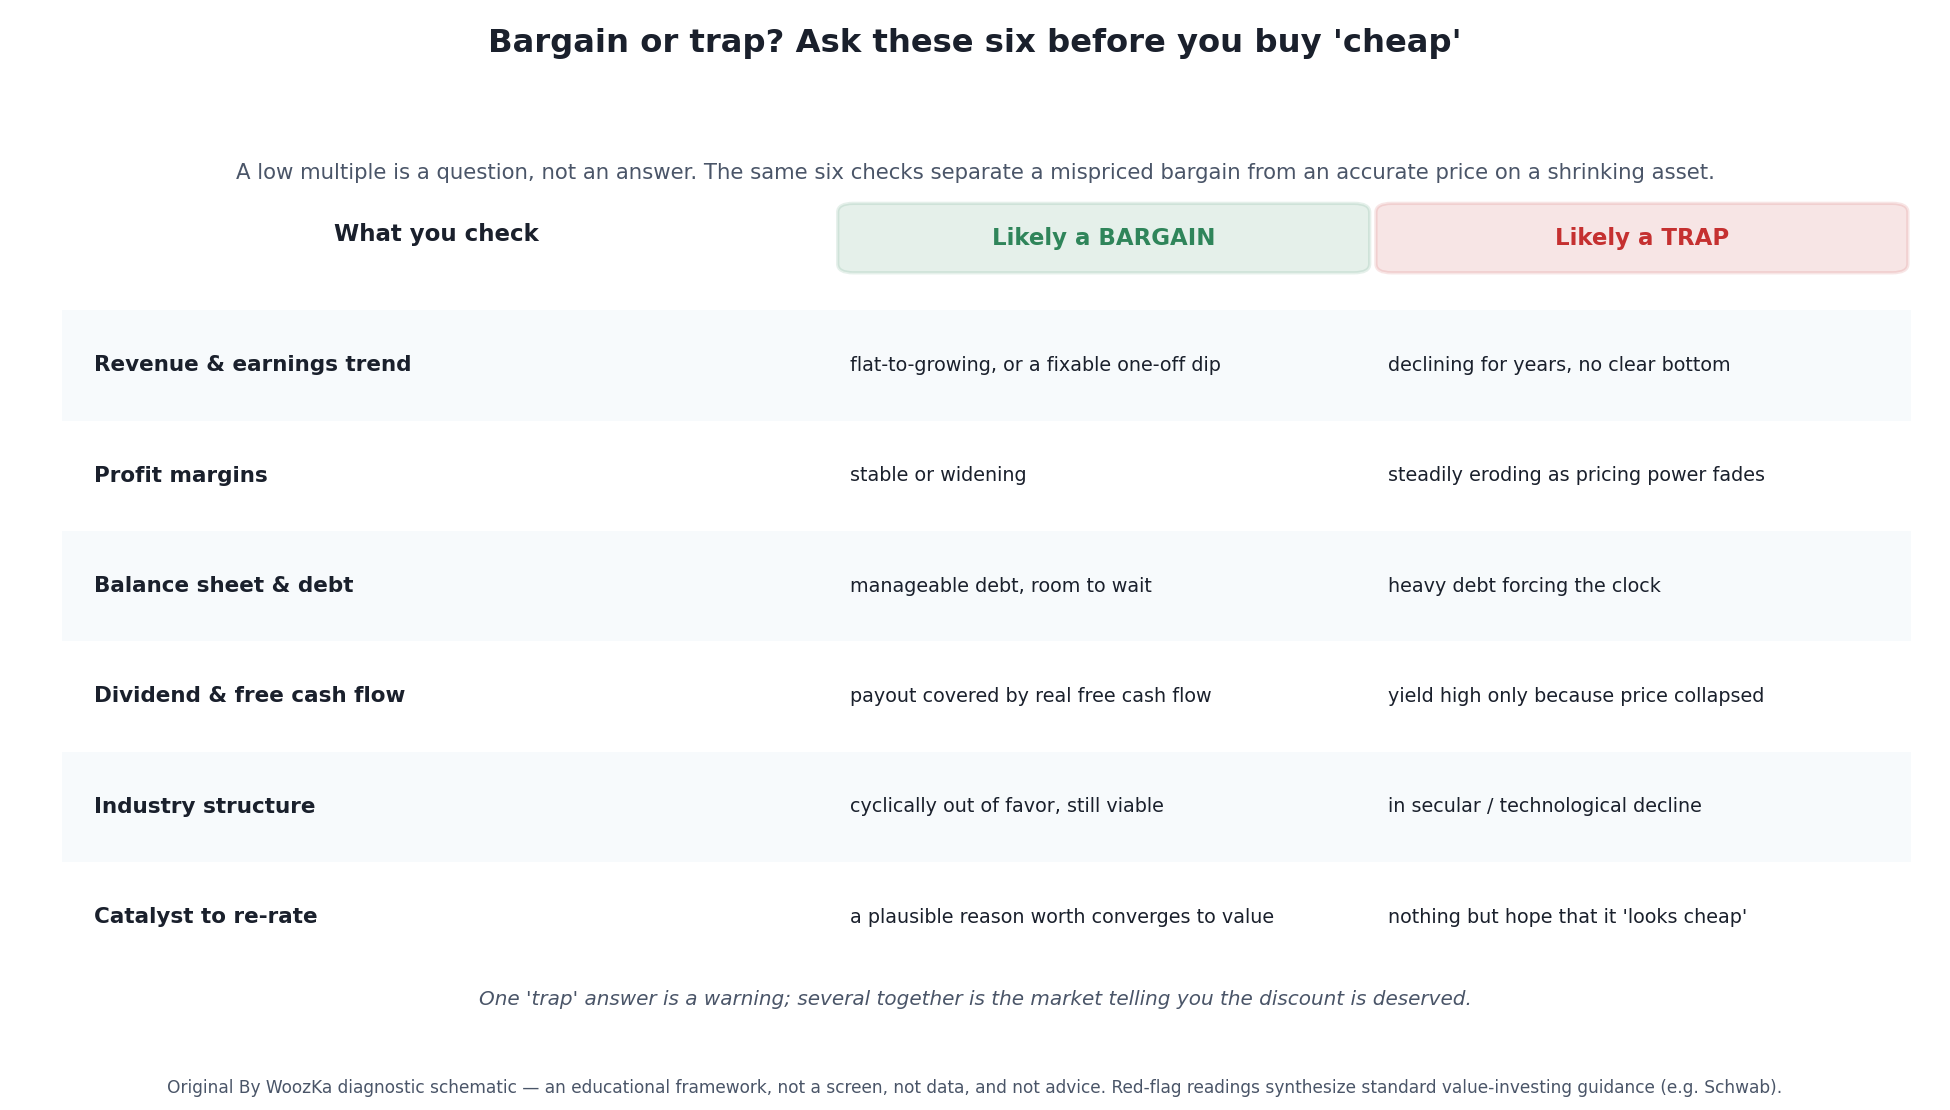
Six questions, each with a bargain reading and a trap reading. The point isn’t to score them mechanically — it’s that these are where a deteriorating business gives itself away. One “trap” answer is a caution flag; several pointing the same direction is the market explaining, out loud, why the stock is cheap. Educational framework, not a screen.
Walk the six quickly. Revenue and earnings trend — is the low multiple sitting on top of a business that’s flat-to-growing with a fixable one-off dip, or one that’s been declining for years with no bottom in sight? A single bad quarter is noise; a five-year slide is a message. Margins — stable or widening margins say the company still has pricing power; margins eroding year after year say competitors or substitutes are winning, and cheap will get cheaper. The balance sheet — modest debt buys the patience a turnaround needs; heavy debt starts a clock the business may not beat, and forces asset sales or dilution at the worst time. Dividend and free cash flow — is the payout covered by real cash the business generates, or is the “yield” just a byproduct of a collapsed price, with a cut coming? Free cash flow is the honest cross-check here because it’s much harder to dress up than reported earnings. Industry structure — this is the big one, and I’ll come back to it: a cyclically out-of-favor but still-viable industry is where real bargains hide; a secularly declining one is where traps breed. And finally, a catalyst — is there a concrete, nameable reason the price should converge back toward value (a new product, a spun-off division, a cycle turning, a fixable management problem), or is the entire thesis just “it looks cheap”? “Cheap” is not a catalyst. Cheap things can stay cheap for a decade.
Industry structure deserves the extra weight because it’s the difference between the two failure modes. A cyclical downturn — housing, energy, semiconductors, autos — hammers earnings temporarily; the business is fundamentally sound and the cycle eventually turns, which is precisely the setup a patient value buyer wants. A secular decline — a technology or a consumer habit permanently moving away from the product — hammers earnings for good. Cheap on a cyclical trough can be the trade of the decade. Cheap on a secular slide is a trap with a countdown timer. Telling a cycle from a secular shift in real time is genuinely hard, which is the honest reason value investing pays a premium at all: if it were easy, the discount wouldn’t be there.
The six, in one table. Read the two columns against each other; one row rarely decides it, but three or four leaning the same way usually does.
| What to check | Points to a bargain | Points to a trap |
|---|---|---|
| Revenue and earnings trend | Flat-to-growing, or a fixable one-off dip | Declining for years, with no clear bottom |
| Profit margins | Stable or widening | Steadily eroding as pricing power fades |
| Balance sheet and debt | Manageable debt, with room to wait | Heavy debt forcing the clock |
| Dividend and free cash flow | Payout covered by real free cash flow | A yield high only because the price collapsed |
| Industry structure | Cyclically out of favor but still viable | In secular or technological decline |
| Catalyst to re-rate | A plausible reason worth converges to value | Nothing but hope that it “looks cheap” |
What a Real One Looks Like: Kodak
The textbook value trap of the modern era is Eastman Kodak, and it earns the title because it didn’t look like a disaster on the way down. For years, it looked like a bargain.
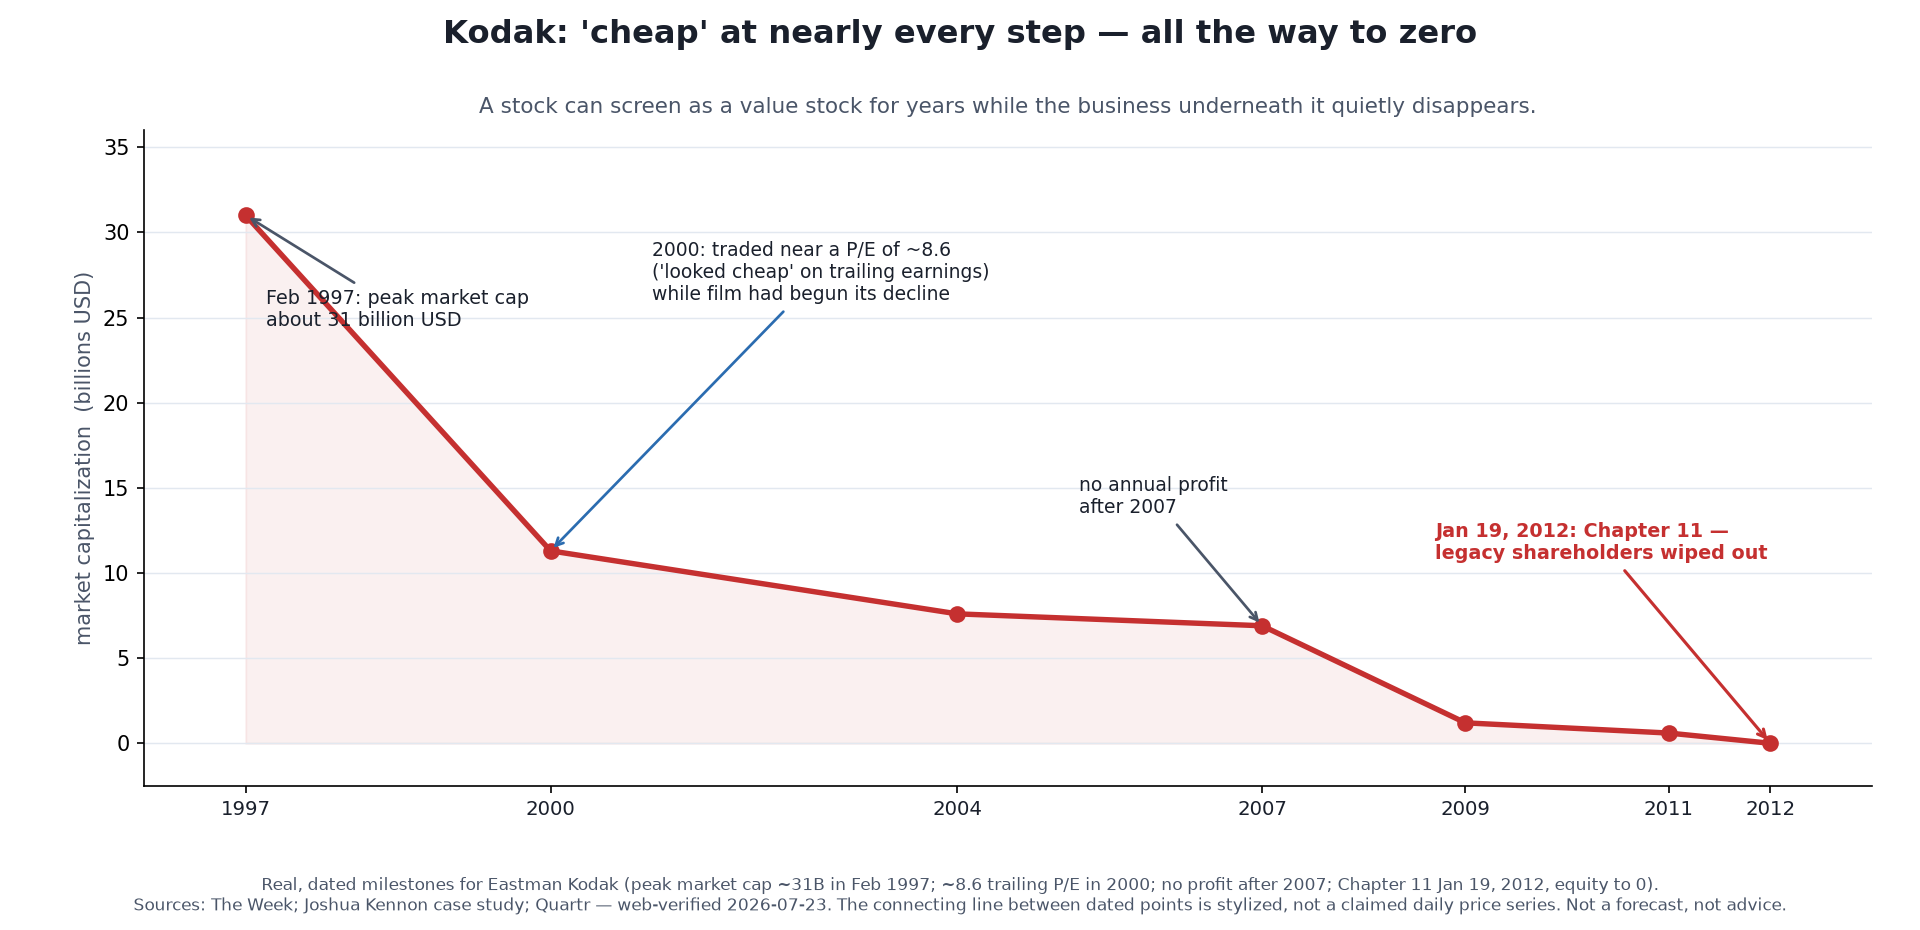
Kodak didn’t crash — it faded, which is why it trapped so many value buyers. At its 1997 peak it was worth about 31 billion dollars. By 2000 it traded near 8.6 times earnings, an “11.7% earnings yield,” statistically cheap enough to tempt anyone running a value screen — even as the film business that funded it had already begun its secular decline. It never turned an annual profit again after 2007, and in January 2012 it filed for bankruptcy and its legacy shareholders were wiped out. Dated milestones from public reporting; line stylized between points.
Run Kodak through the six questions and every one flashed red, in hindsight. Revenue and earnings: a long, structural slide, not a dip. Margins: eroding as film volumes fell. Industry structure: the worst kind of trap, a secular collapse — digital photography wasn’t a cyclical soft patch, it was the permanent end of Kodak’s core market. Catalyst: none that could offset a technology moving away from the product faster than the company could pivot. And yet, at almost every point on that descent, Kodak screened as a value stock — a low multiple, a storied brand, a fat historical earnings base. That’s the trap in its purest form: the metrics that attract value buyers were exactly the metrics a dying business throws off on its way down. Each year it looked cheaper than the last, and each year it was worth less than the year before, and the two facts were the same fact.
The lesson isn’t “avoid old industrial companies” or “technology always wins.” It’s narrower and more useful: a low multiple on a business in secular decline is not a discount, it’s an accurate price on a shrinking asset — and no amount of statistical cheapness rescues it, because the denominator keeps falling out from under the ratio.
If you’ve invested through even one full cycle, you’ve probably felt the pull of a value trap without having a name for it. The pattern is familiar: a well-known company, a price that’s fallen a long way, a valuation that looks too cheap to ignore, and a story you can tell yourself about why the market is being irrational. What most people learn — usually the expensive way — is that the comfort of a famous name and a low multiple is exactly what makes the trap work. The feeling of getting a bargain and the feeling of catching a falling knife are, in the moment, indistinguishable. The difference only becomes obvious later, which is no help at all when you’re deciding whether to buy.
The Honest Cost: A Trap Detector That’s Too Good Will Starve You
Here’s the part the confident “how to avoid value traps” articles leave out, and it’s the whole reason this is a style with a cost rather than a free lunch.
Every genuine bargain looks like a value trap on the day you buy it. That’s not a flaw in the diagnostic — it’s the nature of the thing. A stock gets cheap because something is wrong, or looks wrong, or is feared to be wrong. The pessimism that creates the discount is always backed by a real, scary-sounding reason. If a cheap stock came with an obviously fine business and an obviously wrong market, everyone would buy it and the discount would vanish before you got there. So the six questions above will flash at least one red flag on nearly every real opportunity, because a real opportunity is, by definition, a business the market is frightened of.
This creates a genuine trade-off, and you can’t escape it. Tune your trap detector too loose and you’ll buy Kodaks — falling businesses dressed as bargains. Tune it too tight and you’ll reject every stock that carries any fear at all, which means rejecting every actual bargain, because bargains only exist where fear lives. A value investor who successfully avoids all traps has almost certainly also avoided all the wins, and has effectively stopped being a value investor. The skill isn’t eliminating the false-positive problem. It’s living inside it — accepting that you will sometimes buy a trap and sometimes skip a winner, and trying to be right enough, often enough, that the bargains you catch outweigh the traps you don’t dodge.
And there’s a cognitive trap layered on top of the value trap: hindsight makes this all look easy, and it isn’t. Kodak is obvious now. It was not obvious to smart, disciplined value investors in 2003, some of whom bought it precisely because they’d read about value traps and concluded, wrongly, that this famous cheap stock was the mispriced kind. The six questions help. They do not turn an unknowable future into a known one, and any framework that promises they do has quietly walked back into the same overconfidence that springs the trap.
Three Claims, Counted
This article makes three quantitative arguments and settles all three in prose. It says a trap stays cheap the whole way down. It says one red flag is a caution while several together are the market explaining itself out loud. And it says a detector tuned tightly enough to catch every Kodak will also throw away every bargain, because bargains only exist where fear does. Each of those is arithmetic wearing an adjective, and each can be checked against numbers this article has already put on the page — sixty cents on the dollar, six questions, and a shareholder base wiped out entirely.
One neighboring calculation is left alone on purpose. Mapping a trailing multiple onto a forward one, and turning either into an earnings yield, belongs to What Is the P/E Ratio?, which does that job and ships the script for it. Nothing below re-runs it.
What the Screen Cannot See
Take the mildest possible version of a deteriorating business: earnings fall at a steady rate and the price falls at exactly the same rate, so the multiple never moves at all. Not down. Not up. A screener run every January reports the identical number, year after year, and every one of those readings is accurate.
What a hundred dollars becomes while the multiple sits still. Last column is how long the halving takes at that rate of decline.
| Earnings fall | After 1 yr | After 3 yr | After 5 yr | After 10 yr | Years to halve |
|---|---|---|---|---|---|
| 5% a year | 95.00 | 85.74 | 77.38 | 59.87 | 13.51 |
| 10% a year | 90.00 | 72.90 | 59.05 | 34.87 | 6.58 |
| 15% a year | 85.00 | 61.41 | 44.37 | 19.69 | 4.27 |
| 20% a year | 80.00 | 51.20 | 32.77 | 10.74 | 3.11 |
| 30% a year | 70.00 | 34.30 | 16.81 | 2.82 | 1.94 |
At a 15% annual slide the position is worth less than half after 4.27 years and roughly a fifth after ten, and at no point in that decade does the valuation give a single reading it did not give on day one. This is the weakest form of the disease — the case where the market marks the business down at precisely the speed it is shrinking, no panic, no discount, no falling knife. The Kodak path described above is worse than this, because there the multiple was compressing as well, which is what makes each year look cheaper than the last. So “it has stayed cheap” is not the reassurance it sounds like. Staying cheap is the mechanism.
One Flag, or Three
The six questions come with a rule of thumb: one trap answer is a caution, several leaning together usually decides it. The gap between those two thresholds is much larger than the phrasing suggests. Suppose each question independently raises a flag on a genuinely mispriced stock with probability f — the fear that created the discount showing up somewhere in the numbers.
How much of the bargain pool each threshold throws away. Six questions, flags arriving independently.
| Flag rate per question | At least 1 | At least 2 | At least 3 | 1 against 3 |
|---|---|---|---|---|
| 0.10 | 46.856% | 11.427% | 1.585% | 29.56× |
| 0.20 | 73.786% | 34.464% | 9.888% | 7.46× |
| 0.30 | 88.235% | 57.982% | 25.569% | 3.45× |
| 0.40 | 95.334% | 76.672% | 45.568% | 2.09× |
One question in five is enough to trip 73.786% of genuine bargains on a one-flag rule. Demand three and the same stocks are rejected 9.888% of the time — 7.46 times less often, from an identical set of questions asked of identical companies. The rule changed; nothing else did. That is the arithmetic behind refusing to treat a single red answer as a verdict, and it is why the starvation warning in the section above is not rhetorical: a one-flag rule is not a strict detector, it is a rule that discards most of what it was built to find.
The independence assumption is doing work here and should be said out loud rather than buried. In a business that really is dying, the flags are not independent at all — falling revenue, eroding margins and a stressed balance sheet are one illness with three symptoms, so they arrive together. In a business the market has merely become frightened of, there is usually one scary thing and the rest of the numbers are fine. That asymmetry is exactly what makes counting flags informative, and it also means the third column is a floor rather than an estimate.
How Often You Have to Be Right
The article’s own opening image fixes the reward: a dollar bought for sixty cents returns 66.667% if the discount closes. Its own worked example fixes the worst case: Kodak’s legacy shareholders were wiped out, which is a complete loss of the sixty cents. Those two numbers are a risk-reward pair, and a risk-reward pair has a required hit rate.
What the bargains have to cover. Every row buys at sixty cents against a dollar; only the bad outcome differs.
| When the trap resolves | What the sixty cents does | Reward-to-risk | Hit rate to break even |
|---|---|---|---|
| Wiped out entirely | −100.0% | 0.6667 | 60.000% |
| Halves | −50.0% | 1.3333 | 42.857% |
| Falls 30% | −30.0% | 2.2222 | 31.034% |
| Falls 15% | −15.0% | 4.4444 | 18.367% |
Buying dollars for sixty cents sounds like a wide margin and the top row says it is not: against outcomes that go to zero, a buyer has to be right three times in five merely to stand still. That is a demanding bar for a discipline whose central admission is that the two cases look identical on the day you buy. Move down the column, though, and the bar collapses — 60.000% to 18.367%, a range of 41.633 points, with the entry price and the upside held completely fixed. Nothing in those four rows describes a different kind of bargain. They describe a different kind of failure.
Which puts a number on why industry structure is singled out for extra weight. It is the question that decides which row you are standing in. A cyclical trough that recovers is a shallow row and forgives a poor strike rate; a secular decline is the top row and does not. Two of the other five questions can be wrong without much consequence. Getting that one wrong changes the arithmetic of the whole style. Nothing here says what any real investor’s hit rate is, and nothing here should be read as a claim that 60% is achievable — it is what the bad outcome demands, which is a different and more useful thing to know before committing to it.
Method and limits, so this can be checked rather than taken on trust. The inputs are the article’s: sixty cents against a dollar, a wipeout as the worst case, six diagnostic questions, and its own rule that one flag cautions while several decide. Price paths came from computeCompound and the required hit rates from computeRiskReward, both shipped on this site and both called with the article’s figures and copied down; separate code reconstructs all of them and reports nothing unless its own results match to nine significant figures. The flag table is exact binomial arithmetic, no simulation. Three limits are worth stating plainly. The decline table assumes a steady rate and a multiple pinned exactly still, which is the mildest path rather than a typical one. The flag table treats six correlated questions as independent, deliberately, and the paragraph beneath it says what that costs. And a breakeven hit rate assumes equal stakes and one round trip per position, so it is a bar to clear rather than a description of anyone’s record. No company here is assigned a probability, no share price is forecast, and none of this is a backtest.
So Where Does This Leave You?
If the honest conclusion is “you can’t perfectly tell bargains from traps,” what’s the diagnostic actually for? Three things, none of them a crystal ball.
It’s for slowing you down past the low multiple, so “it’s cheap” becomes the first question of your analysis instead of the last. It’s for naming the specific risk — cyclical versus secular, covered dividend versus collapsed price, real book value versus accounting fiction — so you’re making a considered bet on a knowable business rather than an anchored guess on a number. And it’s for sizing your humility: a stock that flunks several of the six isn’t forbidden, but it demands a bigger margin of safety, a smaller position, and a clearer catalyst than one that flunks none.
That’s the same honest place the companion piece lands the whole style. Value investing has a real edge over the long run and a real cost along the way, and a large part of that cost is precisely this — that the discipline requires you to buy things that look, on the surface, like mistakes, and to accept that you won’t always be able to tell your bargains from your traps until the market tells you, years later, which one you bought. For most beginners, that’s a strong argument for owning the whole market through a low-cost index fund and skipping the single-stock version of this problem entirely — a perfectly respectable choice, and the one I’d point a new investor toward first. If you do want to pick, the value trap is the thing standing between “cheap” and “bargain,” and the six questions are how you earn the right to tell them apart.
Where to Go Next
- Value Investing, Honestly: You’re Getting Paid to Be Patient — the companion piece: what the style is, the long-run value premium, and the lost decade that tested it. Read the two together.
- Growth Investing Is a Bet on Duration — the mirror image: why the market pays up for growth, and how that can trap you from the opposite direction.
- Growth vs Value Investing: Which Approach Fits Your Goals? — the two styles side by side.
- What Is a P/E Ratio and How Do You Actually Use It? — the metric at the center of the denominator problem, explained from the ground up.
- How to Build a 3-Fund Portfolio (And Why It Works) — the case for skipping single-stock trap-spotting entirely.
If you want the plain-English, evidence-first read on investing styles — the costs shown, never the hype — that’s what the newsletter is for. Subscribe below.
Disclaimer: This article is educational content, not financial advice. I am not a licensed financial advisor, and nothing here is a recommendation to buy or sell any security or asset. Investing and trading involve risk, including the possible loss of the money you invest. Do your own research and consider consulting a licensed financial professional before making investment decisions. Read the full Disclaimer.
Historical and backtested results are hypothetical, carry inherent limitations, and do not guarantee future results. Figures were accurate to the best of my knowledge as of this article’s last-updated date and may have changed.
