Value Investing, Honestly: You’re Getting Paid to Be Patient — and the Payment Isn’t Guaranteed
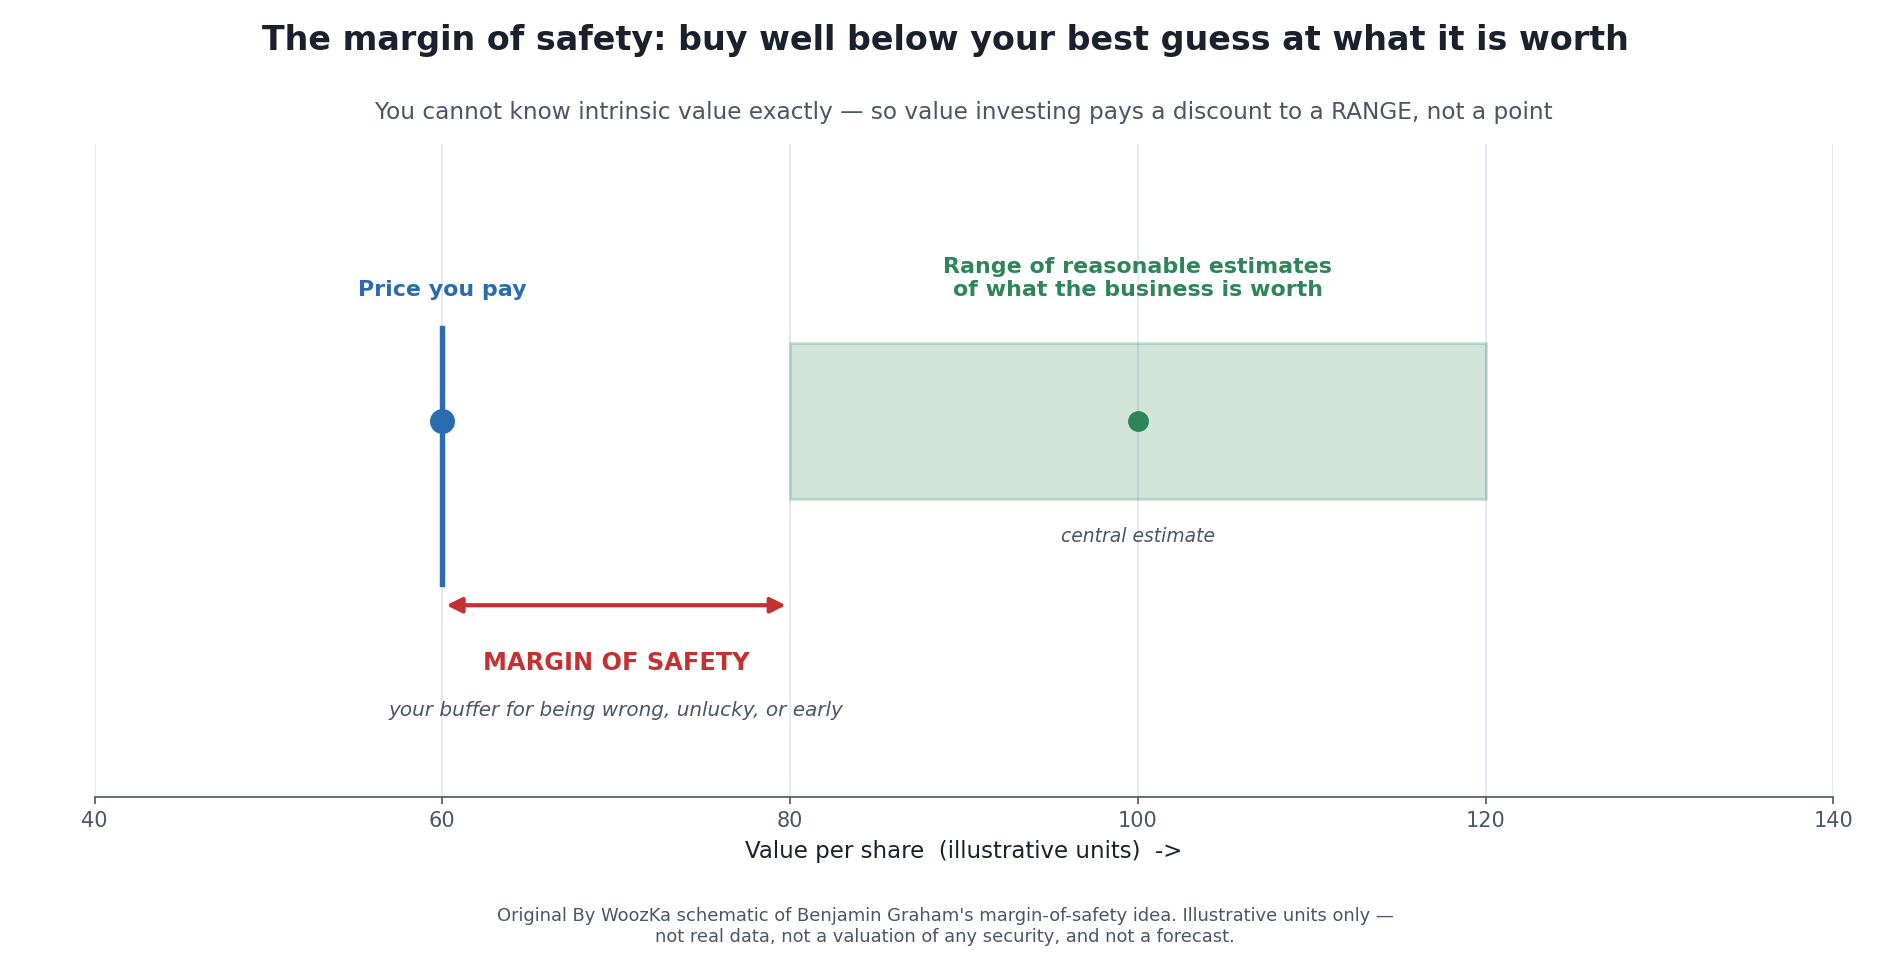
The whole style rests on one humble admission: you cannot know exactly what a business is worth. So instead of paying your single best guess, you pay a discount to a whole range of reasonable guesses — and the gap is your margin for being wrong. Illustrative schematic, not a valuation of anything real.
Value investing has a public image problem. It gets described as “buying cheap stocks,” which makes it sound both obvious and a little cheap itself — as though the whole discipline were rummaging through a clearance bin. That framing misses what the style is actually doing, and it hides the two things a beginner most needs to know: why buying a discount can pay, and why it can also make you wait years — sometimes more than a decade — while a growth-led market leaves you behind and everyone tells you the approach is dead.
This is a piece about value investing as a style — one of several honest ways to approach the market, with a genuine logic behind it and a genuine cost attached. It is not a case that value is the “right” way to invest, or better than growth, or a formula for beating the market. It is an attempt to explain the style the way a careful practitioner would: what you’re really buying, the evidence that the approach has an edge, the brutal stretch that tested that evidence, and the honest reasons it might suit you — or might not. If you haven’t opened an account yet, start with the section pillar, How to Open Your First Brokerage Account; everything here assumes you’re looking at real stocks and funds.
What You’re Actually Buying
Strip away the jargon and value investing rests on a single idea, and it’s older than most of modern finance: a share of stock is a claim on a real business, that business has some underlying worth, and the market price wanders around that worth rather than tracking it perfectly. A value investor tries to buy when the price sits meaningfully below a careful estimate of the worth, on the theory that price and worth tend to converge over time.
The phrase that anchors the whole style is Benjamin Graham’s margin of safety — the idea popularized in his writing and later carried forward by his student Warren Buffett. Here’s the subtlety most summaries skip, and it’s the point of the picture at the top of this article: you can never know a business’s intrinsic value exactly. Any honest estimate is a range, not a number, because it depends on assumptions about the future that no one can pin down. So the discipline isn’t “buy below intrinsic value” — it’s “buy far enough below your range of reasonable estimates that you can be wrong, unlucky, or early and still not lose much.” The margin of safety isn’t a bonus. It’s the buffer that keeps an ordinary mistake from becoming a permanent loss.
In practice, value investors look for stocks trading at low prices relative to fundamentals — a low price-to-earnings (P/E) ratio, a low price-to-book ratio, a higher-than-average dividend yield, prices near or below the accounting value of the company’s assets. These are the same traits that index providers use to sort the market into “value” and “growth” buckets. But the metrics are the symptom, not the strategy. The strategy is the judgment that the market has priced something too pessimistically — and the humility, baked into the margin of safety, that you might be the one who’s wrong.
The Evidence: Value Has Paid — Over the Very Long Run
Here’s where value investing earns its serious reputation, and it’s worth being precise, because this is the strongest thing anyone can honestly say for the style. Over very long periods, cheaper stocks have, on average, out-returned expensive ones.
The finding has a name and a paper trail. In their landmark work in 1992 and 1993, economists Eugene Fama and Kenneth French formalized a “value premium” — a tendency for stocks with high book-to-market ratios (value stocks) to earn higher average returns than low book-to-market stocks (growth stocks) — and built it into their famous three-factor model as the factor they labeled HML, for “high minus low” [source: Fama & French, “The Cross-Section of Expected Stock Returns,” Journal of Finance, 1992; and “Common Risk Factors in the Returns on Stocks and Bonds,” Journal of Financial Economics, 1993]. The magnitude is meaningful: in US data going back to 1927, value stocks have outpaced growth stocks by roughly 4 percentage points a year on average, and Fama and French found a comparable value premium internationally — about 7.7% per year across global markets over 1975–1995 [source: Fama & French, “Value versus Growth: The International Evidence,” Journal of Finance, 1998; summarized by Dimensional Fund Advisors, “When It’s Value vs. Growth, History Is on Value’s Side”].
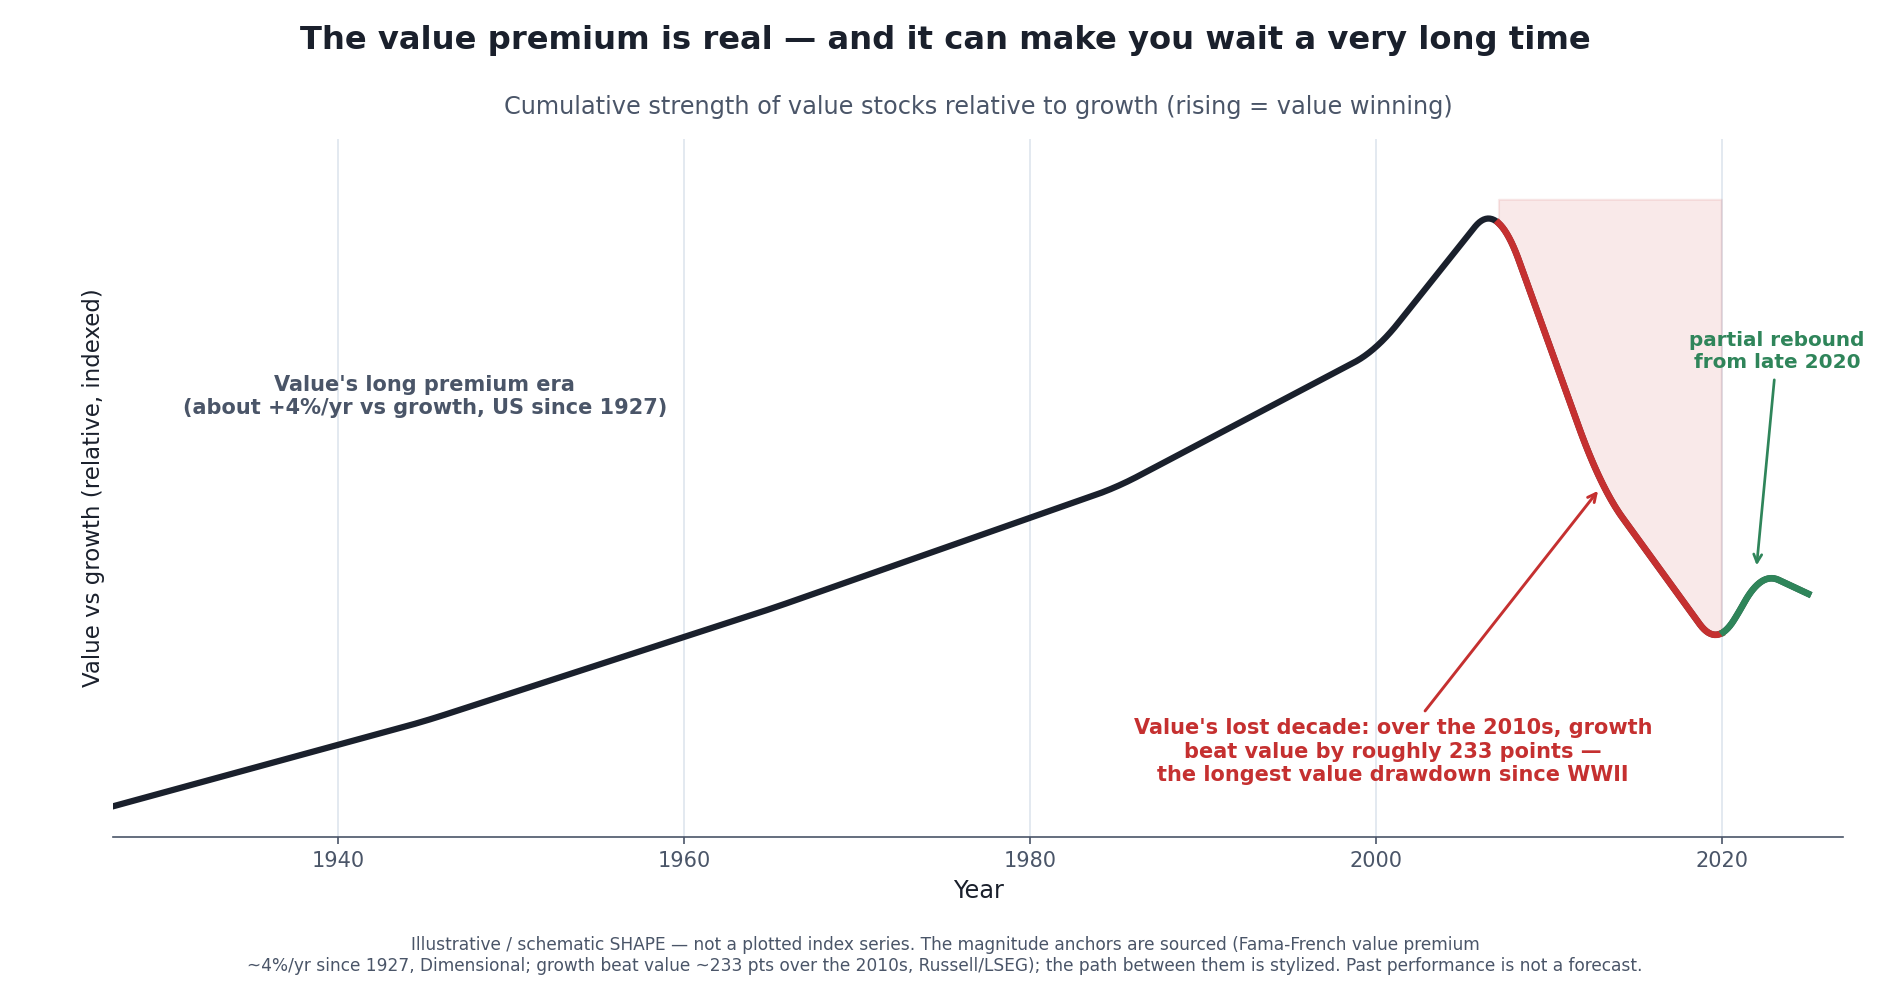
The reason value is hard to hold, in one picture. The long-run premium is real — value has averaged about 4% a year over growth since 1927 — but “on average, over the long run” is doing enormous work in that sentence. The rising black line is the premium era; the red stretch is the lost decade that tested everyone; the green tick is the recent, partial rebound. Illustrative shape anchored on sourced figures, not a plotted index and not a forecast.
Two words in that paragraph are carrying the entire weight of it: on average. A premium that shows up over a century is not a premium you can count on over a year, a market cycle, or even a decade. Which brings us to the part of the story that the cheerful summaries leave out — and the part a beginner most needs to hear before adopting the style.
What the Style Costs You: The Lost Decade
Between roughly 2007 and 2020, the value premium didn’t just fail to show up — it went sharply into reverse. Growth stocks, led eventually by a handful of enormous technology companies, crushed value for so long that serious people wrote value investing’s obituary. Over the 2010s, the Russell 1000 Growth index beat the Russell 1000 Value index by something on the order of 233 percentage points — a gap so wide it made a decade of patience look like a decade of stubbornness [source: LSEG/FTSE Russell, “Trends in growth and value: Cycles and market regimes”; J.P. Morgan Asset Management, “Value vs growth investing: A historical overview”]. Analysts described it as the longest drawdown value had endured since World War II, and the underperformance was nearly universal — across geographies, sectors, and valuation metrics [source: Hartford Funds, “The Cyclical Nature of Growth vs. Value Investing”].
This is the honest cost of the style, and it’s not a footnote — it’s the main event for anyone deciding whether value fits them. Adopting value investing means signing up for the possibility that you will be wrong, or look wrong, for years. Not because you made a bad stock pick, but because the entire style can sit out of favor for a stretch long enough to break most people’s conviction. The academic premium is measured over decades precisely because it has to survive periods like this one to exist at all. A strategy whose payoff is “positive on average over 90 years” is, by construction, a strategy that spends long stretches underwater — and the investor who bails at the bottom of one of those stretches converts a long-run average into a personal loss.
There’s a specific trap inside the style that deserves its own name: the value trap. A stock can be cheap because the market is wrong about it — the value investor’s dream — or cheap because the market is right and the business is genuinely deteriorating. A low P/E on a company whose industry is being permanently disrupted isn’t a bargain; it’s an accurate price on a shrinking asset, and it can keep getting “cheaper” all the way down. Distinguishing the two is the actual skill of value investing, and it’s much harder than screening for low multiples. The margin of safety is your defense here too: it doesn’t tell you which cheap stocks are traps, but it limits the damage from the ones that turn out to be.
What “On Average” Is Worth, by Horizon
This article names its own weak point out loud — two words, on average, carrying the entire weight of the evidence — and then leaves them unpriced. They can be priced, using nothing but the 4 percentage points a year the section above reports, compounded.
One premium, eight horizons. A constant 4-point annual advantage, compounded. The last row is the full span of the record the figure is drawn from.
| Years | Multiple | Cumulative |
|---|---|---|
| 1 | 1.0400× | 4.00% |
| 5 | 1.2167× | 21.67% |
| 10 | 1.4802× | 48.02% |
| 13 | 1.6651× | 66.51% |
| 21 | 2.2788× | 127.88% |
| 30 | 3.2434× | 224.34% |
| 50 | 7.1067× | 610.67% |
| 99 | 48.5625× | 4,756.25% |
That single column is the whole argument about value investing, laid out in one place. At a one-year horizon the premium is 4% — an amount any month of ordinary market noise can erase, and a completely unreasonable thing to build conviction on. Over the 99 years the record actually spans, the same unchanged number compounds to 48.56 times. Nothing about the premium differs between those two rows; only the patience does. A style whose headline figure is forgettable at one horizon and overwhelming at another is exactly the kind of style people argue about endlessly, because both sides can quote it honestly.
The Two Premiums, Put on One Footing
The evidence section quotes two numbers in consecutive sentences — roughly 4 points a year in US data since 1927, and about 7.7% a year across global markets over 1975–1995 — and moves on. They are not comparable as printed: different regions, different eras, and windows of 99 years against 21. Compounding each over the shorter study’s own window is the only like-for-like the article’s figures permit.
Both premiums over the same 21 years. This compares what each figure claims, not how reliable either is.
| Premium | Annual | Over 21 years |
|---|---|---|
| US, since 1927 | 4.0% | 2.2788× |
| International, 1975–1995 | 7.7% | 4.7482× |
A per-year ratio of 1.925× becomes a cumulative ratio of 2.0837× — compounding widens the gap, but far less than the annual figures make it feel like it should. And the widening is the smaller half of the story. The international number rests on a 21-year sample and the US number on 99, so the more impressive premium is also the one measured over less than a quarter of the history, on markets and a period the US figure does not cover. Both are quoted here as the article quotes them; neither is evidence for the other.
What Thirteen Years Costs a Ninety-Nine-Year Average
Now the section immediately above — the lost decade, dated roughly 2007 to 2020. Thirteen years inside a 99-year record is 13.13% of the calendar, which sounds survivable, and in one sense it is: the average survived. The compounding tells a harsher version.
The cost of sitting out, as arithmetic. A labeled hypothetical: it holds the other 86 years at 4% a year and gives the 13 nothing at all.
| Value | |
|---|---|
| Years of record | 99 |
| Years underwater | 13 |
| Share of the record | 13.13% |
| Premium those 13 years imply | 66.51% |
| Compounded over 99 years | 48.5625× |
| Compounded over 86 years | 29.1653× |
| Reduction | 39.94% |
Thirteen years are 13.13% of the record and removing them costs 39.94% of the compounded advantage — a little over three times their share of the calendar. That is not special to those particular thirteen years; because each year contributes the same multiplicative factor, any thirteen would cost the same. It is a fact about compounding rather than about the 2010s, and it is the arithmetic behind the article’s warning that a long-run average is not something you can draw on in the meantime. The same 13 years at the historical rate would have delivered 66.51%, which is the size of what the drought withheld from anyone who held value through it.
One figure from that section is deliberately left alone. The 233-percentage-point gap between growth and value over the 2010s is the difference between two cumulative index returns, and the article does not publish either index level. Without them the gap cannot honestly be turned into a ratio, an annual rate, or a number of years of premium — every one of those conversions needs a starting base that would have to be invented. It stays exactly as the article reports it.
Method and limits, so this can be checked rather than taken on trust. The 4 points a year, the 7.7% and its 1975–1995 window, the 1927 start of the US record and the 2007–2020 dating of the drought are all quoted from the sections above. Compounding was done with computeCompound, the shipped function behind this site’s Compound Growth Calculator, called directly and transcribed; separate code reproduces each transcribed value and checks every figure printed here before it reports anything. Two limits matter more than the rest. First, a realized premium is not a constant annual rate — compounding a long-run average as though it arrived evenly is a way of reading the average’s size, not a description of any decade, and the drought is the proof of that. Second, the record ends where this article’s sources end; 99 years is elapsed time since 1927, not a claim that the premium was measured through today. No index was reconstructed, no returns were estimated, and none of this predicts what the premium will do next.
When Value Tends to Do Better
If value underperformed for over a decade, what turned it? The clearest recent illustration came in 2022, and it connects value directly to the macro backdrop. When interest rates rose sharply that year to fight inflation, the stocks that fell hardest were the expensive, fast-growing ones — because a growth stock’s value is concentrated in profits expected far in the future, and higher rates discount those distant profits more heavily. (That mechanism is its own subject; the companion piece Growth Investing Is a Bet on Duration walks through it in full.) Value stocks, whose worth leans more on profits and assets that exist today, were far less exposed.
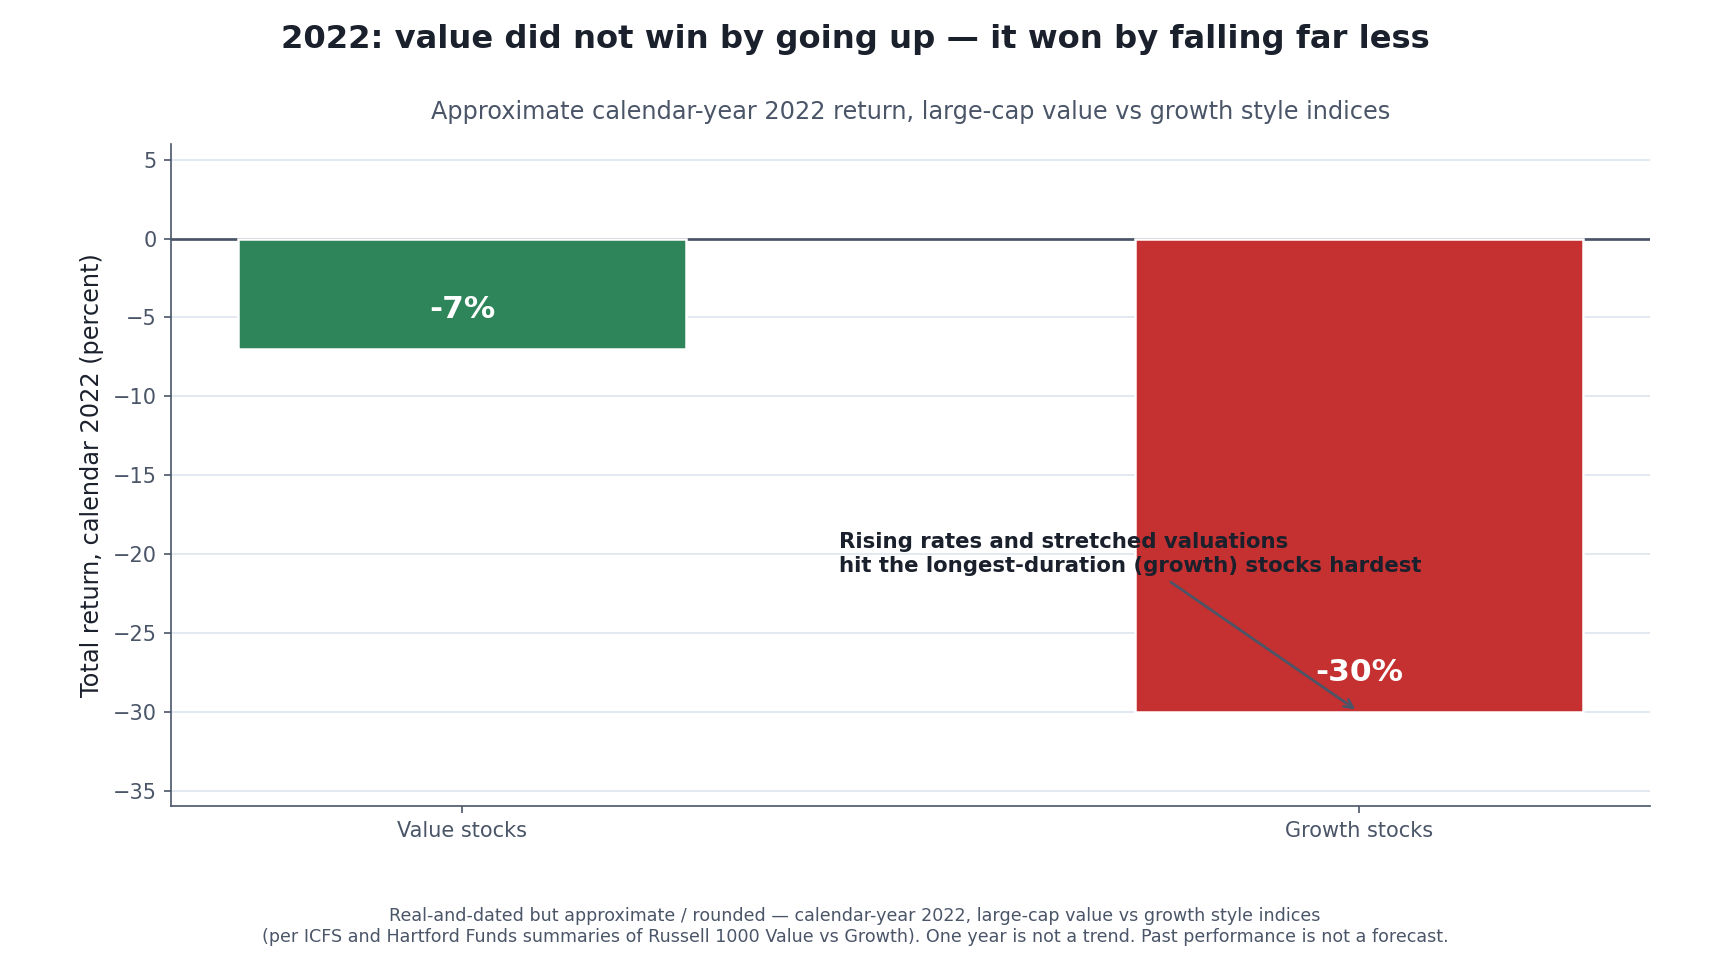
What a value “win” often looks like: not a gain, but a smaller loss. In 2022 rising rates punished the longest-duration growth names, and value’s relative advantage came from falling far less. It’s a useful illustration of the mechanism — and a reminder that one good year is not a trend. Approximate, rounded figures; not a forecast.
Notice what that chart does and doesn’t say. It shows the mechanism — value tends to hold up better when rates rise and when expensive stocks are priced for perfection — not a promise that value wins from here. Value has strongly outperformed growth since late 2020, which some read as the start of a genuine comeback after thirteen years in the wilderness; others read it as a bounce that says little about the next decade [source: Evidence Investor, “Is value making a comeback?”; Dodge & Cox, “Staying the Course in Value Investing”]. Both readings are honest, and no one gets to know which is right in advance. The useful takeaway is conditional, not predictive: value tends to fare relatively better when the market has paid up heavily for growth and when rising rates make distant profits less valuable — and worse when cheap money and a few dominant growth stories carry everything.
Why Does This Even Work? Finance Can’t Agree
Here’s the intellectually honest admission that separates a real explanation from a sales pitch: economists do not agree on why the value premium exists — or whether it still does in the same size. There are two broad camps, and the debate between them is genuinely unresolved.
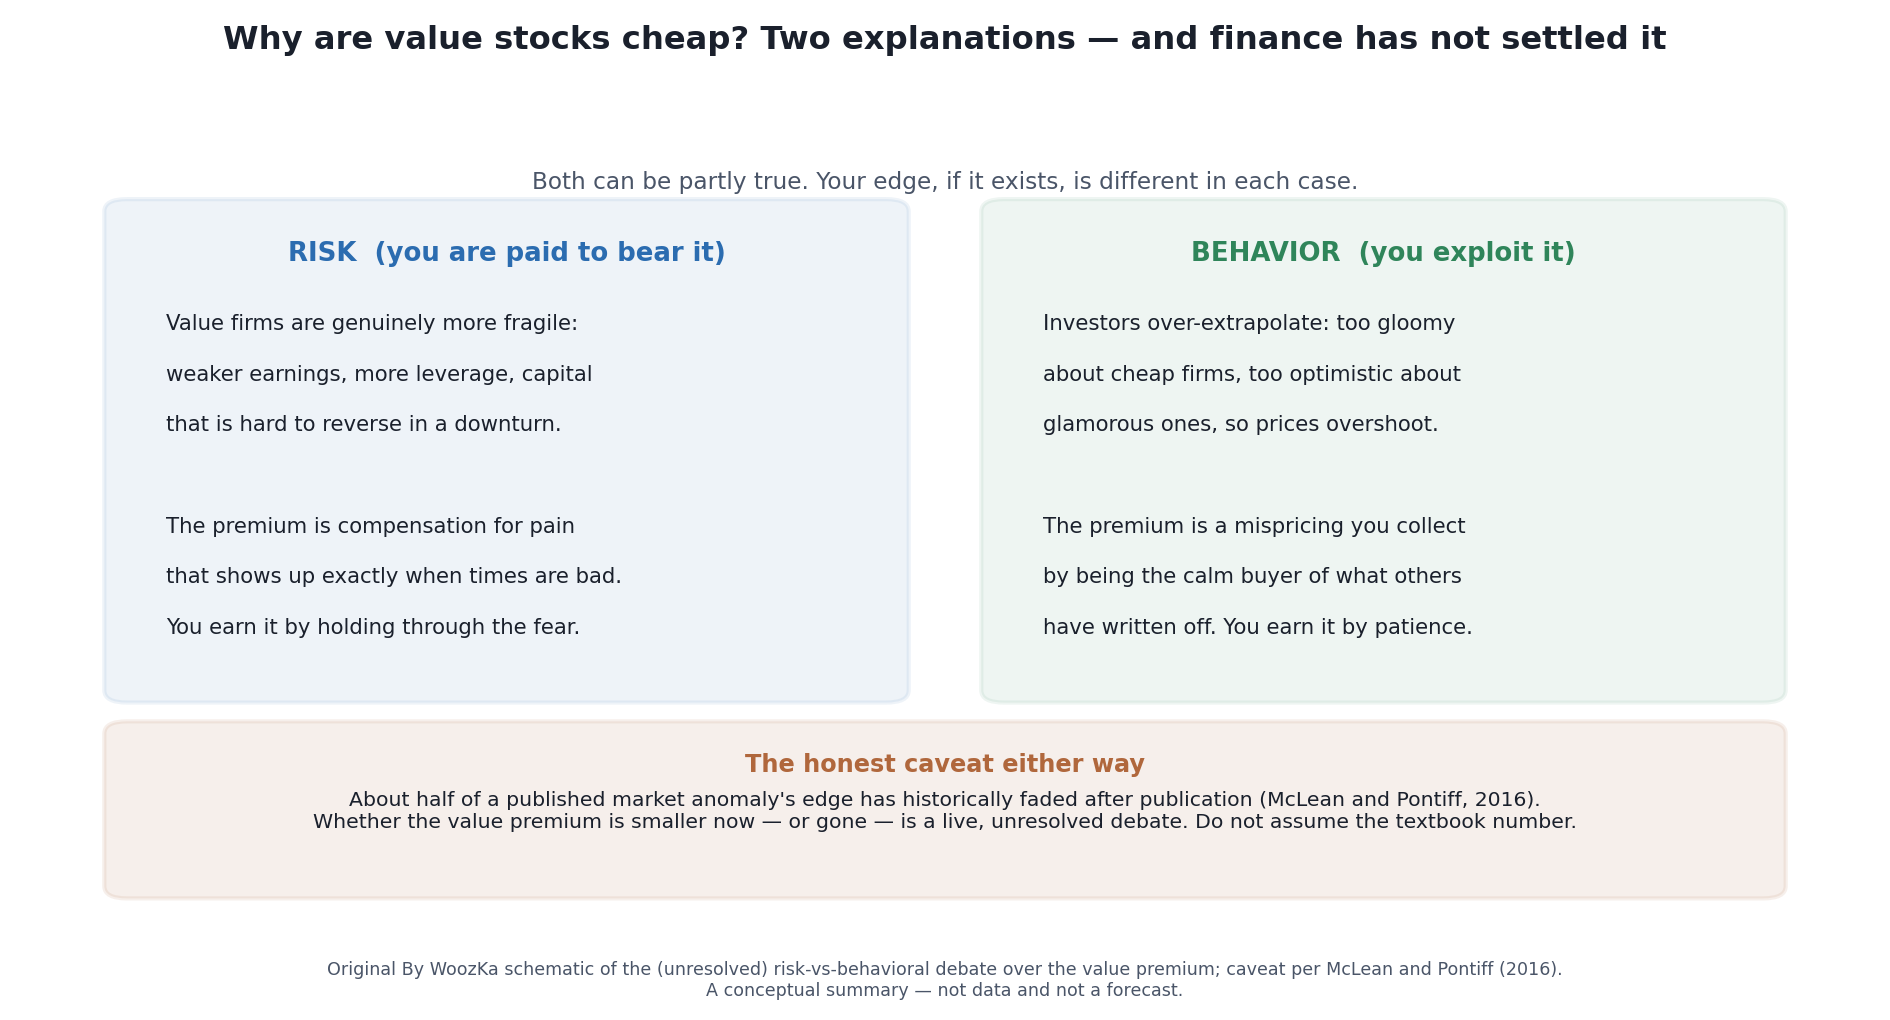
Even the experts don’t agree on the source of the edge. One camp says value stocks are genuinely riskier, so the extra return is your pay for bearing pain in bad times; the other says investors systematically misprice cheap firms, so it’s a behavioral mistake you collect by staying calm. Both may be partly right — and either way, published edges tend to shrink. A conceptual summary of a live debate, not a forecast.
The risk-based camp, associated with Fama and French themselves, argues the premium is compensation for genuine danger: value companies tend to be more fragile — weaker earnings, more debt, capital that’s hard to redeploy — and they suffer most exactly when the economy is stressed, so investors rationally demand a higher expected return to hold them [source: overview in Alpha Architect, “The Value Premium: Risk or Mispricing?”]. In this view, the premium is earned by bearing real risk, which also means it can hurt you badly at the worst possible moment. The behavioral camp argues the premium is a mispricing: investors get too pessimistic about dull, cheap companies and too optimistic about exciting, expensive ones, so prices overshoot in both directions and patient contrarians collect the difference when reality lands in between [source: Larry Swedroe, “The Value Premium: Reports of Its Death Have Been Greatly Exaggerated”].
Which camp is right matters, because it changes what you’re actually doing when you buy value — earning a risk premium you’ll have to suffer for, or exploiting a behavioral error that could get arbitraged away as more people learn about it. And that second possibility is the real caveat. A well-known 2016 study by David McLean and Jeffrey Pontiff found that the average published market “anomaly” saw roughly half its excess return disappear after it was published, consistent with investors reading the research and trading the edge away [source: McLean & Pontiff, “Does Academic Research Destroy Stock Return Predictability?,” Journal of Finance, 2016]. Whether the value premium specifically has shrunk, vanished, or merely gone quiet for a while is exactly the kind of question that has no settled answer — and anyone who tells you they know for certain is selling something. The prudent stance is the humble one: the long-run evidence is real, the future size of the edge is uncertain, and you should not assume the textbook number.
The two explanations, side by side. Finance has not settled which is right — and the honest caveat applies to both.
| RISK — you are paid to bear it | BEHAVIOR — you exploit it |
|---|---|
| Value firms are genuinely more fragile: weaker earnings, more leverage, capital that is hard to reverse in a downturn. | Investors over-extrapolate: too gloomy about cheap firms, too optimistic about glamorous ones. |
| So the premium is compensation — for pain that shows up precisely when times are bad. | So the premium is a mispricing, collected by patient buyers. |
The caveat either way: about half of a published anomaly’s edge has historically faded after publication [source: McLean and Pontiff, 2016], and whether the value premium is smaller now or gone is a live debate.
So Does Value Investing Fit You?
With the honest picture assembled, the useful question isn’t “is value good?” but “does this style match my temperament and my time horizon?” A few things have to be true for value investing to be a comfortable fit rather than a slow source of regret.
You need a genuinely long horizon — long enough that a multi-year stretch of underperformance is an inconvenience, not a catastrophe, because the evidence for the style only shows up over long periods and the bad stretches are measured in years. You need a contrarian temperament, or at least a tolerance for owning things other people find boring or frightening while a hotter part of the market runs away without you; the lost decade wasn’t hard because value lost money every year, it was hard because it made watching growth win feel like a personal failure. And you need to be honest with yourself about whether you’ll actually hold through the pain, because a value strategy abandoned at the bottom is worse than a strategy you never held — you’ve paid the cost of patience without collecting its reward.
None of that makes value superior. Plenty of thoughtful investors reasonably conclude the opposite — that they’d rather not sign up for a decade-long test of conviction, or that they’d rather own the whole market (value and growth together) through a low-cost index fund and skip the bet entirely, which is a perfectly defensible choice and arguably the right default for most beginners. Value investing is a legitimate style with a real logic and a real, sometimes brutal, cost. Understanding both is what lets you decide with your eyes open — which is the only kind of decision this blog is trying to help you make.
Where to Go Next
- Growth vs Value Investing: Which Approach Fits Your Goals? — the side-by-side comparison, if you want to see the two styles head to head.
- Growth Investing Is a Bet on Duration — why rising rates hit growth hardest, the mechanism behind value’s relative 2022 strength.
- How to Open Your First Brokerage Account — the section pillar, if you’re just getting started.
- How to Build a 3-Fund Portfolio (And Why It Works) — the case for skipping the style bet entirely.
If you want the plain-English, evidence-first read on investing styles — explained honestly, with the costs shown, never hyped — that’s what the newsletter is for. Subscribe below.
Disclaimer: This article is educational content, not financial advice. I am not a licensed financial advisor, and nothing here is a recommendation to buy or sell any security or asset. Investing and trading involve risk, including the possible loss of the money you invest. Do your own research and consider consulting a licensed financial professional before making investment decisions. Read the full Disclaimer.
Historical and backtested results are hypothetical, carry inherent limitations, and do not guarantee future results. Figures were accurate to the best of my knowledge as of this article’s last-updated date and may have changed.
