Dividend Growth vs High Yield: Which Should You Own — SCHD, VYM, and the Dividend Aristocrats
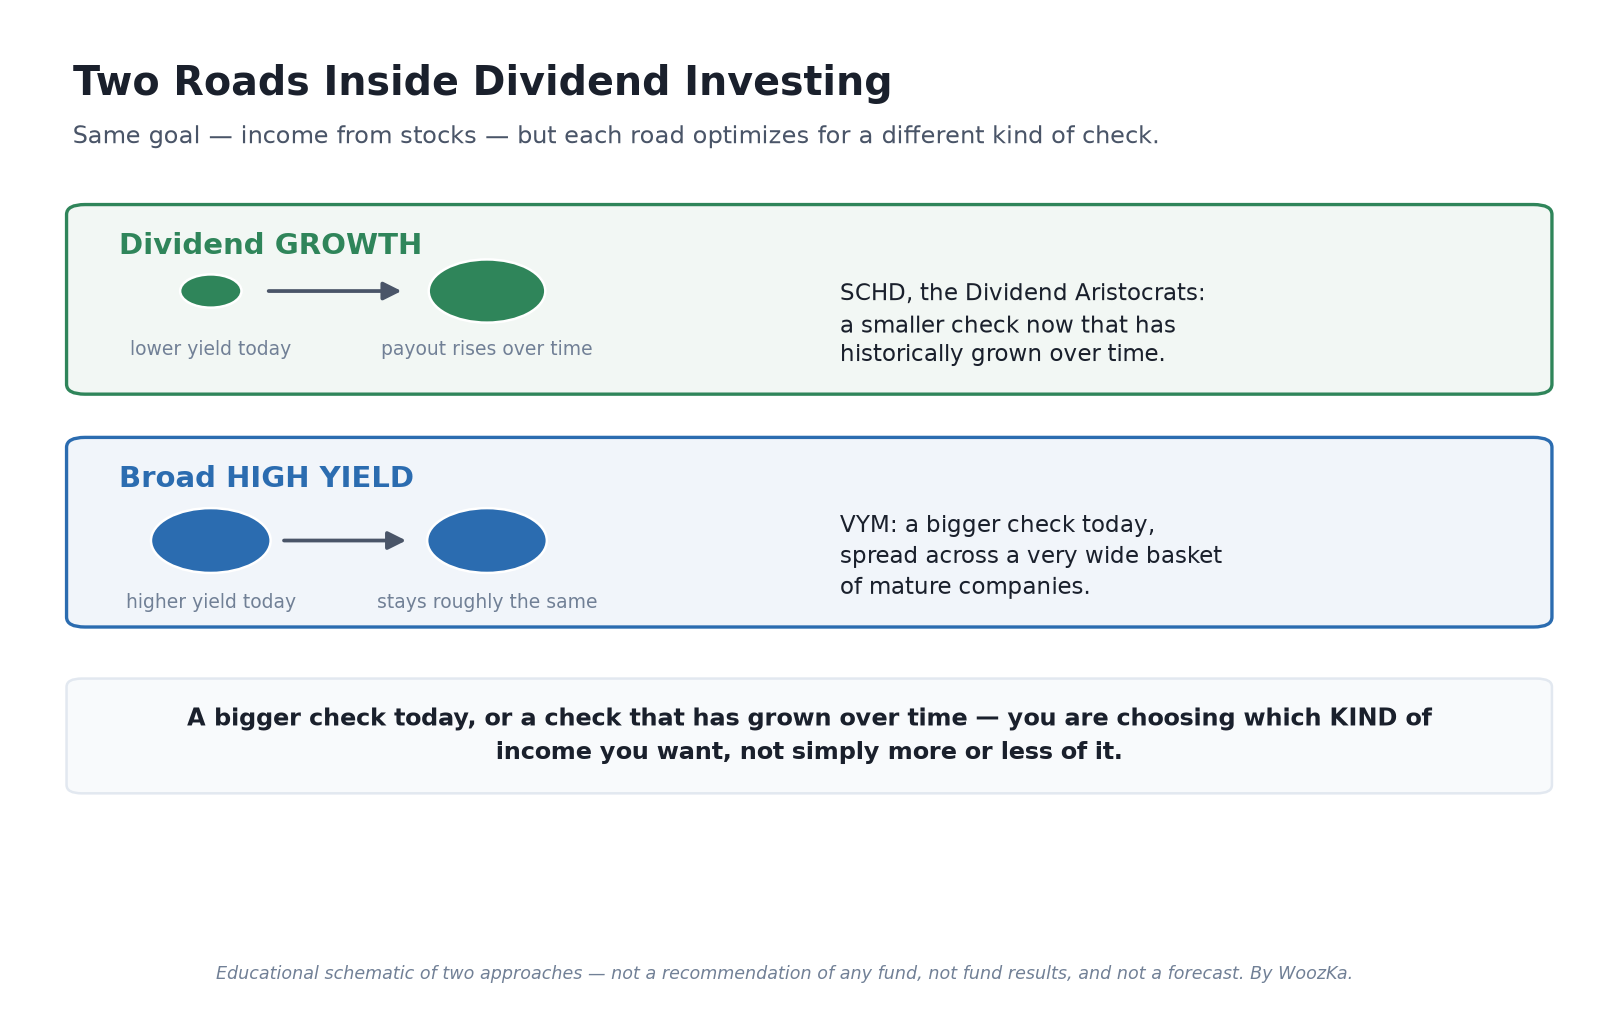
Before comparing dividend funds by their headline yield, it helps to see that “dividend investing” splits into two roads. One buys a smaller income today from companies with a long habit of raising their dividend, betting the payout grows. The other buys a larger income today from a very broad basket of higher-yielding companies. Neither is simply “more” — they are different shapes of income. Illustrative schematic, not advice.
A headline yield is an output of a strategy rather than a score, which is why SCHD, VYM and JEPI can all be called dividend funds and behave nothing alike. This piece zooms in on the choice most beginners actually face once they have ruled out the options-income funds: dividend growth versus broad high yield. It is the SCHD-versus-VYM question, and behind it sits an older idea — the Dividend Aristocrats — that explains what “dividend growth” is really trying to buy.
As always, naming a fund to explain a category is not a recommendation to buy it. If you do not have an account yet, start with the brokerage-account walkthrough; everything here assumes you can buy a share. And if “yield” and “total return” are not yet second nature, Dividend Investing 101 is the foundation this article builds on.
The One Question Underneath the Whole Comparison
Strip away the tickers and the choice is this: do you want more income now, or income that has historically grown later?
A high-yield fund hands you a bigger check today. A dividend-growth fund hands you a smaller check today from companies that have raised their payout for many years running, on the argument that a smaller check which keeps rising can overtake a bigger check that stays flat. That is the entire tension. It is not “safe versus risky” and it is certainly not “good versus bad” — it is a genuine trade between the size of the income now and the slope of the income over time.
Two things make this more than a slogan. First, a dividend that grows also tends to signal a company that is still growing its earnings, so dividend-growth baskets skew toward financially sturdier, more profitable firms. Second, none of it is guaranteed: a long streak of raises can end, and a company can freeze or cut its dividend in a bad year. “Has grown” is history, not a promise.
Dividend Growth: SCHD and the Dividend Aristocrats
The clearest way to understand dividend growth is the Dividend Aristocrats — the members of the S&P 500 that have paid and raised their dividend for at least 25 consecutive years [source: S&P Dow Jones Indices, S&P 500 Dividend Aristocrats methodology]. That 25-year screen is doing something specific: it filters for companies that kept increasing their payout straight through recessions, which is a rough proxy for durable earnings and disciplined management. The list is short and skews toward established consumer, industrial, and healthcare names, precisely because very few companies clear that bar.
The most-searched modern expression of this idea is the Schwab US Dividend Equity ETF (SCHD), which tracks the Dow Jones U.S. Dividend 100 Index and charges an expense ratio of 0.06% [source: Schwab Asset Management, SCHD fund page, 2026 — confirm current; Schwab can change the fund’s fee, and its page is the authority]. SCHD does not simply buy the highest yielders. Its index requires a company to have paid dividends for at least 10 consecutive years, then screens for quality and financial-strength measures (things like cash-flow-to-debt and return on equity) before selecting roughly 100 names [source: S&P Dow Jones Indices, Dow Jones U.S. Dividend 100 methodology]. It is a lighter, more modern screen than the 25-year Aristocrat bar, but the spirit is the same: own profitable companies with a durable habit of paying and raising dividends, and accept a lower starting yield to get there.
What you are really buying: a concentrated, quality-and-growth-tilted slice of US dividend payers whose starting yield is often in the low single digits, on the argument — not the guarantee — that the income grows over time.
Broad High Yield: VYM
The counterpart is the Vanguard High Dividend Yield ETF (VYM), which tracks the FTSE High Dividend Yield Index and charges just 0.04% [source: Vanguard, VYM fund page, 2026 — confirm current on Vanguard’s page, as a stated fee is not fixed for life]. Where SCHD is selective, VYM is broad: it ranks US dividend payers by expected yield and holds the higher-yielding half, ending up with a very wide basket of 400-plus companies [source: FTSE Russell, FTSE High Dividend Yield Index methodology; Vanguard VYM holdings — issuer fact sheet ~612 as of 2026-03-31, third-party aggregators ~440; confirm current count, as the holdings change at each index reconstitution]. No single company or sector dominates, so it behaves more like “the higher-yielding part of the whole US market” than a hand-picked club.
VYM’s starting yield tends to sit modestly above SCHD’s and clearly above a total-market fund‘s, and — importantly — every cent of it comes from the ordinary dividends of real companies, with no options overlay involved. The trade versus SCHD is subtle: VYM’s lighter quality screen lets in more mature, slower-growth companies that happen to sport higher yields, so it optimizes for income today rather than income growth.
What you are really buying: broad, low-cost exposure to the higher-yielding half of the US market, with a higher yield today and a lighter tilt toward dividend growth.
The Trade-Off, Made Concrete
The reason this choice matters over long horizons is arithmetic, not opinion. Consider two simplified, illustrative income streams that both start from the same investment:
- A dividend-growth stream that begins at a lower yield but whose annual payout rises each year.
- A high-yield stream that begins higher but whose annual payout stays roughly flat.
Early on, the high-yield stream pays you more. But if the growth stream’s payout keeps rising, there is a crossover — a point where the growing income overtakes the flat income and, from then on, pays more every year. The catch is honest and important: that crossover can take many years, it depends entirely on the raises actually continuing, and if you need the larger income now, the growth story does you no good today. This is why the honest answer depends on your time horizon and your need for current cash, not on which yield number is bigger.
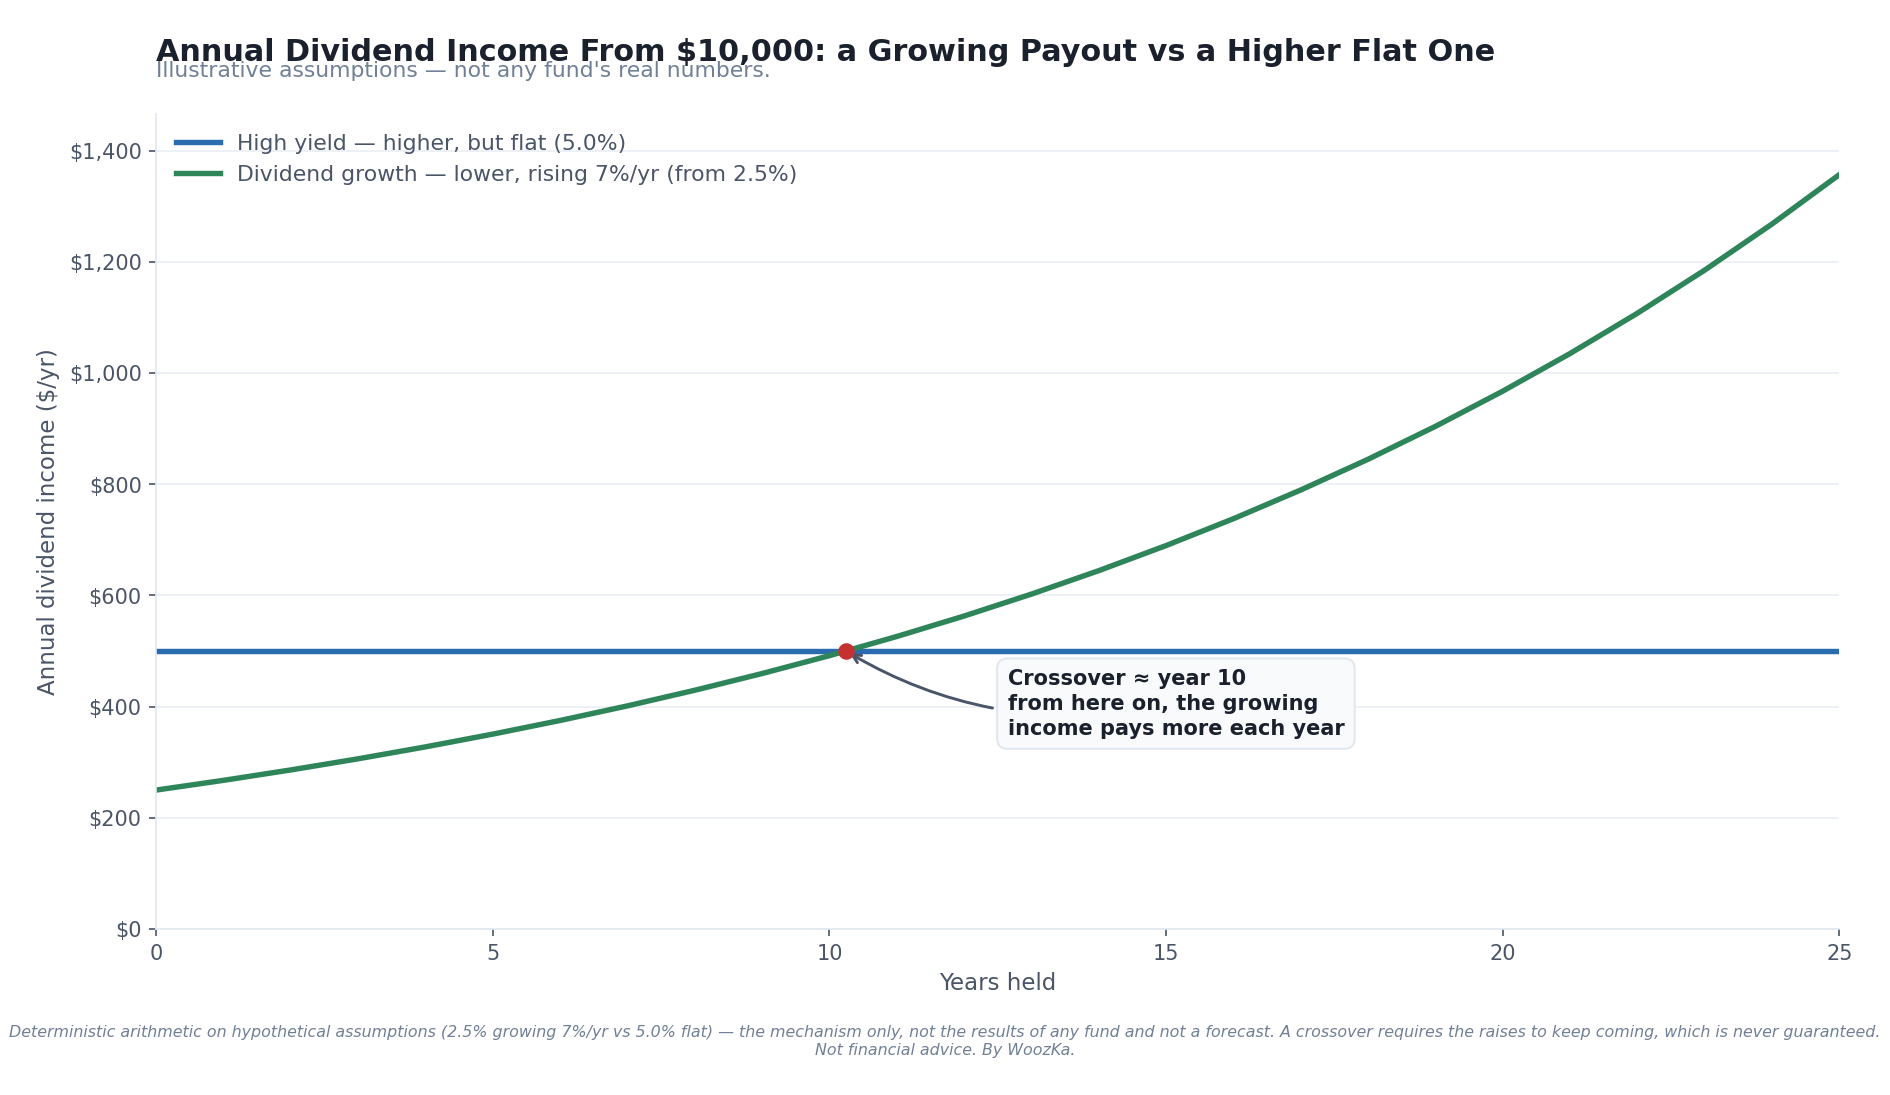
This is the crossover idea in one picture, and it is the crux of the whole comparison: a smaller payout that rises can eventually pass a larger payout that does not. But “eventually” is doing real work — the crossover can be years away, it assumes the raises keep coming, and it is cold comfort if you need the bigger check today. The lines are a simplified illustration of the mechanism, not the record of any real fund.
The Crossover, Put in Years
The section above says this choice “is arithmetic, not opinion,” describes a crossover where the rising payout passes the flat one, and ships a diagram whose own caption promises a labeled crossover year — and then never states one. It is computable. The answer is less comfortable than the picture, and it turns three of the sentences above into numbers. Every figure here was computed in code and checked before publication; the compounding behind them was read off this site’s compound growth calculator rather than worked out by hand.
The model is the article’s own, stripped to its two streams. A growth stream starts at the lower yield and raises its payout by the same percentage every year. A flat stream starts higher and never moves. No price return, no reinvestment, no tax, no fees — all of those are real and all are left out on purpose, so that the one mechanism described above is the only thing on screen. The distance between the two starting yields is written as a multiple: a 1.50× gap means the high-yield side hands you half again the income in year one.
Only Two Numbers Decide It
The first thing the arithmetic gives away is what does not matter. The amount invested cancels out — and so do both yields. What survives is their ratio and the size of the annual raise, and nothing else. A 3% starting yield against 4.5% crosses in exactly the same year as a 0.5% against 0.75%, because both are a 1.50× gap. Checked across five yield levels on the whole grid below, the ratio-only formula deviates in zero of one hundred cases.
| Annual raise | 1.25× gap | 1.50× gap | 1.75× gap | 2.00× gap |
|---|---|---|---|---|
| 3% | Year 9 | Year 15 | Year 20 | Year 25 |
| 5% | Year 6 | Year 10 | Year 13 | Year 16 |
| 7% | Year 5 | Year 7 | Year 10 | Year 12 |
| 9% | Year 4 | Year 6 | Year 8 | Year 10 |
| 11% | Year 4 | Year 5 | Year 7 | Year 8 |
So “many years” is a fair description of the middle of that table and an understatement at the edges. At a modest 1.25× gap with raises of 9%, the growing check is the bigger one by year 4. At a 2.00× gap with raises of 3%, it takes until year 25 — the exact crossing is 23.45 years of raises, which is very nearly the 25-year streak the Dividend Aristocrat screen demands before a company qualifies at all.
Passing Is Not Catching Up
Here is the part the diagram hides, and it is the sharpest result on this page. The crossover year is when the growth stream’s annual check becomes the larger one. It is not the year you are made whole. Every year before it, you collected less, and that shortfall does not disappear when the lines cross — it has to be paid back out of the small surplus that follows. Those are two different dates, and the article names neither.
| Annual raise | Payout crosses | Total crosses | Behind by then |
|---|---|---|---|
| 3% | Year 15 | Year 27 | 3.90 checks |
| 5% | Year 10 | Year 17 | 2.42 checks |
| 7% | Year 7 | Year 13 | 1.85 checks |
| 9% | Year 6 | Year 10 | 1.48 checks |
| 11% | Year 5 | Year 9 | 1.27 checks |
Read the middle row as the base case. At a 1.50× gap and 5% raises the growing payout is larger from year 10 — but by that point the investor has been handed 2.42 years’ worth of the flat check less in total, and does not draw level on cumulative income until year 17. Across all five rates the total-income date lands 1.67 to 1.86 times as far out as the payout date. An investor who reads “the crossover” off a chart and plans around it is planning around roughly half of the wait that actually applies.
What Happens If the Raises Stop
The article says twice that none of this is guaranteed — that a streak can end and “has grown” is history, not a promise. That caution has a price, and it is not evenly distributed. Freeze the payout after a given number of raises, at the same 1.50× gap and 5% raises, and the outcome depends almost entirely on which side of the crossover the freeze lands.
| Raises stop after | Final payout vs flat | Total income crosses |
|---|---|---|
| 5 years | 81.0% | Never |
| 8 years | 93.8% | Never |
| 10 years | 103.4% | Year 58 |
| 12 years | 114.0% | Year 22 |
| 15 years | 132.0% | Year 17 |
A freeze at eight years leaves the payout permanently at 93.8% of the flat check, so the total never catches up at all — the gap widens forever, by a little each year. A freeze at ten years clears the bar, but only by 3.4%, and repaying ten years of shortfall at 3.4% a year takes until year 58. Two extra years of raises move that from year 58 to year 22. And a freeze at fifteen years costs nothing at all: the total-income crossover is year 17 whether the raises stop at fifteen or run forever. The risk in a dividend-growth position is concentrated almost entirely in the first decade, and it is close to binary rather than gradual.
The Honest Objection: the Flat Line Is Not Flat
Everything above uses the article’s simplification that the high-yield payout never rises. Real broad high-yield baskets do raise theirs — more slowly, but they do. Allow for that and only the difference between the two growth rates matters, at an effective rate of (1 + g) ÷ (1 + h) − 1, and the crossover stretches badly. Against 5% raises meeting a high-yield stream growing 3%, the effective rate is 1.942% and the payout crossover moves from 8.31 years to 21.08 — 2.54 times further out. Against 7% meeting 5%, it is 3.59 times further out. This is the single largest source of error in the schematic above, it always runs in the same direction, and it means every year in these tables should be read as a floor rather than an estimate.
Method and limits, so this can be checked rather than taken on trust. Every figure was computed in code with each result verified, and its compounding was cross-checked against the code behind this site’s compound growth calculator, which reproduces every growth factor and cumulative total to seven decimals. The yield gaps and raise rates are an illustrative grid, not the record of any fund — this article publishes no yields, and naming live ones would date the result and duplicate the fee comparison that belongs to the companion piece on SCHD, VYM and JEPI. What is not illustrative is the structure: the amount invested and the yield levels genuinely cancel, so the crossing point depends on the ratio and the raise alone, and that is a property of the arithmetic rather than of the numbers chosen. The model excludes price return, reinvestment, tax, fees and any change in the number of shares held, which is why it is a statement about income streams and not about total return; reinvestment in particular helps the higher starting yield earliest, and is worked through in the companion piece on dividend reinvestment. Payments are treated as annual rather than quarterly, and a raise as one step a year. Nothing here forecasts any fund’s dividend, recommends either approach, or asserts that raises will continue — the last table exists precisely because they may not.
So Which One Fits?
This is a framework, not a recommendation, and your situation may point somewhere neither fund sits.
Start one level up: do you even want a dividend tilt, or a plain total-market index fund? Historically, tilting toward dividends has not been a reliable way to beat a broad index; it shapes how your return arrives (more as cash, less as price appreciation) and what you own (more mature, profitable companies). If your goal is maximum long-run growth and you do not need the cash now, a low-cost total-market or S&P 500 fund is the plainer default, and the growth-versus-yield debate is a preference layered on top of that.
If you do want a dividend tilt, the useful lens is your horizon and your need for current income:
- Long horizon, no need for the cash yet, and you like the idea of an income stream that has historically risen? That is the case for a dividend-growth approach like SCHD’s — you accept a lower yield today for the chance of a larger, growing one later.
- Shorter horizon, or you actually want to spend the income now, and you value breadth and simplicity? That is the case for a broad high-yield approach like VYM’s — a higher check today from a very wide basket.
- Not sure, or you want some of both? Some investors hold both and let the blend land between the two shapes. That is a legitimate choice, not a failure to decide — just know you are averaging the two profiles, not escaping the trade-off.
Whatever you pick, the discipline is the same one from the companion pieces: look past the headline yield to what the payout is made of and how it is likely to behave. A growing dividend and a high flat dividend are two different products wearing the same word.
Once “growth versus yield” is clear, the natural next steps are the mechanics underneath it — Dividend Investing 101 for the vocabulary, two calculations on SCHD, VYM and JEPI for what the fee gap between them is worth and how far a JEPI yield moves with the month it is quoted from, and DRIP: How Dividend Reinvestment Compounds for what happens when you reinvest either kind of payout. The weekly newsletter below is where these threads connect over time.
Disclaimer: This article is educational content, not financial advice. I am not a licensed financial advisor, and nothing here is a recommendation to buy or sell any security or asset. Investing and trading involve risk, including the possible loss of the money you invest. Do your own research and consider consulting a licensed financial professional before making investment decisions. Read the full Disclaimer.
Historical and backtested results are hypothetical, carry inherent limitations, and do not guarantee future results. Figures were accurate to the best of my knowledge as of this article’s last-updated date and may have changed.
