DRIP: How Dividend Reinvestment Compounds — and When It Actually Helps
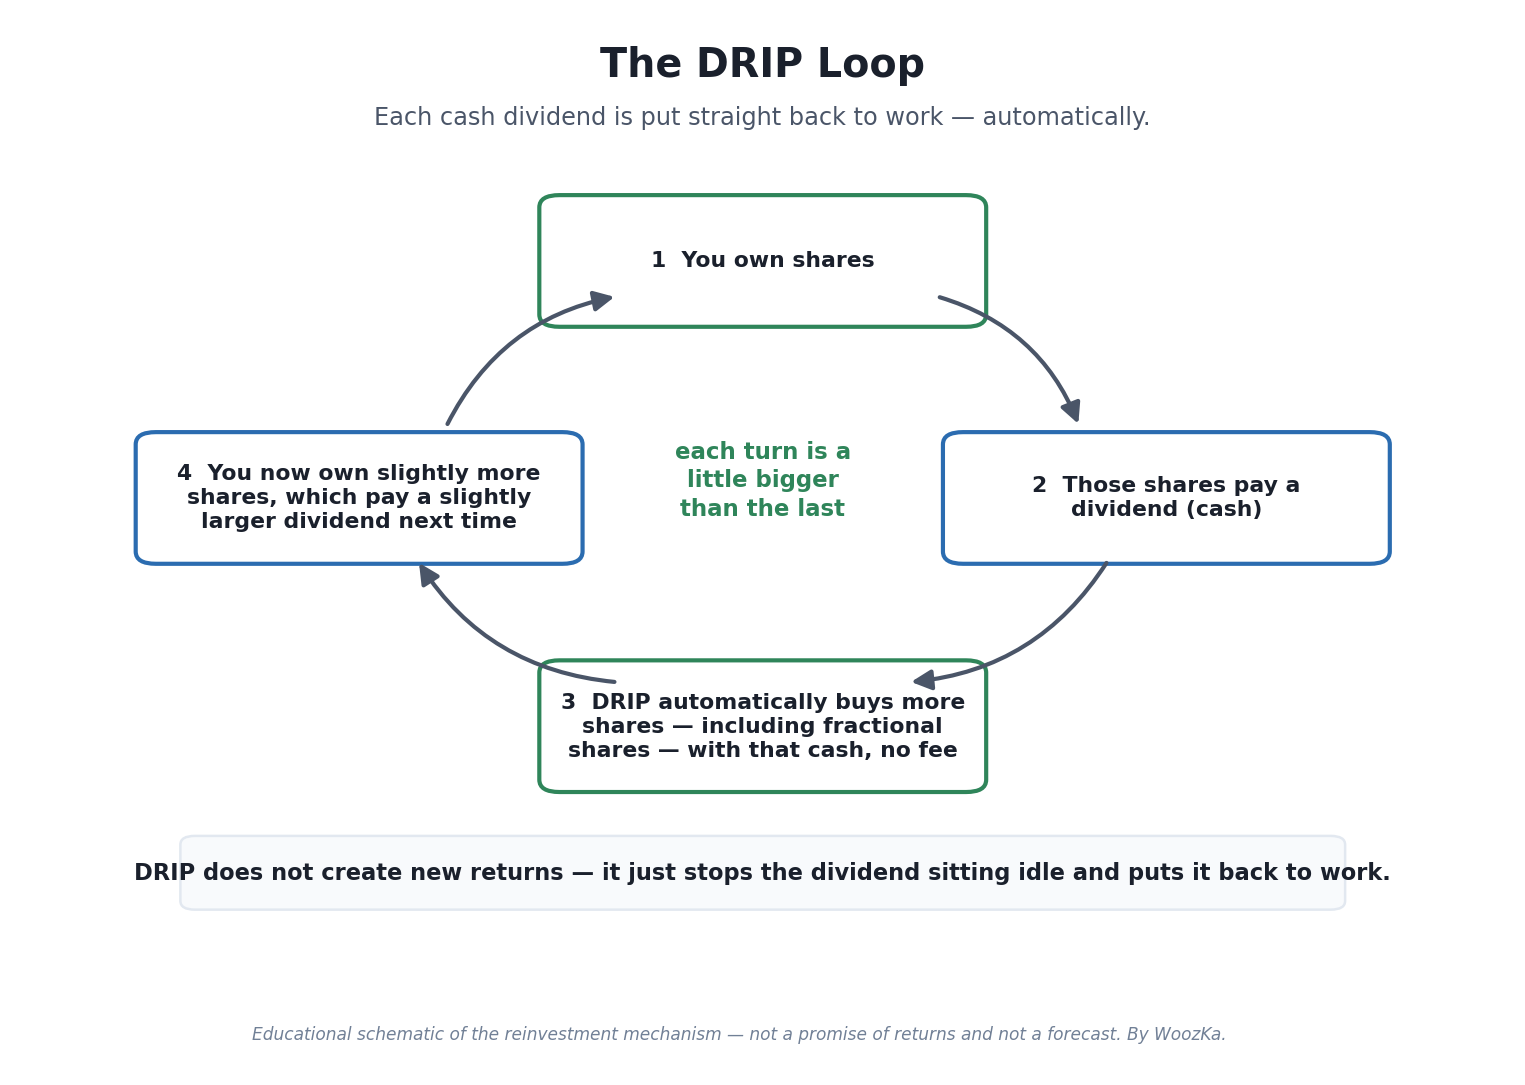
DRIP is one of the simplest ideas in investing and one of the most over-promised. All it does is take the cash a dividend pays you and automatically buy more shares with it, so the payout is not left sitting idle. That creates a small compounding loop — more shares, a slightly larger dividend, more shares again. Useful and quietly powerful over long periods, but not magic, and not free of catches. Illustrative schematic, not advice.
If you own a dividend stock or ETF, sooner or later your broker will ask whether you want to reinvest dividends or take them as cash. That toggle is a DRIP — a Dividend ReInvestment Plan — and it is one of those small settings that does very little this quarter and quite a lot over a decade. This guide explains what DRIP actually does, why the compounding takes time to matter, and the two catches (tax and diversification) worth understanding before you flip the switch.
Naming how a feature works is not telling you to use it; whether DRIP suits you depends on your goals and account type. If dividends themselves are still fuzzy, read Dividend Investing 101 first — this piece assumes you know what a dividend and a yield are. And the mechanism that makes modern DRIP work down to the cent, fractional shares, has its own explainer.
What a DRIP Actually Does
Without DRIP, a dividend lands in your account as cash. It sits there until you decide to do something with it — spend it, or manually buy more of something. Many people let it pile up and forget about it, which quietly turns a stock investment into a part-cash one.
With DRIP switched on, the broker automatically uses that dividend to buy more shares of the same fund or stock, usually commission-free and usually including fractional shares so every cent is put to work rather than rounded down [source: standard brokerage DRIP mechanics; see fractional-shares explainer]. So a $40 dividend does not wait for you to have enough for a whole share — it buys whatever fraction of a share $40 covers, immediately.
That is the whole feature. It does not find better investments, time the market, or add a secret return. It simply removes the friction and the delay between receiving a dividend and reinvesting it. The value is behavioral and mechanical: money that would have drifted as idle cash goes straight back into the position, automatically and on schedule.
Why It Compounds — and Why That Takes Time
Here is the loop, in plain terms. You own shares. They pay a dividend. DRIP buys more shares with it. Now you own slightly more shares, so the next dividend is slightly larger, which buys slightly more shares again. Each turn of the wheel is a little bigger than the last. That is compounding: growth feeding on its own output.
The honest part is the timescale. In year one, the effect is tiny — reinvesting a low-single-digit yield adds a low-single-digit sliver of extra shares, and a sliver of a sliver the next year. Compounding is unremarkable early and only becomes striking after many years, because it depends on many repetitions and, for a dividend-growth holding, on the payout itself rising over time. Anyone showing you a dramatic DRIP chart is showing you the tail of a long process, and usually assuming a steady or rising dividend and a rising share price the whole way — assumptions that do not always hold. Dividends can be cut, and share prices can fall, in which case reinvesting simply buys more of a declining asset.
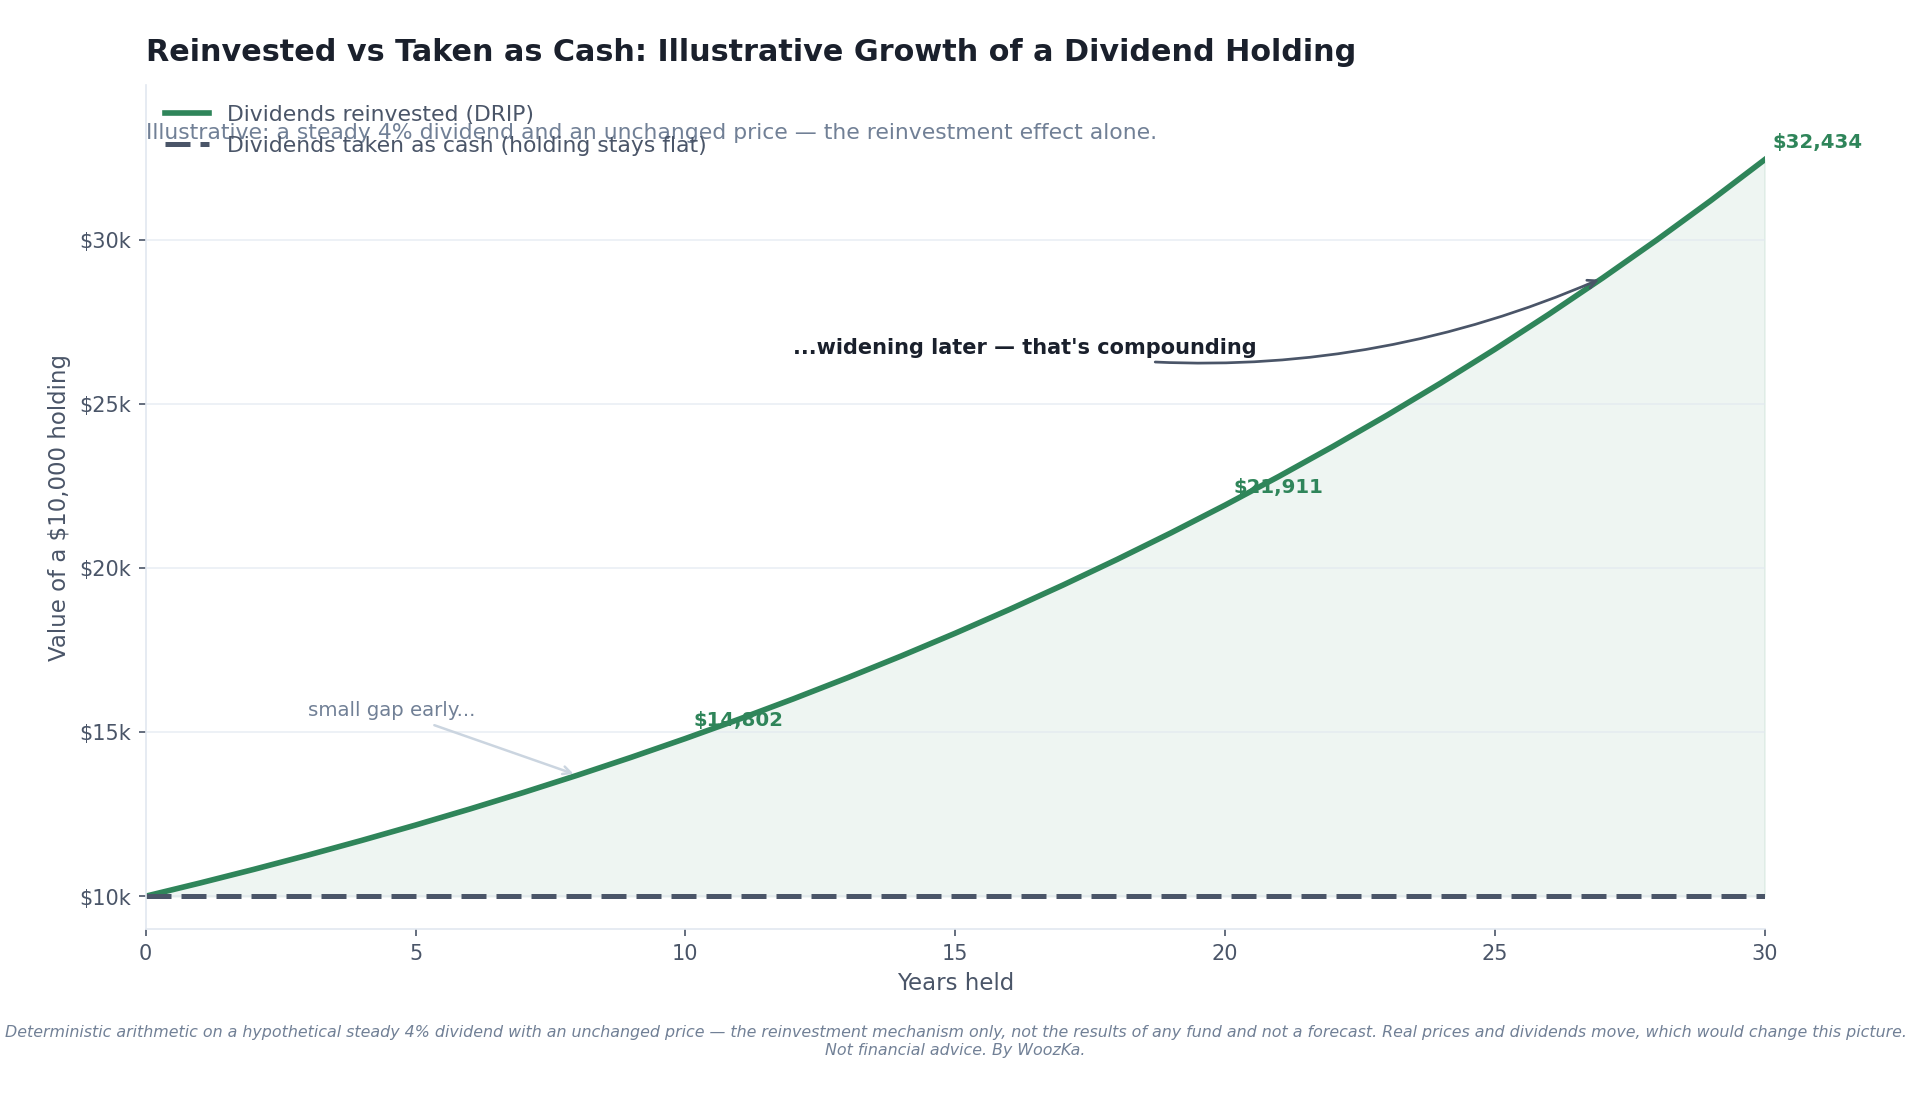
This is the single most useful thing to internalize about DRIP: the payoff is back-loaded. The reinvested line and the cash line sit almost on top of each other for years before the gap becomes obvious, which is exactly why DRIP rewards patience and does very little for a short holding period. The lines are a simplified illustration of the mechanism assuming a steady dividend — real dividends and prices move, so treat the shape as the lesson, not the numbers.
Two Catches Worth Knowing First
DRIP is simple, but “switch it on and forget it” skips two things that matter.
Tax (in a taxable account). In a regular taxable brokerage account, a reinvested dividend is generally still taxable in the year it is paid, even though you never saw the cash — you owe tax on a dividend you immediately turned back into shares [source: general dividend-taxation principle; consult your jurisdiction’s rules]. This is not individualized tax advice, and it varies by country and account type: in many tax-sheltered accounts the issue does not arise. Reinvesting also creates lots of small purchase lots at different prices, which is worth knowing for record-keeping. The point is simply that “I didn’t take the cash” does not mean “no tax event.”
Diversification drift. DRIP always buys more of the thing that paid — the same stock or fund. Over years, faithfully reinvesting into a single holding quietly concentrates your portfolio in it. For a broad, diversified ETF that is usually fine and even desirable. For an individual stock, automatic reinvestment can leave you far more exposed to one company than you intended, without ever making a conscious decision to bet bigger on it. Some investors deliberately take dividends as cash and reinvest them where they choose — into whatever is underweight — precisely to keep control of the mix.
The Shape, With the Numbers Put Back In
The section above says to treat the shape as the lesson rather than the numbers, and that is right about any particular chart — real dividends and prices move. But the shape itself is not vague. The reinvestment loop has an exact equation, it is short, and it answers the two questions the section leaves open: how much the toggle is actually adding, and how long “takes time” means. Every share-count figure below was produced by the site’s own Compound Growth Calculator and reproduced independently in separate code.
The Toggle Does Exactly One Thing, and the Share Price Cancels Out of It
A dividend of y per share buys y divided by the price in new shares — and the price appears on both sides. So the share count multiplies by exactly (1 + y) each period whatever the price did in between. Running the loop over a flat price, a compounding one, a steadily falling one and a sawtooth that alternates between +50% and −40% gives share counts identical to ten decimal places. That is worth stating plainly next to the section’s warning that reinvesting can buy more of a declining asset: it does, and you still finish with the same number of shares. What the decline changes is what they are worth, never how many you own.
| Yield | 10 years | 20 years | 30 years | 40 years |
|---|---|---|---|---|
| 1.5% | 1.1605× | 1.3469× | 1.5631× | 1.8140× |
| 2.0% | 1.2190× | 1.4859× | 1.8114× | 2.2080× |
| 3.0% | 1.3439× | 1.8061× | 2.4273× | 3.2620× |
| 4.0% | 1.4802× | 2.1911× | 3.2434× | 4.8010× |
The section’s “a sliver of a sliver” is exact rather than figurative. Year one adds y extra shares per share held. The part of year two that is genuinely compounding — the dividend paid on the shares year one bought — is exactly y squared. On a 2% yield that is 0.04%, one-fiftieth of what the first year added; on any yield it is a fraction 1/y of it. The loop is not slow because it is weak. It is slow because it is quadratic at the start.
How Long “Takes Time” Actually Is
Set the toggle against an investor who takes the same dividends and spends them. The reinvestment loop alone multiplies the position by (1 + y)ⁿ, so the question “when does the gap become obvious” has a closed-form answer that needs no assumption about the share price at all.
| Yield | +10% | +25% | +50% | Twice the shares |
|---|---|---|---|---|
| 1.5% | 6.40 yr | 14.99 yr | 27.23 yr | 46.56 yr |
| 2.0% | 4.81 yr | 11.27 yr | 20.48 yr | 35.00 yr |
| 3.0% | 3.22 yr | 7.55 yr | 13.72 yr | 23.45 yr |
| 4.0% | 2.43 yr | 5.69 yr | 10.34 yr | 17.67 yr |
On a 2% yield — roughly what a broad index fund pays — the toggle needs 4.81 years to put you 10% ahead and 35.00 years to double the share count. That is the section’s “does very little for a short holding period” with the holding period named, and it is a good deal longer than most people picture when they flip the switch.
One structural point sits in the table and is easy to miss: the four columns keep the same proportions at every yield. Doubling the share count always takes 7.2725 times as long as reaching +10%, whether the yield is 1.5% or 4%, because the yield cancels out of the ratio. A higher yield compresses the whole timeline uniformly; it does not change the shape of it. The shape really is the lesson — it just happens to be a measurable one.
The Tax Catch, Priced
The catch above says you owe tax on a dividend you never saw as cash. If that bill is funded out of the dividend itself, the loop stops compounding at y and starts compounding at (1 − t)y — the toggle is unchanged, the rate it runs at is not. Rates vary by country, account and dividend type, so the rate below is swept across a plausible span rather than asserted, on a 3% yield over twenty years.
| Tax rate | Effective yield | Shares at 20 yr | vs. untaxed | Years lost |
|---|---|---|---|---|
| 0% | 3.000% | 1.8061× | — | — |
| 15% | 2.550% | 1.6547× | −8.38% | +3.48 |
| 20% | 2.400% | 1.6069× | −11.03% | +4.93 |
| 37% | 1.890% | 1.4542× | −19.48% | +11.57 |
At the top of that span a 3% yield reinvests like a 1.89% one, and reaching the share count an untaxed account hits in twenty years takes 11.57 extra years. Three things are worth separating here:
- The drag is on the rate of the loop, not on a one-off slice of it, so it compounds along with everything else — which is why the years-lost column grows faster than the tax rate does.
- This is arithmetic on a swept rate, not tax advice and not a claim about anyone’s actual bill. Which rate applies, and whether it applies at all, is what the account type decides.
- It changes nothing about whether the toggle is worth using. Not reinvesting does not avoid the tax; the dividend is taxable either way. It only changes what the reinvested portion grows at.
Method and limits, so this can be checked rather than taken on trust. Every share-count figure was read from the site’s shipped Compound Growth Calculator and independently reproduced in code that checks each result before reporting it; the price-path independence is verified by simulation against four different price paths rather than argued. The model is deliberately spare: a constant yield, dividends reinvested in full at the prevailing price, and no costs. Real yields move, dividends get cut, and a yield that stays constant while the price falls is a payout being maintained on a shrinking business — the section above is right that this is where reinvestment buys more of a declining asset, and nothing here contradicts it. Doubling the share count is not doubling your money: these tables isolate what the toggle contributes and say nothing about what the underlying holding does, which is the far larger term and the one no equation supplies. The tax rate is swept rather than asserted because rates depend on jurisdiction, account type and dividend classification, all of which sit outside this article. Concentration drift is left alone deliberately — the arithmetic of a position quietly growing into a portfolio is worked through on this site in the context of position sizing, and repeating it here would add nothing. Nothing above is a forecast, no yield, holding or account type is recommended, and no figure here is tax advice.
So Should You Use It?
This is a framework, not a recommendation. DRIP tends to suit an investor who is accumulating for the long run, wants automation, and holds broad, diversified funds — the combination where compounding has time to work and concentration is not a worry. It suits less well someone who needs the income to spend now (that is the whole point of taking dividends as cash), someone who wants to actively steer where new money goes, or someone holding a concentrated single stock who does not want to keep adding to it automatically.
The mechanism is genuinely elegant and, over long horizons, quietly effective — but it is a tool, not a strategy, and it does not turn a poor holding into a good one. The prior decision, what you are reinvesting into, matters far more than the toggle itself. Once you have chosen a holding you are comfortable owning more of, DRIP is a low-effort way to keep the dividend working instead of drifting.
For the decisions that sit around this one, see Dividend Investing 101 for the vocabulary, Dividend Growth vs High Yield for what kind of payout you are reinvesting, and What Are Fractional Shares for the mechanism that lets DRIP put every cent to work. The weekly newsletter below ties these together over time.
Disclaimer: This article is educational content, not financial advice. I am not a licensed financial advisor, and nothing here is a recommendation to buy or sell any security or asset. Investing and trading involve risk, including the possible loss of the money you invest. Do your own research and consider consulting a licensed financial professional before making investment decisions. Read the full Disclaimer.
Historical and backtested results are hypothetical, carry inherent limitations, and do not guarantee future results. Figures were accurate to the best of my knowledge as of this article’s last-updated date and may have changed.
