Recession Indicators: Which Ones Actually Predict Downturns?
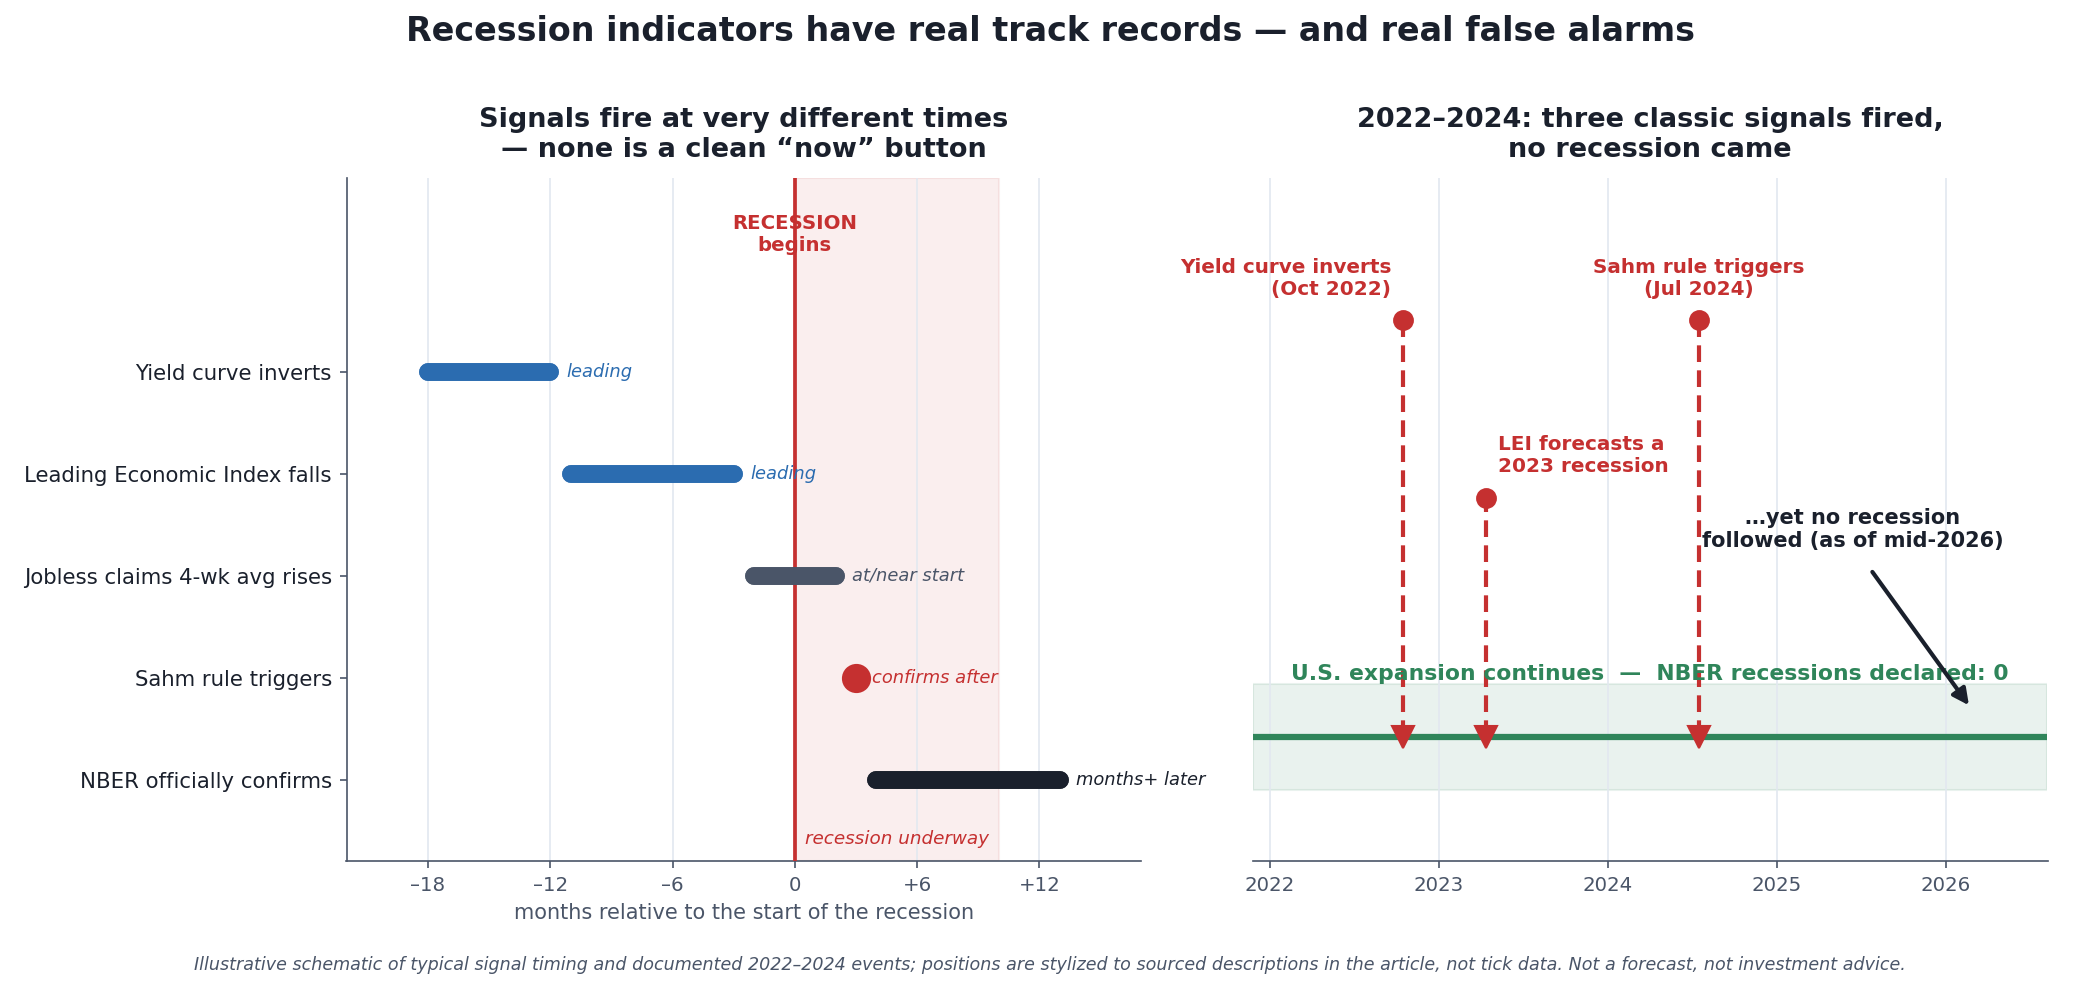 The signals fire at very different times — and in 2022–2024, three of the most-watched ones fired without a recession following. Illustrative of historical timing and documented events; not a forecast. Sources cited in text.
Before anything else: nothing in this article can tell you whether a recession is coming, when it would start, or what to do with your money if one does. Recession indicators are tools for understanding the economy, not a dashboard you can trade off of — and as you’ll see, even the best of them have been early, late, and flat-out wrong. This is a piece about what these signals have and haven’t done historically, so you can read the news with a clearer head, not a piece about timing the market.
Still, “which indicators actually predict recessions?” is a fair and useful question, because some genuinely have a better track record than others. This is a research companion to The Economic Machine Explained — the pillar that lays out how credit, debt, and cycles fit together as one system. Here we zoom in on the practical question of measurement: given that downturns are a normal part of that system, how well can anyone see one coming?
The honest one-line answer: a few indicators have real predictive value, the yield curve most of all, but “predict” oversells every one of them. They come with false alarms, they disagree with each other, and they can’t tell you in real time where you actually are. The most recent proof is the most striking — in 2022 through 2024, several of the most respected signals fired at once, and no recession followed.
First, What Even Counts as a Recession?
You can’t judge an indicator’s accuracy without agreeing on what it’s supposed to be predicting, and this is messier than most people think.
In the United States, the official arbiter is the National Bureau of Economic Research (NBER), a private nonprofit whose Business Cycle Dating Committee defines a recession as “a significant decline in economic activity that is spread across the economy and that lasts more than a few months” [source: NBER, Business Cycle Dating]. Notice what that definition is built on: depth, breadth, and duration — not a single tidy number. The popular shorthand that “two consecutive quarters of falling GDP equals a recession” is a rule of thumb the NBER explicitly does not use [source: NBER Business Cycle Dating FAQ].
That distinction isn’t academic hair-splitting. In the first half of 2022, U.S. real GDP fell in both Q1 (about −1.6% annualized) and Q2 (about −0.9% annualized) — two negative quarters, the popular “recession” trigger — yet the NBER never declared a recession, because employment, income, and production kept rising the whole time; later data revisions confirmed there was no recession [source: Federal Reserve Bank of Dallas, “U.S. likely didn’t slip into recession in early 2022,” August 2022]. The definition you use changes the answer.
The other thing to understand about the official call is that it arrives late by design. The committee waits until it’s confident, to avoid having to reverse itself. It announced the December 2007 business-cycle peak on December 1, 2008 — roughly a year after the recession had actually begun — and even its fastest call ever, the February 2020 peak, came about four months after the fact [source: NBER Business Cycle Dating Committee announcements, December 1, 2008 and June 8, 2020]. So the “official” recession indicator is useless for anyone trying to act ahead of time. Every indicator below exists precisely because the definitive answer comes too late to be actionable.
The Yield Curve: The Best Track Record — and Its Limits
If one indicator has earned its reputation, it’s the shape of the Treasury yield curve — specifically the gap between long-term and short-term government interest rates.
Normally longer-term Treasuries pay more than shorter-term ones, because lending money for longer carries more uncertainty. When that flips — when short-term rates rise above long-term rates — the curve is “inverted,” and historically that inversion has been an unusually reliable warning sign. Measured as the 10-year yield minus the 3-month yield, the version the Federal Reserve Bank of New York uses in its published recession-probability model, an inversion has preceded essentially every U.S. recession going back to the 1950s–1960s, with only one widely cited false alarm in the mid-1960s [source: Federal Reserve Bank of New York recession-probability model, building on Estrella & Mishkin; Congressional Research Service, “Does a Yield Curve Inversion Predict a Recession?,” 2019]. Few economic indicators can claim that.
But three limits matter enormously. First, the lead time is long and variable: the gap between an inversion and the recession it precedes has typically run somewhere in the range of about 12 to 24 months, and has varied well outside that range [source: Congressional Research Service, “The Yield Curve and Predicting Recessions,” April 11, 2019, which describes the lag as considerable and variable without putting a number on it; Federal Reserve Bank of St. Louis, “Who Wants to Bet against the Yield Curve: Is This Time Different?,” September 30, 2019, for the two-year outer bound; Federal Reserve Bank of New York, “The Yield Curve as a Leading Indicator: Frequently Asked Questions,” for the twelve-month model horizon]. An inversion is not a “sell” bell; it’s a slow-burning warning that might take a year and a half to mean anything, or might not. Second, “predicts recessions” is not the same as “predicts markets” — stocks have at times risen for a long stretch after an inversion. Third, and most humbling, it just missed. The yield curve inverted in October 2022, one of the deepest and longest inversions in decades — and as of mid-2026, more than two and a half years later, no NBER recession had followed [source: CNBC, “The Federal Reserve’s favorite recession indicator is flashing danger again,” February 2025; NBER, no recession declared since April 2020]. The single best recession indicator we have gave a very public false signal in this cycle.
The Sahm Rule: A Real-Time Confirmer, Not a Crystal Ball
A very different kind of indicator is the Sahm rule, named for economist Claudia Sahm. It watches the unemployment rate for a specific pattern: it triggers when the three-month moving average of the national unemployment rate rises at least 0.50 percentage points above its lowest point over the previous 12 months [source: Federal Reserve Bank of St. Louis, FRED, “Real-time Sahm Rule Recession Indicator”; Britannica Money].
Its historical hit rate is excellent — in every U.S. recession since 1950 the Sahm rule triggered, with only one false positive (in 1959) [source: Britannica Money; Current Market Valuation, “Sahm Rule Recession Indicator”]. But here’s the catch that the yield curve doesn’t share: the Sahm rule is a coincident signal, not a leading one. On average it has fired about three months after a recession has already started [source: Current Market Valuation, “Sahm Rule Recession Indicator”]. It’s superb at confirming that a downturn is underway; it is not designed to warn you in advance. Using it to “get ahead” of a recession is using the wrong tool for the job.
And it, too, has just been tested in public. The Sahm rule triggered in July 2024, when the three-month unemployment average came in about 0.53 points above its prior-year low after a weak jobs report [source: Fortune, “Recession indicator: Sahm Rule flashes red,” August 2, 2024]. Notably, Claudia Sahm herself cautioned that “this time really could be different” and said she did not believe the economy was in a recession, pointing to still-growing incomes and resilient spending — a rare and instructive case of an indicator’s own creator telling people not to over-read it [source: Fortune, August 2, 2024]. As of mid-2026, she was right to be cautious: no recession has been dated for that period.
The Leading Economic Index, and the Rest of the Dashboard
The Conference Board’s Leading Economic Index (LEI) bundles ten forward-looking components — including new orders, building permits, stock prices, credit conditions, and the yield-curve spread — into a single composite meant to turn down before the broader economy does. In principle a sustained, broad LEI decline is a recession warning.
In practice, it produced the clearest false alarm of this cycle. By late 2022 the Conference Board was forecasting a recession beginning around the end of 2022 or early 2023; through 2023 the index fell for the longest stretch of consecutive monthly declines since the run-up to the 2007–08 crisis, and the Board projected a recession from roughly Q3 2023 into Q1 2024 [source: The Conference Board, U.S. Leading Economic Index press releases, 2022–2023]. No such recession arrived. The Conference Board itself notes that the LEI can give false signals, typically during major growth slowdowns that stop short of a full recession [source: The Conference Board]. That is apparently exactly what 2023 was.
A handful of other gauges each capture one slice of the picture:
- Initial jobless claims are the most timely labor-market reading — reported weekly with only a one-week lag — and the four-week average tends to turn up at or just before a recession begins, making them a useful short-lead and coincident signal rather than a long-range forecast [source: Federal Reserve Bank of Kansas City, “Revisiting Initial Jobless Claims as a Labor Market Indicator,” 2013].
- Credit spreads — the extra yield investors demand to hold riskier corporate bonds over Treasuries — widen when markets start pricing in higher default risk, and Federal Reserve research on the “excess bond premium” has found information in spreads about future economic activity [source: Federal Reserve Board, FEDS Notes, “Recession Risk and the Excess Bond Premium,” April 2016].
- The ISM Manufacturing PMI reads above 50 in expansion and below 50 in contraction, but comes with a big caveat: manufacturing is a shrinking slice of the U.S. economy, so the PMI can sit in “contraction” for months — as it did across much of 2022–2024 — signaling a manufacturing slump without an economy-wide recession [source: Institute for Supply Management, ISM Manufacturing PMI reports].
Each of these is genuinely watched by professionals. None is a stand-alone predictor, and each can — and regularly does — disagree with the others.
2022–2024: When the Whole Dashboard Cried Wolf
It’s worth putting the last few years together, because they are the single most useful case study in why “recession indicator” should never be read as “recession guarantee.”
Within about a two-year window, three of the most respected signals on the board all flashed red. The yield curve inverted in October 2022. The Leading Economic Index fell for its longest streak since the last financial crisis and its publisher forecast a 2023 recession. And the Sahm rule — which had never given a false positive except once in 1959 — triggered in July 2024. Any one of those would have made headlines; all three did.
And the NBER declared no recession. As of mid-2026 the U.S. expansion that began in April 2020 was still officially intact, an outcome economists came to describe as a “soft landing”: inflation cooled substantially while employment, incomes, and output kept growing rather than collapsing [source: NBER, no recession declared since April 2020; Federal Reserve Bank of Dallas and NBER data on continued employment and income growth]. Whatever combination of a resilient labor market, healthy household and corporate balance sheets, and post-pandemic quirks produced that result, the lesson for an ordinary investor is blunt: the best available warning system, running at full volume, still can produce a false alarm that lasts for years.
This is not a knock on the indicators. The yield curve’s long record is real; the Sahm rule’s is real; the LEI captures something genuine. It’s a knock on the fantasy of the indicators — the idea that if you just watch the right chart, you’ll know when to get out. If that were possible, 2022–2024 is exactly the moment it would have worked, and it didn’t.
The Dashboard, Counted
This article assembles a case study and then leaves three of its own numbers unmultiplied: how many false positives the indicators have actually accumulated once the last cycle is included, how narrowly the 2024 trigger cleared its threshold, and how far apart these signals fire even when they agree. All three are arithmetic on figures already stated above, and all three make the article’s closing point — that indicators are context rather than commands — sharper than the prose alone does.
False Positives, Recounted
Each indicator’s record is given early, and then a later section describes another miss without going back to revise the tally.
| Indicator | Stated record | Recounted |
|---|---|---|
| Yield curve | 1 (mid-1960s) | 2 |
| Sahm rule | 1 (1959) | 2 |
| Leading Economic Index | “can give false signals” | at least 1 |
The Sahm rule is introduced as having “never given a false positive except once in 1959” — and the same article then reports it triggering in July 2024 with no recession dated as of mid-2026. On the article’s own account that is two, not one. The yield curve is the same story: one false alarm in the mid-1960s, plus the October 2022 inversion the article itself calls a very public false signal. The figures are not wrong so much as un-updated — each is stated in an early section and superseded by a later one. Read together, the two indicators this article rates most highly both doubled their historical false-positive counts in a single cycle. That is the “cried wolf” observation with a number attached, and it is a stronger statement than the adjective.
How Narrowly July 2024 Cleared the Bar
The Sahm rule is a hard threshold, which makes the distance from the line worth knowing.
| Quantity | Reading |
|---|---|
| Sahm threshold | 0.50 points |
| July 2024 reading | 0.53 points |
| Margin above threshold | 0.03 points |
| One step of a 3-month average | 0.0333 points |
The trigger cleared its threshold by 0.03 points — a 6.00% overshoot, and smaller than a single step of the series it is computed from. The unemployment rate is published to one decimal place, so a three-month average of it moves in increments of about 0.0333: the signal that made headlines fired by less than one tick of its own input. That is not a criticism of the rule, which is doing exactly what a threshold does; it is what every hard cutoff does near the line, and it is the arithmetic behind both this article’s caution and the unusual spectacle of the indicator’s own creator publicly telling people not to over-read it.
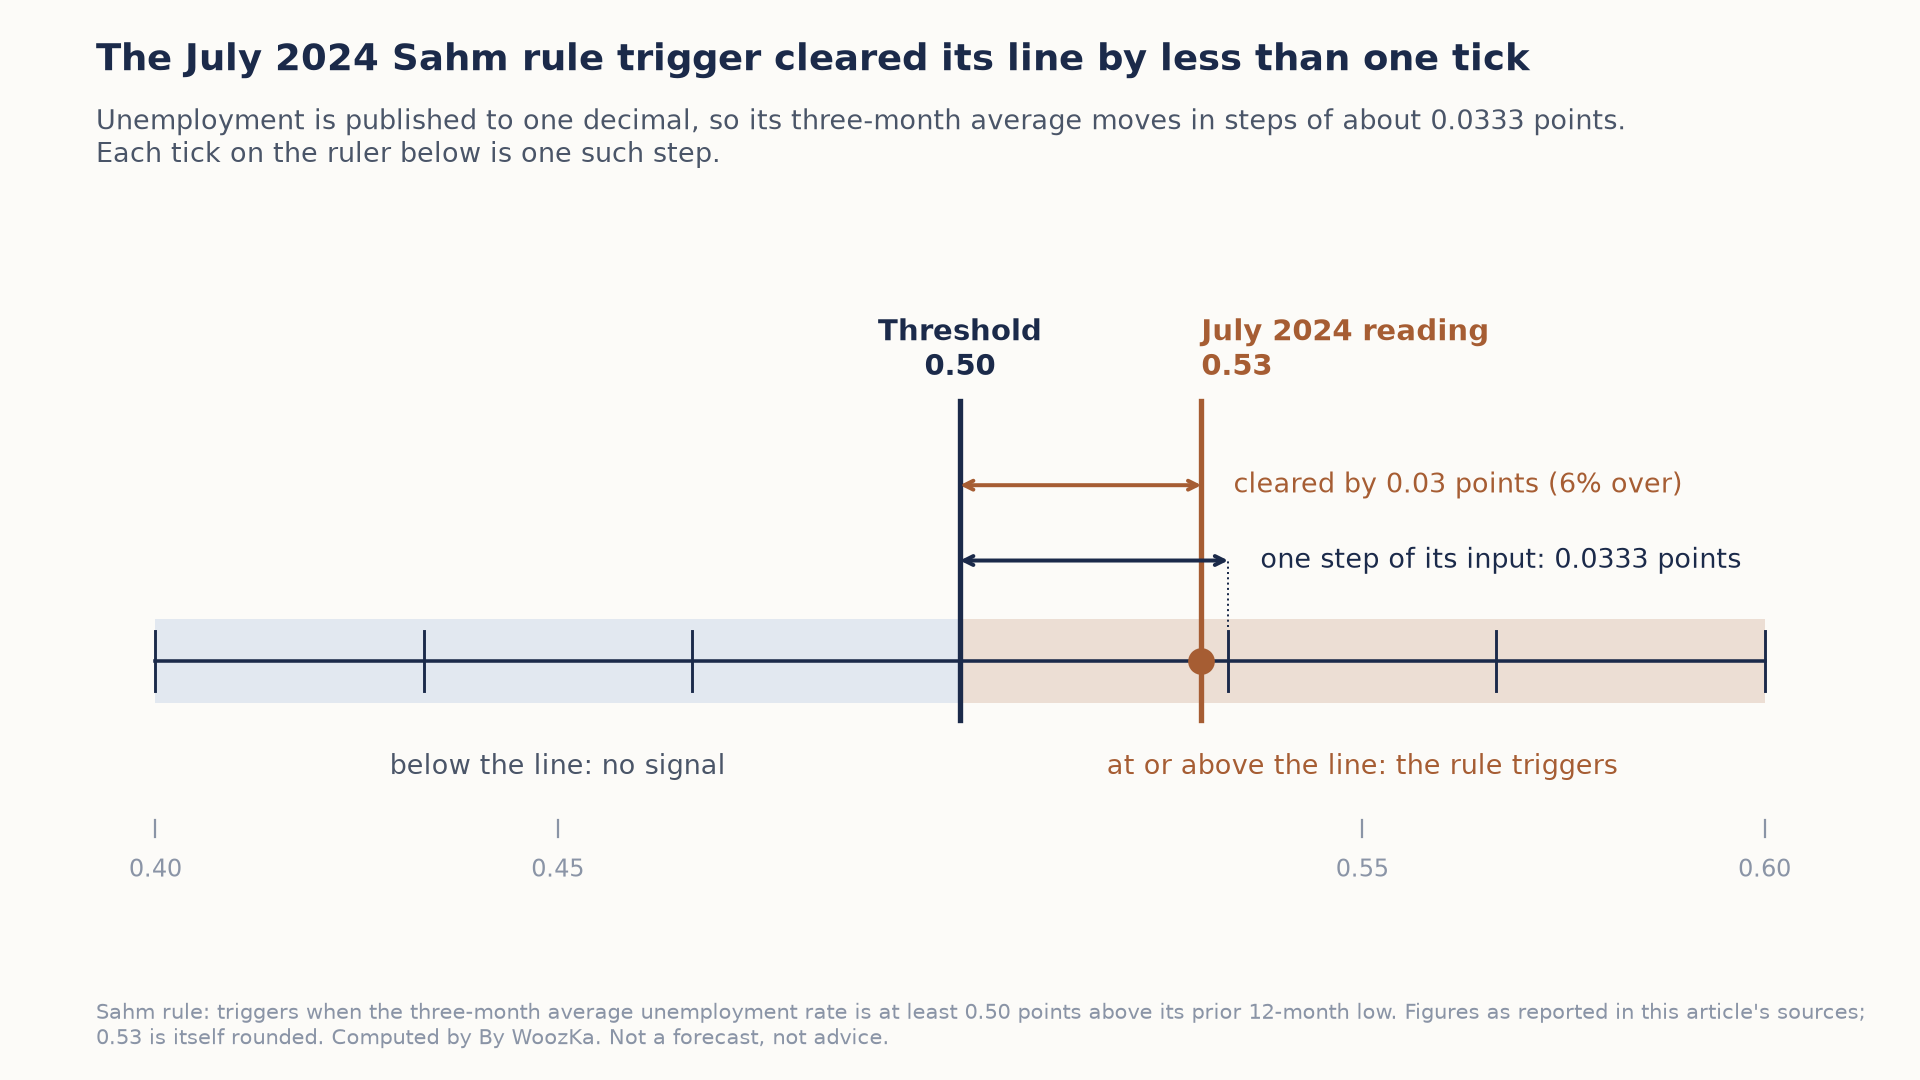 The reading sits just short of the next tick on the ruler. The signal that made headlines cleared its line by less than the smallest move its own input can make, which is what any hard cutoff looks like up close.
Two Clocks Built to Disagree
The article rates the yield curve and the Sahm rule most highly and describes their timing in different sections. Put on one axis, the timing is not a detail — it is a structural limit on using them together.
| Timing | Length |
|---|---|
| Yield curve fires before | 12–24 months |
| Sahm rule fires after | 3 months |
| Gap between the two | 15–27 months |
| Elapsed since Oct 2022 | 45 months |
Even when both indicators are right about the same recession, they fire 15 to 27 months apart. So the Sahm rule cannot confirm a yield-curve warning inside the curve’s own lead window: by the time it fires, the recession has already started. Watching both is not corroboration — it is two clocks built to disagree, one early and one late, and treating agreement between them as a stronger signal misunderstands what each measures.
The elapsed time makes the other half of the point. 45 months separate the October 2022 inversion from mid-2026 — 1.88× the top of the 12-to-24-month lead range this article publishes, and 3.75× the bottom. The article describes it as “more than two and a half years later,” which is true and conservative; measured against its own stated range, the signal is well past the window in which it would have been vindicated. None of which says what happens next — only that this particular warning has now outlived the horizon on which it is usually judged.
Confidence and sourcing for the indicator figures above. Every input above is a figure this article already publishes and sources — the 0.50 threshold and the July 2024 reading of 0.53, the three-month lag, the 12-to-24-month lead range, the October 2022 inversion, the mid-2026 as-of date, and the stated false-positive counts — and the code behind the tables confirms each of them before it reports anything. The recount adds nothing external: it simply carries forward events described later in the same article. The 0.0333 step follows from the unemployment rate being published to one decimal and averaged over three months; 0.53 is itself a rounded figure, so the true margin is approximately one step rather than exactly it. Elapsed time is measured from October 2022 to July 2026 in whole months. Nothing above forecasts or dates a recession, projects any indicator, or recommends any action; every figure describes something already measured. Base rates — how many recessions occurred in these periods — would require a count this article does not publish and are deliberately not attempted, and the yield curve’s own mechanism and spread arithmetic belong to the yield-curve article rather than here.
What This Means for You — and What It Doesn’t
So how should a long-term investor actually use any of this? Mostly, as context rather than as commands.
Understanding these indicators helps you interpret the news like an adult instead of a headline — you’ll know that an inverted yield curve is a real-but-slow warning rather than a reason to panic-sell today, that the Sahm rule confirms more than it predicts, and that “the LEI says recession” has been wrong recently. That understanding is worth having. What it is not is a license to rebuild your portfolio around a signal. Every indicator here comes with false positives, variable lead times, and disagreement, and the official confirmation only ever arrives after the fact.
The durable response to recession risk isn’t prediction; it’s a plan that survives a recession whenever it comes, without your needing to see it coming. That’s the entire logic behind the boring fundamentals this blog keeps returning to: an emergency fund so a downturn doesn’t force you to sell, broad diversification so no single shock is fatal, and a steady, automatic investing habit — dollar-cost averaging — that keeps working through good times and bad. The companion piece on whether to invest more in a bear market makes the same point from the other side: the winning move in a downturn is behavioral discipline, not clever timing.
None of that requires you to forecast the next recession. That’s the point. A plan you have to predict the future to execute is a plan that will eventually fail, because — as the last few years just demonstrated in public — not even the professionals with the best indicators can reliably do it.
The Honest Bottom Line
Do recession indicators work? Some genuinely have predictive value — the 10-year-minus-3-month yield curve above all, with the Sahm rule and jobless claims strong at confirming a downturn once it’s begun, and the LEI and credit spreads adding useful color. But “work” is not “predict on a schedule you can act on.” Every one of them carries false alarms, wildly variable timing, or both, and the official all-clear or all-alarm from the NBER always comes months to more than a year late.
The proof is recent and hard to argue with: in 2022–2024 the yield curve inverted, the Leading Economic Index forecast a recession, and the Sahm rule triggered — and no recession came. Treat these signals as a way to understand the weather, not as a way to time it. The investors who come through downturns best are not the ones who saw them coming; they’re the ones whose plan didn’t depend on it.
Sorted by when they move: the Economic Cycles Explorer groups these indicators into leading, coincident and lagging, and sets them beside a table of every U.S. recession since 1929 — dates, duration, peak unemployment.
Disclaimer: This article is educational content, not financial advice. I am not a licensed financial advisor, and nothing here is a recommendation to buy or sell any security or asset. Investing and trading involve risk, including the possible loss of the money you invest. Do your own research and consider consulting a licensed financial professional before making investment decisions. Read the full Disclaimer. Historical and backtested results are hypothetical, carry inherent limitations, and do not guarantee future results. Figures were accurate to the best of my knowledge as of this article’s last-updated date and may have changed.
Want a plain-English weekly read on how the economic-cycle signals are actually showing up in the news — explained, never predicted? That’s exactly what the newsletter is for. Subscribe below.
