Moving Averages Explained: SMA vs EMA and When to Use Each
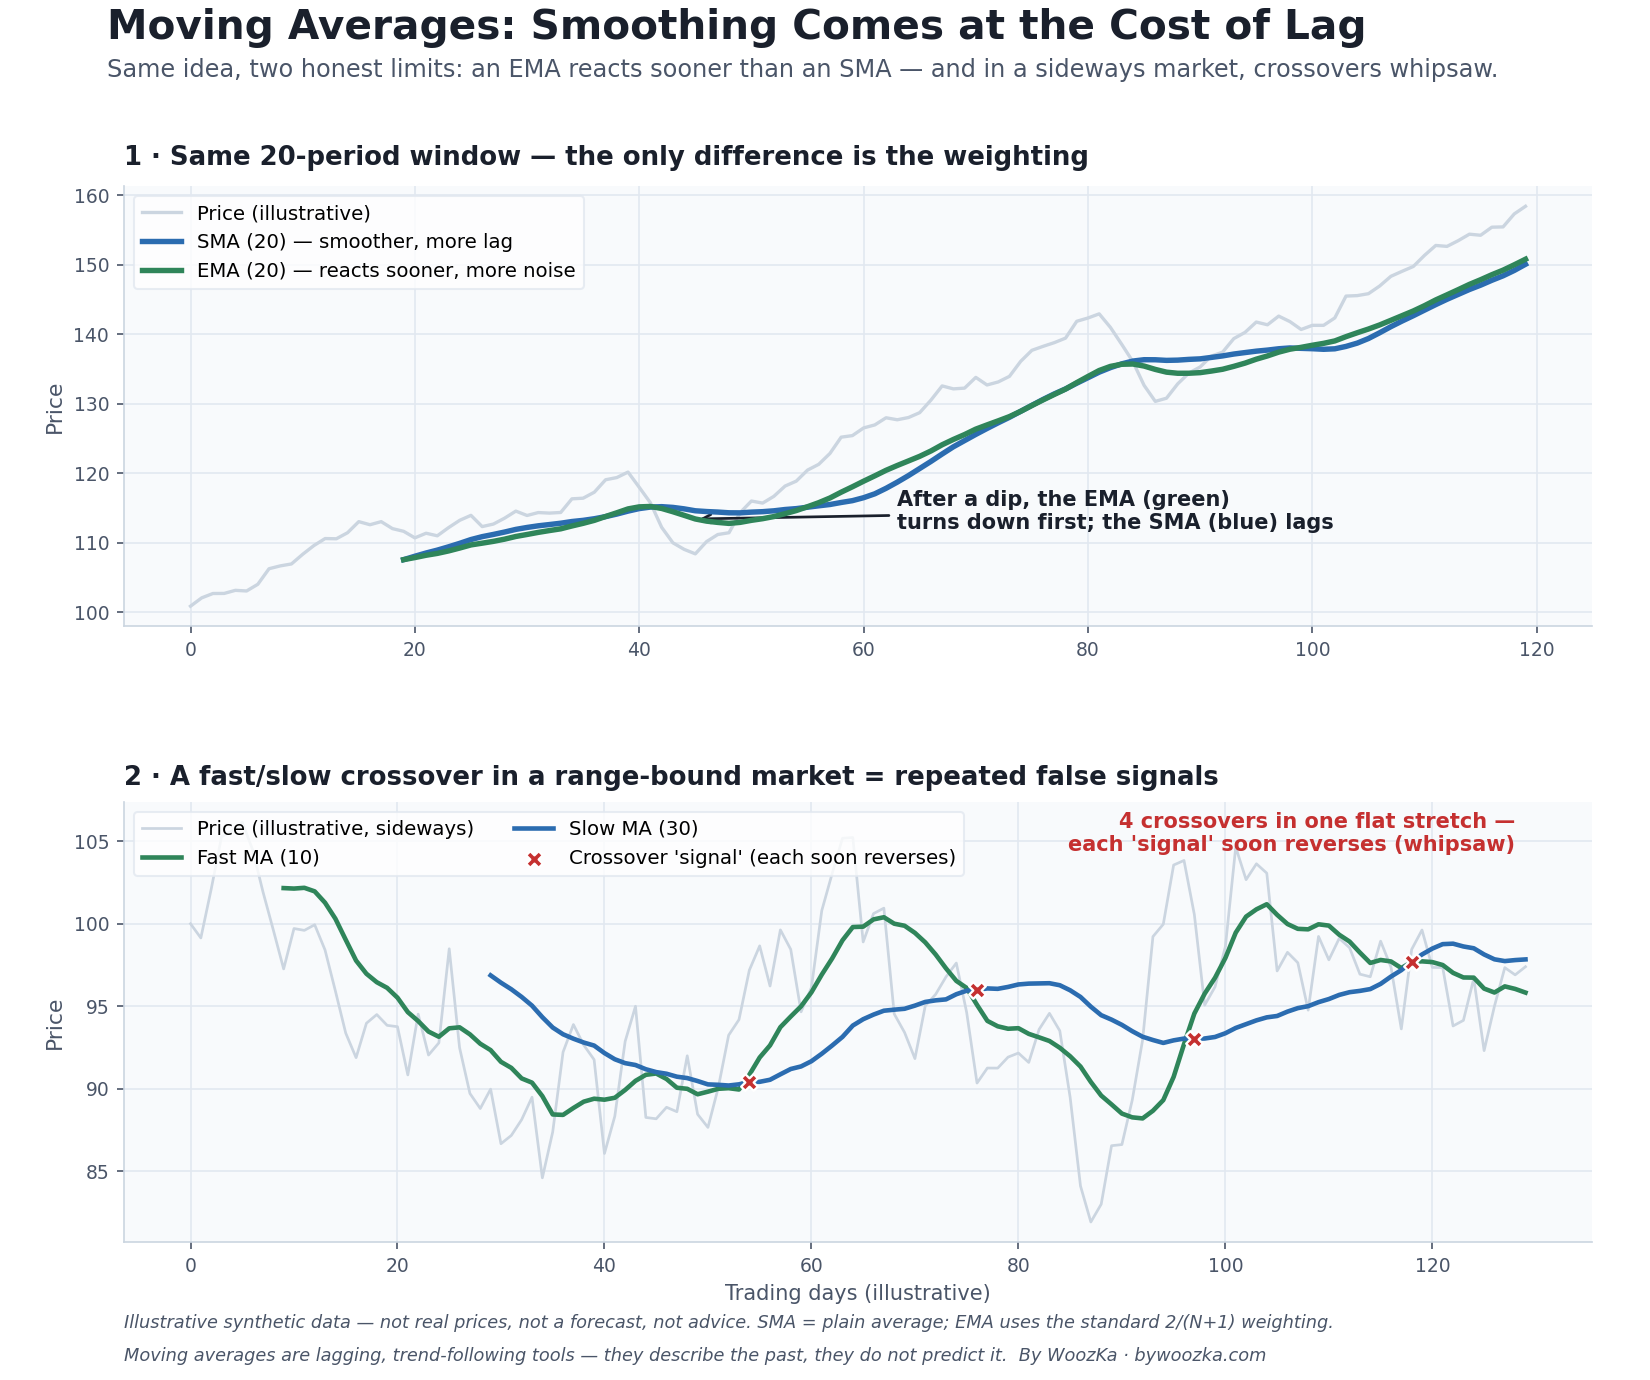 Two honest limits in one picture. Left/top: an EMA and an SMA of the same length differ only in how they weight recent prices — the EMA hugs price and turns sooner; the SMA is smoother and slower. Right/bottom: in a range-bound market a crossover system crosses, recrosses, and crosses again, and every “signal” reverses almost immediately. Everything below is about understanding both.
The moving average is probably the first indicator any new trader ever adds to a chart, and for good reason: it is simple, it is visual, and it does one useful thing well — it strips out the day-to-day noise so the underlying trend is easier to see. But “simple” is not the same as “reliable,” and the two most common questions beginners ask — what’s the difference between an SMA and an EMA? and which one should I use? — hide a more important truth that this article is built on.
Here is the honest framing up front: a moving average is a lagging, trend-following tool. It describes where price has been; it does not predict where price is going. Every moving average is calculated entirely from past prices, so by construction it arrives late — it can only confirm a move after it has started. The choice between a simple moving average (SMA) and an exponential moving average (EMA) is not a choice between “worse” and “better.” It is a trade-off between smoothness and speed, and understanding that trade-off — plus the ways moving averages fail — matters far more than which type you pick. This guide covers what a moving average actually measures, the exact formulas for both, the real SMA-vs-EMA difference, what golden and death crosses are, and why crossover systems whipsaw.
One thing before the comparison, since choosing between them is what this article is for. Over five or six years of losing I taught myself to code indicators and built more than a thousand of them — new logic on top of basic indicators, reworked versions of other people’s custom indicators, replotted and color-coded variants that mostly made a signal easier to see. SMA versus EMA belongs to that same family of choice. It feels decisive while you are making it. Looking back, the honest account is that the variations absorbed the years, and whether the underlying idea had an edge at all is the question I should have been asking instead.
Smoothing Price Into a Single Line
A moving average takes the average price of a security over a set number of recent periods and recalculates it each period as new data arrives — so the average “moves” along with price [source: StockCharts ChartSchool, “Moving Averages – Simple and Exponential”]. If you plot a 20-day moving average, each point on that line is the average of the most recent 20 closing prices as of that day.
The purpose is smoothing. Raw price jumps around on every bar; a moving average filters out some of that jitter so the direction of the trend is clearer. That is genuinely useful. But it comes with an unavoidable cost: because the line is an average of past prices, it always trails the current price. When price turns, the moving average keeps pointing the old way for a while before it catches up. This lag is not a flaw you can tune away — it is the direct result of how the indicator is built. Every moving average, of every type and length, is a lagging indicator [source: StockCharts ChartSchool; Britannica Money, “Simple vs. Exponential Moving Averages”].
Keep that in mind through everything below: the entire SMA-vs-EMA debate is really an argument about how much lag you are willing to accept in exchange for how much smoothness.
The Simple Moving Average (SMA)
The SMA is exactly what it sounds like: the plain arithmetic average of the closing prices over your chosen look-back period. A 5-day SMA is the sum of the last five closing prices divided by five; a 20-day SMA is the sum of the last twenty divided by twenty [source: Britannica Money, “Simple vs. Exponential Moving Averages”; StockCharts ChartSchool].
- SMA = (sum of the last N closing prices) ÷ N
Every price in the window counts equally. The close from 20 days ago carries exactly the same weight as yesterday’s close. That equal weighting is what makes the SMA smooth — no single day can yank the line around much — but it is also why the SMA is slow: an old, stale price keeps influencing the average until it finally drops out of the window. The larger the N, the smoother and slower the line.
The Exponential Moving Average (EMA)
The EMA answers a reasonable objection to the SMA: why should a price from twenty days ago matter as much as yesterday’s? The EMA weights recent prices more heavily than older ones, so it responds faster to new information [source: Britannica Money; Charles Schwab, “A Moving Average: Simple vs. Exponential”; StockCharts ChartSchool].
It does this with a smoothing factor (also called the weighting multiplier), calculated from the period length:
- Smoothing factor = 2 ÷ (N + 1)
For a 20-period EMA, that is 2 ÷ 21 ≈ 0.0952, or about 9.52% [source: Britannica Money; StockCharts ChartSchool]. Each new EMA value is then a blend of today’s price and yesterday’s EMA:
- EMA(today) = Price(today) × 0.0952 + EMA(yesterday) × (1 − 0.0952)
In plain terms: roughly 9.5% of today’s EMA comes from today’s price, and the other ~90.5% carries forward the previous EMA (which itself already embeds all the earlier prices, fading them out exponentially). Because recent prices get the biggest share, the EMA turns sooner than an SMA of the same length. The trade-off is that this same sensitivity makes the EMA noisier — it reacts to short-lived wiggles that the SMA would have smoothed over [source: Charles Schwab; StockCharts ChartSchool].
SMA vs EMA: The Difference That Matters
Here is the whole thing in one sentence: for the same look-back period, an EMA reacts faster and an SMA is smoother — that is the entire difference, and neither is “better.”
The top panel of the chart above makes it concrete. Both lines are 20-period averages of the same price series, so the only thing separating them is the weighting. When price dips, the EMA (which leans on recent prices) turns down first; the SMA lags behind because the older, higher prices in its window are still pulling it up. In a fast-moving market the EMA will get you the trend change earlier — and it will also fake you out more often, because some of those quick turns are just noise, not a real change in trend [source: Schwab; StockCharts ChartSchool; Britannica Money].
That gives a rough, honest rule of thumb — not a strategy, just an orientation:
- An EMA prioritizes responsiveness. It is often preferred for shorter-term timeframes where getting the turn a day or two earlier matters, at the cost of more false turns [source: Britannica Money; Schwab].
- An SMA prioritizes stability. It is often preferred for longer-term trend context, where you want to ignore short-term noise and only register durable moves, at the cost of more lag [source: StockCharts ChartSchool].
Neither of those is a signal to buy or sell anything. They describe personality, not profitability. Which one “fits” depends on your timeframe and how much noise you can tolerate — and, crucially, on how the choice actually performs when you test it honestly, which is a separate question this article gets to below.
The lag is the same. Only its shape differs.
That rule of thumb is the right starting point, and it is worth making exact — because both averages are fixed arithmetic, their delay is not a matter of taste. Measure each one by the average age of the price data inside it and something surprising falls out:
| Period | SMA average lag | EMA average lag |
|---|---|---|
| 10-period | 4.5 bars | 4.5 bars |
| 20-period | 9.5 bars | 9.5 bars |
| 50-period | 24.5 bars | 24.5 bars |
| 200-period | 99.5 bars | 99.5 bars |
They are identical — both exactly (n − 1) ÷ 2 bars. A 20-period average of either kind is carrying price data that is 9.5 bars old on average. So the EMA is not, on the whole, faster; it is faster at some things and slower at others, and the averages come out even.
This is not a backtest — no market data is involved and nothing here says which average makes money. It is a measurement of what the two weighting schemes do.
Where the EMA really is quicker, and where it reverses
Feed both a single clean step — price jumps to a new level and stays — and count the bars each one needs to travel a given share of the distance:
| Period | Half the move | 90% of the move | 99% of the move |
|---|---|---|---|
| 10-period | 5 / 4 | 9 / 12 | 10 / 23 |
| 20-period | 10 / 7 | 18 / 24 | 20 / 47 |
| 50-period | 25 / 18 | 45 / 58 | 50 / 116 |
| 200-period | 100 / 70 | 180 / 231 | 198 / 461 |
Bars needed, shown as SMA / EMA. The first column is the rule of thumb earning its keep: at 20 periods the EMA is halfway there in 7 bars against the SMA’s 10. The last column is the part nobody mentions. The SMA finishes the move in 20 bars — in fact an SMA completes any step in exactly its own period, then stops. The EMA needs 47 bars to get to 99%, and never actually arrives.
That is the honest version of the trade-off: the EMA front-loads its reaction and pays for it with a long tail. It turns sooner and it lets go later.
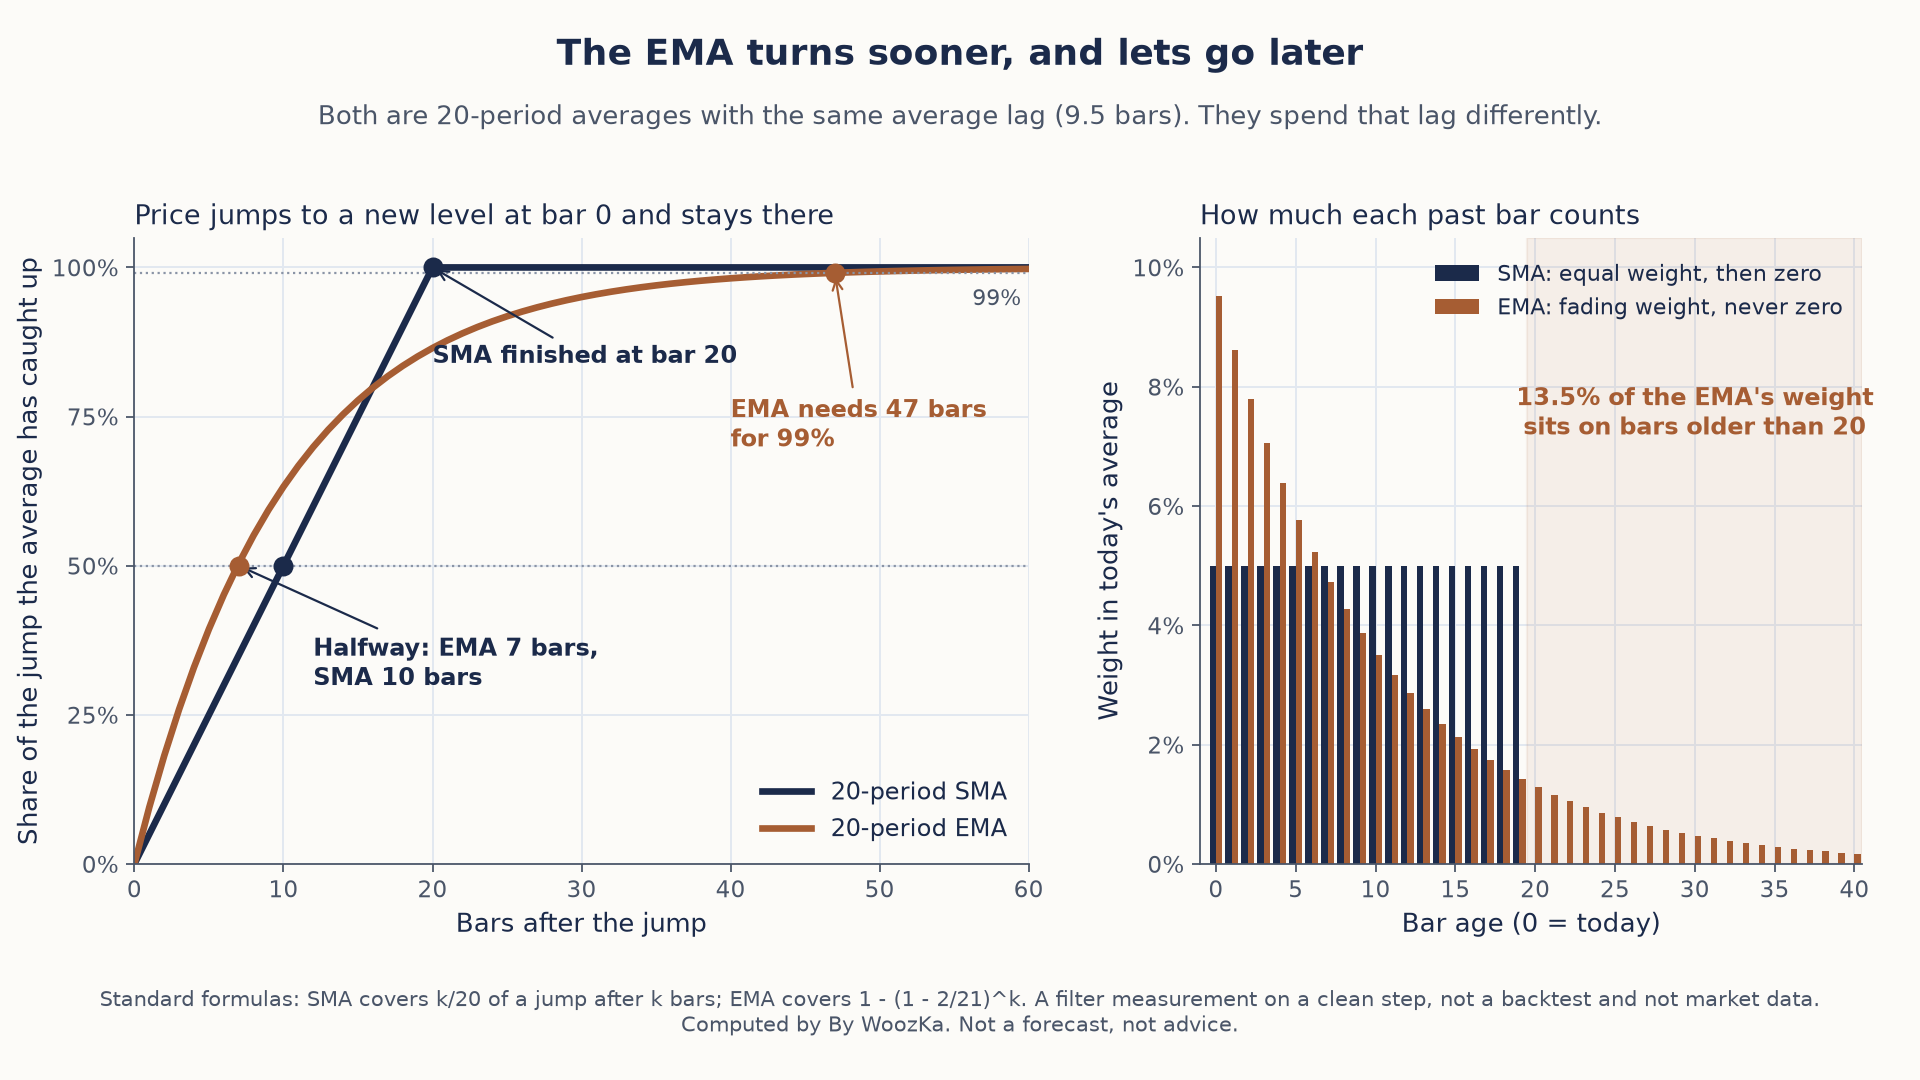 The EMA gets halfway to a new price level sooner, but its fading weights keep older prices in play, so it takes more than twice as long as the SMA to finish the move.
An EMA has no look-back period at all
The last consequence is the one most likely to change how you read a chart. An SMA genuinely forgets: a 20-period SMA uses twenty prices and the twenty-first has no influence whatsoever. An EMA never forgets anything — its weights shrink but never reach zero, so a meaningful share of a “20-period” EMA is data from outside those twenty bars:
| Period | Weight sitting outside the period | Bars needed to hold 99% of the weight |
|---|---|---|
| 10-period | 13.4% | 23 bars |
| 20-period | 13.5% | 47 bars |
| 50-period | 13.5% | 116 bars |
| 200-period | 13.5% | 461 bars |
About 13.5% of every EMA lives outside its own nominal period, whatever the period is — the figure barely moves between 10 and 200 because it converges to a constant. To capture 99% of what a “20-period” EMA is actually looking at you need 47 bars of history, not 20.
None of which makes either average better. It does mean the two labels are not comparable in the way the names suggest: a 20-period SMA and a 20-period EMA agree on their average lag, disagree about how they spend it, and do not even cover the same stretch of history.
Method, so it can be checked rather than taken on trust: average lag is the weighted mean age of the prices in each average — (n − 1) ÷ 2 for the SMA, and (1 − a) ÷ a for the EMA with the standard a = 2 ÷ (n + 1). The script verifies the EMA figure independently by summing its actual weights rather than trusting the formula. Step response is k ÷ n for the SMA and 1 − (1 − a)^k for the EMA. Each figure above was generated by that code, not entered manually.
Common Periods, and the Famous Crosses
Certain look-back lengths show up everywhere, mostly by convention rather than by any law of markets. Short averages (like 10 or 20 periods) track price closely; medium ones (like 50) describe the intermediate trend; and the 200-day average is the classic long-term trend gauge [source: StockCharts ChartSchool; Britannica Money, “Death Cross vs. Golden Cross”]. There is nothing magic about these numbers — they are popular defaults, and popularity is not evidence.
The most talked-about moving-average events are two crossovers of the 50-day and 200-day lines:
- A golden cross is when the shorter-term average (typically the 50-day) crosses above the longer-term average (typically the 200-day). It is widely described as a bullish signal [source: Britannica Money, “Death Cross vs. Golden Cross”; Fidelity/Motley Fool coverage].
- A death cross is the opposite: the 50-day crosses below the 200-day, widely described as bearish [source: Britannica Money, “Death Cross vs. Golden Cross”].
They sound authoritative, and the names are dramatic, so it is worth being blunt about what they are. Both are lagging signals: because they are built from 50 and 200 days of past prices, they confirm a trend change only well after it has begun — by the time a death cross forms, much of the decline it “warns” about may already have happened [source: Britannica Money, “Death Cross vs. Golden Cross”]. And in choppy markets they produce false signals: the averages cross, then quickly recross, so the “signal” reverses before it pays off. The standard advice from the sources that explain these patterns is the same one this whole silo repeats — do not treat a golden or death cross as a standalone trigger; confirm it with other information and manage risk [source: Britannica Money, “Death Cross vs. Golden Cross”].
The Big Limitation: Lag and Whipsaw
Two failure modes follow directly from what a moving average is, and no setting fixes them.
Lag. Since the line averages past prices, it always turns after price does. A longer average lags more; a shorter one lags less but wiggles more. You can trade one problem for the other, but you cannot get rid of both — that is the smoothness-versus-speed trade-off, restated.
Whipsaw. This is the one that quietly drains accounts. A moving-average crossover system assumes the market is trending. When the market instead goes sideways — drifting in a range, which markets do a great deal of the time — the fast and slow averages cross back and forth around each other, and each crossing looks like a signal that immediately reverses. The bottom panel of the chart shows exactly this: four crossovers in one flat stretch, each one a “buy” or “sell” that evaporates. A trader mechanically acting on every cross would have been chopped up, paying costs and taking small losses on each false turn. Crossover systems tend to give back in range-bound markets much of what they make in trending ones [source: Britannica Money, “Death Cross vs. Golden Cross”; StockCharts ChartSchool].
The practical point is the same as with any indicator on this site: knowing which regime you are in — trending or ranging — matters more than the moving average itself.
Does the Golden Cross Hold Up in Testing?
This is the honest heart of the article, and the place where a lot of trading content quietly cheats. The truthful answer is: the evidence is mixed, it changes over time, and it shrinks the harder you test it.
The most-cited academic case for moving averages is Brock, Lakonishok, and LeBaron (1992), published in The Journal of Finance. Testing simple moving-average and trading-range-break rules on the Dow Jones Industrial Average from 1897 to 1986 with bootstrap methods, they found that buy signals generated higher returns than sell signals and that the results were not consistent with several standard “random” models of stock returns — read at the time as strong support for these simple rules [source: Brock, Lakonishok & LeBaron, “Simple Technical Trading Rules and the Stochastic Properties of Stock Returns,” Journal of Finance 47(5), 1992]. That sounds like a green light — until you read the caveats and the follow-up work.
Two caveats matter enormously. First, those tests were run without transaction costs; real trading incurs commissions and spreads on every crossover, which eat into exactly the kind of frequent-signal strategy moving-average rules produce. Second — and this is the big one — Sullivan, Timmermann, and White (1999), also in The Journal of Finance, re-examined that whole family of rules while explicitly correcting for data-snooping bias: the statistical inflation you get from trying many rules and reporting the best one. Using White’s “Reality Check” bootstrap across a large universe of trading rules, they found that although the best rules looked good over the original historical sample, their performance in a roughly ten-year out-of-sample period was weak, which the authors read as consistent with markets having become more efficient [source: Sullivan, Timmermann & White, “Data-Snooping, Technical Trading Rule Performance, and the Bootstrap,” Journal of Finance 54(5), 1999]. A common pattern across studies of U.S. markets is exactly this: apparent profitability in the earlier part of the record, much weaker or absent in the later part [source: Sullivan, Timmermann & White, 1999].
Sit with what that means, because it is the entire lesson of this silo in one example. A moving-average rule that looked genuinely profitable on decades of data (1) ignored the trading costs that would have applied in real life, and (2) faded once researchers accounted for how many rules they had tried and tested it on data it had never seen. That is overfitting and out-of-sample failure — the exact traps the backtesting pillar is about — showing up in the single most popular indicator there is.
So the non-negotiable disclaimer for everything in this silo applies here with full force: past performance, backtested or live, does not predict future results. A moving-average crossover is not a money machine, and any source presenting one as a reliable win is either selling something or hasn’t tested it honestly.
How Traders Use Them in Practice
None of the above means moving averages are useless — it means they are context, not triggers. Used honestly, here is the role they tend to play. (As always in this silo, none of this is presented as a profitable setup; no indicator delivers that, and every rule below is only worth anything after it survives a proper backtest.)
As a trend filter. Many traders use a long average — the 200-day is common — simply to define the backdrop: price above it is treated as a broadly uptrending environment, below it as a downtrending one. The average isn’t the signal; it’s the weather report you check before doing anything else [source: StockCharts ChartSchool].
As dynamic support or resistance. In a sustained trend, price often pulls back toward a moving average and resumes, so some traders watch a rising average as a possible support zone (and a falling one as resistance). This is a tendency, not a rule — the average offers no actual support; it is just a line, and price ignores it regularly [source: StockCharts ChartSchool].
As confirmation, never in isolation. A moving average is derived entirely from price, so it can never tell you more than price already contains. Its most defensible use is to confirm something you are already seeing — a trend, a structural level, a shift in volume — rather than to generate a signal by itself.
Then test it honestly — this is the step most people skip. If you are going to turn a moving average into a rule (a crossover system, a trend filter, a pullback entry), run it through a proper backtest: use out-of-sample data, include realistic transaction costs, and strictly limit how many period-and-type combinations you try. A crossover that only “works” at one precise pair of lengths, with costs ignored, is almost certainly fitted to the past rather than telling you anything about the future — which is precisely what the Brock-versus-Sullivan story above demonstrates. That rigor is the entire subject of the trading-systems pillar.
If you’ve ever added a moving average to a chart, watched it cross, taken the trade, and been stopped out on the very next reversal, you already know the feeling this article is trying to spare you. The line did its job — it smoothed and reported the recent trend. What failed was the assumption that a crossover is an instruction rather than a description.
Where Crossover Traders Get Hurt
- Treating a crossover as a buy/sell order. A golden or death cross is a lagging description of the trend, not a trigger. Both fire late and both whipsaw in ranges.
- Assuming the EMA is “better” because it’s faster. Faster means earlier and noisier. Speed is a trade-off against false signals, not a free upgrade.
- Believing 50/200 (or any period) is special. They are popular conventions. Popularity is not evidence, and it does not make the numbers predictive.
- Running a crossover system in a sideways market. This is where moving averages fail most reliably. They assume a trend; a range chops them up.
- Optimizing the two periods until the backtest looks perfect. That is curve-fitting the past — the single most common way a great-looking moving-average rule becomes a live loser.
- Forgetting transaction costs. Crossover systems trade often; costs that look trivial per trade can erase the whole edge, as the academic caveat above shows.
Before You Trade a Moving-Average Rule
Moving averages sit underneath a good deal of the rest of this silo. These are the pieces built on top of them, plus the one that decides whether any rule is worth trading:
- How to Backtest a Trading Strategy the Right Way — the pillar every moving-average rule should pass through, including why an over-tuned crossover pair is a textbook overfit.
- What Is Overfitting in Backtesting (And How to Avoid It) — the deeper dive on the trap that turned decades of “profitable” moving-average results into a much weaker out-of-sample record.
- RSI Explained: How to Use It Without the False Signals, MACD Explained (which is itself built from moving averages), and Bollinger Bands Explained — what these other indicators measure and their own known false-signal patterns, so you build rules on honest components.
If you want the plain-English, rigor-first read on indicators and systems — explained honestly, never hyped — that is what the newsletter is for. Subscribe below.
Disclaimer: This article is educational content, not financial advice. I am not a licensed financial advisor, and nothing here is a recommendation to buy or sell any security or asset. Investing and trading involve risk, including the possible loss of the money you invest. Do your own research and consider consulting a licensed financial professional before making investment decisions. Read the full Disclaimer.
Historical and backtested results are hypothetical, carry inherent limitations, and do not guarantee future results. Figures were accurate to the best of my knowledge as of this article’s last-updated date and may have changed.
