MACD Explained: A Practical Guide to the Indicator Everyone Misuses
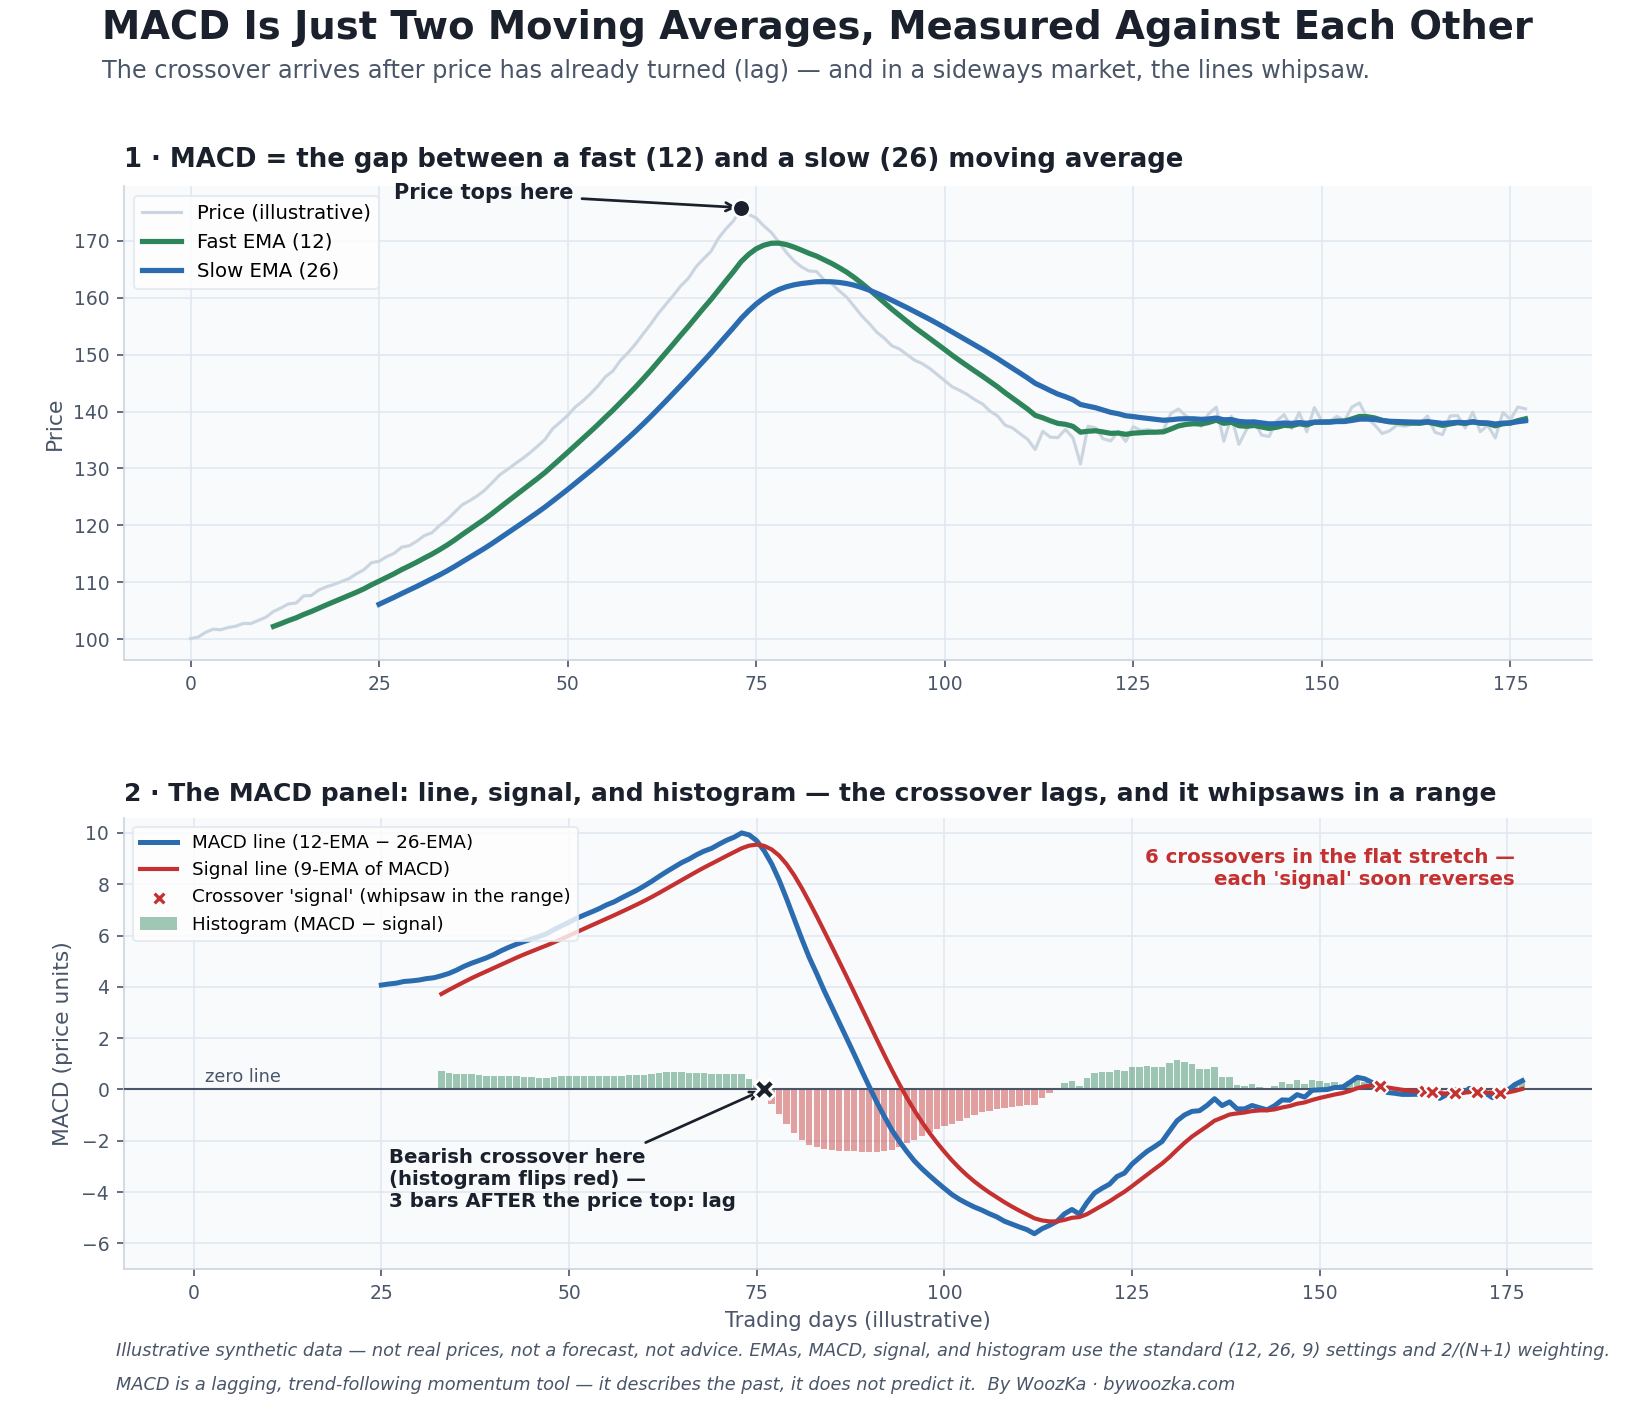 The whole indicator in one picture. Top: MACD is nothing more exotic than the distance between a fast (12) and a slow (26) moving average. Bottom: that distance is plotted as the MACD line, smoothed into a signal line, and the gap between them drawn as a histogram. The two annotations are the whole point of this article — the crossover arrives late (lag), and in a range the crossings whipsaw. Everything below is about reading it honestly.
MACD is one of the most popular indicators on any charting platform, and also one of the most misread. The name — Moving Average Convergence Divergence — sounds technical enough that a lot of beginners treat it as a kind of oracle: MACD crosses up, you buy; MACD crosses down, you sell. That is precisely the misuse this article is named for, and it is a reliable way to get chopped up.
Here is the honest framing up front: MACD is a lagging, trend-following momentum indicator. It is built entirely from moving averages of past prices, so like every moving average it describes where price has already been — it does not predict where price is going. It can be a genuinely useful lens for seeing momentum and trend at a glance. It is not a buy/sell trigger, and no crossover it produces is a reliable one. This guide covers what MACD actually measures, the exact formula (it is simpler than the name suggests), its three classic signals, the specific ways people misuse it, and what the evidence honestly says about whether it “works.”
If you have not read the companion piece on moving averages, it is worth a look first — because once you see that MACD is just two moving averages measured against each other, most of the mystique falls away and the honest limits come into focus.
A disclosure before the mechanics, because it shapes how this article is written. I spent five or six years as a losing trader, and for most of that time I believed that if I just had a good enough indicator I would make a lot of money. MACD is the natural home of that belief: familiar enough to feel proven, and adjustable enough that a poor result always looks like the wrong settings rather than the wrong premise. Chasing that idea I taught myself to code indicators and built more than a thousand of them. Everything below about how MACD works is accurate. The belief that how it works is the thing standing between a trader and profit is the part I paid for.
What MACD Is Built From
MACD was created by Gerald Appel, a New York technical analyst and money manager, in the late 1970s [source: StockCharts ChartSchool, “MACD (Moving Average Convergence/Divergence) Oscillator”; Wikipedia, “MACD”]. He was trying to capture something a single moving average doesn’t show: not just the direction of the trend, but its momentum — whether the trend is gathering strength or running out of it. His solution was elegant and, importantly, not complicated: take two exponential moving averages of different lengths, subtract the slower one from the faster one, and plot the result [source: StockCharts ChartSchool; Wikipedia].
That result is the MACD line, and it has an intuitive meaning. When a fast moving average pulls away above a slow one, recent prices are rising faster than the longer trend — momentum is building to the upside, and the MACD line rises above zero. When the fast average falls below the slow one, momentum is turning down, and the MACD line drops below zero. The indicator is literally measuring the convergence and divergence of two moving averages — hence the name.
The modern MACD has three parts, and keeping them straight is half the battle:
- The MACD line — the gap between a fast and a slow EMA. This is the core of the indicator.
- The signal line — a moving average of the MACD line itself, which smooths it and gives you a second, slower line to compare against.
- The histogram — the gap between the MACD line and the signal line, drawn as bars. It was added later, by Thomas Aspray, who presented the MACD-signal spread in 1984 and named it the MACD-Histogram in 1986 [source: StockCharts ChartSchool; Thomas Aspray, “MACD Momentum,” Technical Analysis of Stocks & Commodities, 1988]. The histogram is positive when the MACD line is above the signal line and negative when it is below [source: StockCharts ChartSchool].
The Formula (It’s Simpler Than the Name)
Here is the entire calculation, using the standard settings almost every platform ships with — 12, 26, 9 [source: StockCharts ChartSchool; Wikipedia, “MACD”]:
- MACD line = 12-period EMA − 26-period EMA (of closing prices)
- Signal line = 9-period EMA of the MACD line
- Histogram = MACD line − Signal line
That’s it. If you read the moving averages article, you already know what an EMA is and how its smoothing factor works — MACD just uses three of them. The 12-period EMA weights recent prices with a smoothing factor of 2 ÷ (12 + 1) ≈ 0.154, the 26-period EMA with 2 ÷ (26 + 1) ≈ 0.074, and the 9-period signal line with 2 ÷ (9 + 1) = 0.20 [derived from the standard EMA smoothing factor 2 ÷ (N + 1); see the moving averages article]. Nothing about MACD is more advanced than the moving-average math you already understand; the indicator just arranges it so momentum is easier to see.
Appel picked 12, 26, and 9 for daily stock charts in the late 1970s [source: StockCharts ChartSchool; Wikipedia]. There is nothing sacred about those numbers — they are conventions, not constants of nature, and that fact turns out to matter a great deal when we get to whether MACD “works” below.
The Three Classic Signals
Traders read MACD three main ways. It is worth learning all three and the standard caution that attaches to each, because the caution is the part that usually gets dropped.
1. Signal-line crossovers. When the MACD line crosses above its signal line, it is read as bullish momentum; when it crosses below, bearish [source: StockCharts ChartSchool; OANDA, “Determining Entry and Exit Points with MACD”]. This is the most common way MACD is used — and, as we’ll see, the most commonly misused, because crossovers happen constantly and most of them lead nowhere.
2. Zero-line (centerline) crossovers. When the MACD line itself crosses above zero, the fast EMA has just crossed above the slow EMA — the shorter-term trend has turned up relative to the longer one; below zero is the reverse [source: StockCharts ChartSchool]. A zero-line crossover is a slower, “bigger” event than a signal-line crossover, because it reflects the two underlying moving averages actually crossing.
3. Divergence. When price makes a new high but the MACD line makes a lower high (or price makes a new low while MACD makes a higher low), that “divergence” is read as a sign the momentum behind the move is fading [source: StockCharts ChartSchool; OANDA]. It is the most seductive MACD signal — and, per the sources that explain it, one of the least reliable, because divergence appears frequently and does not always lead to a reversal [source: StockCharts ChartSchool]. Momentum can fade for a long time while price keeps going.
Notice the pattern: every one of these is a description of momentum that has already happened, not a prediction. That is not a knock on MACD — it is what a momentum indicator built from past-price averages can honestly be. The trouble starts when people forget it.
The Misreadings That Cost Money
This is the section the article is named for. None of these mistakes is exotic; they are the default way MACD gets used, which is exactly why they are worth spelling out.
Misuse #1 — Treating every crossover as a trade. The signal line and MACD line cross often. Most of those crossings are noise, especially when momentum is weak. Buying every bullish cross and selling every bearish one turns a momentum lens into a trade-generating machine that fires far more often than the market actually turns — and each false fire costs a commission, a spread, and usually a small loss.
Misuse #2 — Using it in a sideways market. MACD is a trend-following tool. When price is ranging rather than trending — which markets do a great deal of the time — the MACD and signal lines cross back and forth around each other, producing a stream of crossover “signals” that immediately reverse. Sources that catalog MACD’s weaknesses are blunt about this: MACD’s signals fail most often in sideways or choppy markets, where the two lines repeatedly cross with little predictive value [source: StockCharts ChartSchool; multiple broker education desks]. The bottom panel of the chart above shows exactly this whipsaw cluster.
Misuse #3 — Treating divergence as a timing tool. Spotting a divergence and immediately shorting the top (or buying the bottom) assumes the reversal is imminent. It often isn’t. Divergence can persist for a long stretch while a strong trend keeps running, taking out anyone who treated the divergence as a precise trigger. Divergence is a heads-up that momentum is softening, not a countdown.
Misuse #4 — Forgetting that it lags. Because the slow leg of MACD is a 26-period EMA of past prices, MACD is a lagging indicator — it reacts after price moves, so it can be late to fast turns and to high-volatility conditions [source: StockCharts ChartSchool; LuxAlgo, “Leading vs Lagging Indicators”]. By the time a clean crossover forms, a chunk of the move it is “signaling” may already be over. That lag is structural; no setting removes it.
Misuse #5 — Optimizing the settings until a backtest looks good. This is the subtle one, and it ties MACD straight into this blog’s central lesson. Because 12/26/9 are just conventions, it is tempting to hunt for the “best” numbers by testing hundreds of combinations against historical data and keeping whatever produced the highest return. That is not tuning — it is curve-fitting the past, and it produces settings that describe old noise beautifully and predict nothing. The backtesting pillar and the overfitting article are about exactly this trap.
Misuse #6 — Using it alone. The standard advice from every serious source is the same: MACD is not a standalone signal generator; it is one input to be confirmed by price action, market structure, and risk management [source: StockCharts ChartSchool; broker education desks]. A single indicator derived entirely from price can never tell you more than price already contains.
Lag and Whipsaw: The Two Structural Costs
Two failure modes follow directly from what MACD is, and they are the same two that afflict its parent, the moving average.
Lag. MACD is assembled from EMAs of past prices, so it always turns after price does. You can make it a touch faster with shorter settings, but only by making it noisier — the same smoothness-versus-speed trade-off that governs every moving average. There is no combination of numbers that is both fast and clean.
Whipsaw. In a trending market MACD can look almost prescient — the crossovers line up with the moves because there are sustained moves to catch. In a range, the same indicator falls apart: the lines cross, recross, and cross again, and every crossing is a “signal” that evaporates. This is not a defect you can fix with better settings; it is what a trend-following momentum tool does when there is no trend. Knowing which regime you are in — trending or ranging — matters more than the MACD reading itself.
How late is “late”? The exact number of bars
Every explainer says MACD lags. Almost none of them says by how much — which is the part you need in order to judge whether the lag is affordable. It can be settled exactly, because MACD is arithmetic on past prices and nothing else.
The table below feeds the indicator a clean, perfectly regular wave — a market that rises and falls in a fixed rhythm with no noise at all — and counts the bars between the actual low and the moment the bullish crossover fires. This is not a backtest. A wave is not a market, no price history was used, and nothing here says whether MACD makes or loses money on any real instrument. It measures one thing: the delay built into the formula, on an input whose turning points are known exactly rather than argued about.
| Settings | Speed | 15-bar swing | 20-bar swing | 25-bar swing | 30-bar swing |
|---|---|---|---|---|---|
| 5/13/5 | Very fast | 3.0 bars | 3.0 bars | 2.0 bars | 1.2 bars |
| 8/17/9 | Fast | 5.0 bars | 5.0 bars | 5.0 bars | 4.2 bars |
| 12/26/9 | Standard | 5.0 bars | 6.0 bars | 6.0 bars | 6.2 bars |
| 19/39/9 | Slow | 6.0 bars | 7.0 bars | 7.0 bars | 7.2 bars |
| 24/52/18 | Very slow | 6.0 bars | 8.0 bars | 9.0 bars | 10.1 bars |
Read down any column and the trade-off described above stops being a slogan: slower settings lag more, every time, with no exceptions. Read across and something the endless “best settings” argument tends to miss shows up — the same settings are late by a different share of the move depending on how long the swing is. The standard 12/26/9 runs about 6 bars behind whatever the swing, and 6 bars is a far bigger bite out of a 15-bar move than out of a 30-bar one.
Put concretely: on a 20-bar swing, by the time the standard crossover fires, price has already traveled 65% of the distance from the low to the high. The signal is not early, and calling it “confirmation” is generous — most of the move is behind it.
What that lag costs when the market goes nowhere
Lag is only half the bill. The second table takes the same wave, buys every bullish crossover, sells at the next bearish one, and totals the points. The wave returns to exactly its starting value every cycle, so someone who simply held would finish at zero, and a perfectly timed round trip would capture the full 20.00-point range.
| Settings | Speed | 15-bar swing | 20-bar swing | 25-bar swing | 30-bar swing |
|---|---|---|---|---|---|
| 5/13/5 | Very fast | +6.15 | +11.76 | +16.15 | +19.02 |
| 8/17/9 | Fast | -6.15 | +0.00 | +6.17 | +11.76 |
| 12/26/9 | Standard | -9.95 | -6.18 | +1.25 | +4.16 |
| 19/39/9 | Slow | -13.31 | -11.61 | -6.17 | +0.00 |
| 24/52/18 | Very slow | -16.15 | -16.18 | -12.72 | -11.61 |
The minus signs are the finding. On a 20-bar swing the standard settings hand back 6.18 points per completed round trip — on a market that ended precisely where it began, with no costs, no spread, no slippage and no bad luck modeled. Buying 6 bars after the low and selling 6 bars after the high is, by itself, enough to turn a flat market into a losing one. That is whipsaw with a number attached, and it is why the regime question above matters more than the settings question.
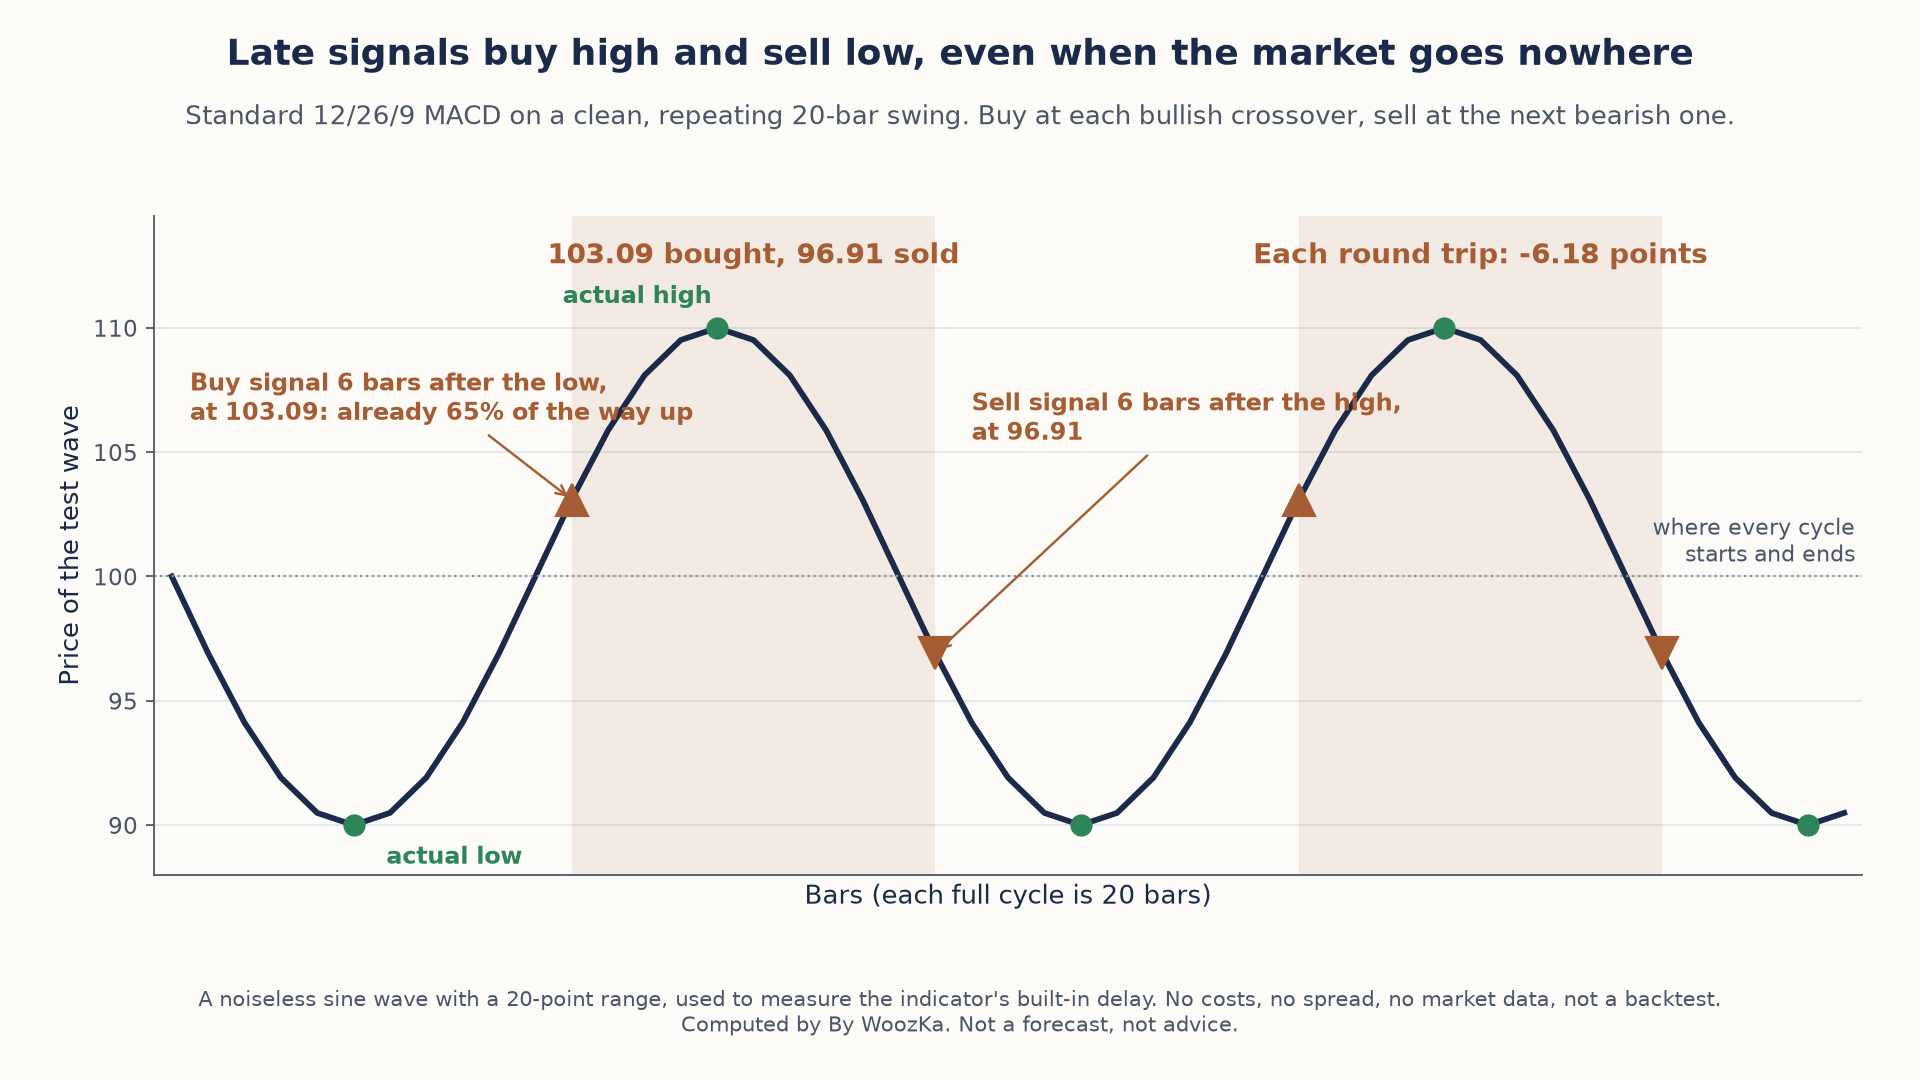 Because each crossover arrives about 6 bars after the turn, every round trip buys well above the low and sells well below the high, losing 6.18 points in a market that ends exactly where it began.
One caution about reading the top row. The fastest preset looks best here, and that is an artifact of the test, not advice. This wave is perfectly regular and completely noiseless — the one condition under which a jumpy setting is never punished. Slower settings exist precisely to survive the noise this input does not contain. The table shows the shape of the cost, not which row to trade.
Method, so it can be checked rather than taken on trust: EMA(n) uses the standard smoothing factor 2/(n+1); the MACD line is EMA(fast) − EMA(slow) and the signal line is an EMA of that line. Two full cycles are discarded first, so the EMA seeding makes no difference. Both tables, self-checks included, are generated directly by code, not typed in by hand.
What the Testing Shows
This is the honest heart of the article, and the place a lot of trading content quietly cheats. The truthful answer is: the evidence is genuinely mixed, it depends heavily on the market and the settings, and the traditional 12/26/9 version has performed poorly in several serious tests.
On the skeptical side, a widely-cited study of the traditional (12, 26, 9) MACD by Meissner and colleagues (2001) found a success rate of only about 32% on Dow 30 stocks and about 33% on individually tested NASDAQ-100 stocks over 1989–1999 — a rate so low the authors concluded the traditional MACD could almost be treated as a contra-indicator [source: Meissner et al., 2001, as summarized in “A Comparative Study of the MACD-Based Trading Strategies,” arXiv:2206.12282, 2022]. In plain terms: mechanically following the default MACD over that period would have been worse than a coin flip.
On the other side, there is a well-known positive result. Chong and Ng (2008) tested MACD and RSI rules on roughly 60 years of the London Stock Exchange’s FT30 index and found that both rules generated returns higher than a buy-and-hold benchmark in most cases [source: Chong & Ng, “Technical analysis and the London Stock Exchange: testing the MACD and RSI rules using the FT30,” Applied Economics Letters 15(14), 2008, pp. 1111–1114]. It is frequently cited precisely because clean positive results for MACD are rare. But the same authors’ follow-up work, Chong, Ng and Liew (2014), re-examined MACD and RSI rules across five OECD stock markets and found mixed results across three standard MACD models — it worked in some markets and not others [source: Chong, Ng & Liew, “Revisiting the Performance of MACD and RSI Oscillators,” Journal of Risk and Financial Management 7(1), 2014, pp. 1–12].
And here is the thread that ties it back to this whole silo. A recurring finding across this literature is that the traditional MACD settings often underperform, while optimized settings can look much better on a given market’s history [source: “Improving MACD Technical Analysis by Optimizing Parameters,” Journal of Risk and Financial Management 14(1), 2021; arXiv:2206.12282, 2022]. That sounds like good news until you remember what “optimized on this market’s history” means: it is the definition of the overfitting risk the backtesting pillar exists to warn about. Settings tuned to fit the past are settings fit to noise, and they routinely fail on data they have never seen.
So the non-negotiable disclaimer for everything in this silo applies here with full force: past performance, backtested or live, does not predict future results. MACD is not a money machine. Any source presenting a particular MACD setup as a reliable win is either selling something or hasn’t tested it honestly.
How It Gets Used by People Who Do Well With It
None of the above means MACD is useless — it means it is context, not a trigger. Used honestly, here is the role it tends to play. (As always in this silo, none of this is presented as a profitable setup; no indicator delivers that, and every rule built on MACD is only worth anything after it survives a proper backtest.)
As a momentum read at a glance. The single most defensible use of MACD is qualitative: is the histogram growing or shrinking, is the MACD line above or below zero? That tells you whether momentum is currently with the trend or against it — useful context before you do anything else, without pretending to be a signal.
As confirmation, never in isolation. Because MACD is derived entirely from price, its best use is to confirm something you are already seeing in price and structure — not to originate a trade by itself. If price action and MACD disagree, that is information; it is not an instruction.
With the regime in mind. MACD earns its keep in trends and misleads in ranges. Knowing which environment you are in — and standing down the crossover reading when the market is chopping sideways — avoids the single most common way MACD drains an account.
Then test it honestly — this is the step most people skip. If you are going to turn MACD into a rule (a crossover system, a divergence filter, a zero-line trend gate), run it through a proper backtest: use out-of-sample data, include realistic transaction costs, and strictly limit how many settings you try. A MACD configuration that only “works” at one precise triple of numbers, with costs ignored, is almost certainly fitted to the past — which is exactly what the traditional-versus-optimized results above demonstrate. That rigor is the entire subject of the trading-systems pillar.
If you have ever watched the MACD cross up, bought it, and been stopped out on the next bar’s reversal, you already know the feeling this article is trying to spare you. The indicator did its job — it reported that recent momentum had ticked up. What failed was the assumption that a crossover is an order rather than a description.
Errors That Repeat Across MACD Traders
- Treating a crossover as a buy/sell order. Signal-line crosses happen constantly; most lead nowhere. A cross is a momentum description, not a trigger.
- Running MACD in a sideways market. This is where it whipsaws most reliably. It assumes a trend; a range chops it up.
- Shorting or buying a divergence on sight. Divergence flags fading momentum, not an imminent reversal — it can persist far longer than your stop.
- Forgetting the lag. The 26-period EMA leg guarantees MACD reacts after price. Clean signals arrive late by construction.
- Hunting for the “best” 12/26/9 replacement on historical data. That is curve-fitting. Optimized-to-the-past settings are the textbook route from a great backtest to a live loser.
- Using MACD alone. One price-derived indicator can’t tell you more than price already does. Confirm with structure and manage risk, always.
The Foundations Underneath MACD
MACD borrows its machinery from simpler tools covered elsewhere here — and, like all of them, it earns a place in a system only by surviving the testing standards below:
- Moving Averages Explained: SMA vs EMA — the foundation MACD is literally built on; if the EMA math here felt fast, start there.
- RSI Explained: How to Use It Without the False Signals and Bollinger Bands Explained — the other indicators in this cluster, each with its own honest limitations and false-signal patterns, so you build rules on components you understand.
- How to Backtest a Trading Strategy the Right Way — the pillar every MACD rule should pass through, including why a hand-tuned MACD setting is a textbook overfit.
- What Is Overfitting in Backtesting (And How to Avoid It) — the deeper dive on the trap that turns “optimized” MACD settings into out-of-sample disappointments.
If you want the plain-English, rigor-first read on indicators and systems — explained honestly, never hyped — that is what the newsletter is for. Subscribe below.
Disclaimer: This article is educational content, not financial advice. I am not a licensed financial advisor, and nothing here is a recommendation to buy or sell any security or asset. Investing and trading involve risk, including the possible loss of the money you invest. Do your own research and consider consulting a licensed financial professional before making investment decisions. Read the full Disclaimer.
Historical and backtested results are hypothetical, carry inherent limitations, and do not guarantee future results. Figures were accurate to the best of my knowledge as of this article’s last-updated date and may have changed.
