The Hidden Trade Inside Your Index Fund: What the ‘Index Effect’ Cost You, and Why It Faded
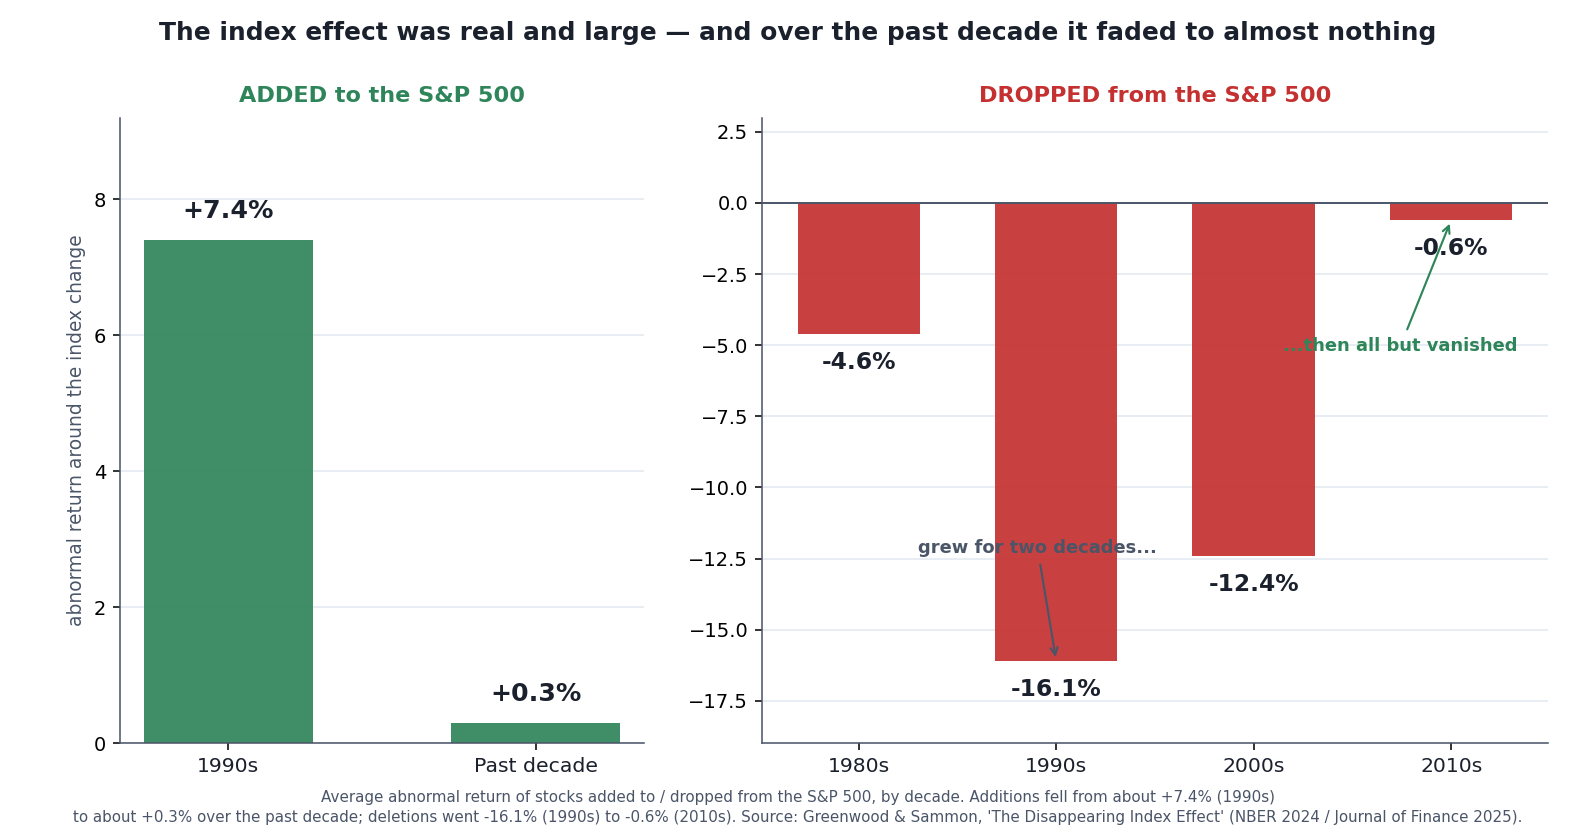
The whole story in one frame. Being added to the S&P 500 once handed a stock a free jump, and being dropped once cost it a small fortune — and then, over the past decade, both effects shrank to almost nothing. This article is about why that jump existed, why it faded, and what the answer tells you about the mechanical style you’re using when you buy an index fund.
Index investing has a pitch so clean it barely sounds like a strategy: don’t pick stocks, don’t time the market, just own everything in a set list and pay almost nothing to do it. It works, and most of the time it’s the right default for most people. I’ll say that plainly up front, because the rest of this piece pokes at a hidden cost, and I don’t want the poking mistaken for “so pick stocks instead.” It isn’t.
Here’s the cost. An index fund has exactly one job: hold what the index says, in the weights the index says. When the index changes — a company gets added, another gets dropped — the fund must trade to match, on a schedule that’s published in advance and visible to everyone. For decades, that predictability was a tax. Faster traders saw the forced buying coming and got there first, and index-fund holders quietly paid the difference. That tax has a name: the index effect. Understanding it — including the surprising fact that it has largely disappeared — is the most honest way to understand what you’re actually signing up for when you buy the market.
The One Job, and the Vulnerability Baked Into It
Start with the mechanics, because the whole thing follows from them.
A stock-market index is a rulebook. The S&P 500 is a list of about 500 large US companies, weighted by float-adjusted market value, maintained by a committee at S&P Dow Jones Indices. To be eligible a company has to clear real bars — as of 2024, an unadjusted market cap above roughly USD 14.5 billion (a threshold S&P revises over time), positive GAAP earnings in the most recent quarter and summed over the last four, a US listing and headquarters, and at least half its shares available to the public. It’s not purely mechanical: the committee has discretion and can pass over a company that clears every number. The Russell indexes, by contrast, are close to purely rules-based — once a year (moving to twice a year in 2026), FTSE Russell ranks US stocks by size and redraws the lines.
Either way, the important feature for us is the same. When the rulebook says a stock is in, every fund tracking that index has to own it, in proportion, by a set date. When the rulebook says a stock is out, every one of those funds has to sell. The date is public. The direction is obvious. And the amount of money involved is enormous. That combination — a large, forced, one-directional trade on a known date — is a standing invitation to anyone who can get there first.
What the Index Effect Was
For a long time, plenty of people accepted that invitation, and the numbers were not small.
When a stock was added to the S&P 500, it tended to jump around the announcement — the researchers Robin Greenwood and Marco Sammon measured the average “abnormal” return (the move beyond what the broad market did) at about +7.4% in the 1990s. Deletions were even more violent: a stock kicked out of the index fell about 16% on average in the 1990s, beyond the market. You can see both in the featured chart above. That’s a large, reliable move driven not by anything the company did — its business was identical the day before and after — but purely by a change in who was forced to own it.
The mechanism is front-running, in the non-criminal sense of the word. If you know a wave of price-insensitive buying is coming on a specific day, you buy ahead of it and sell into it. The index funds, bound by their rulebook, showed up on the effective date and bought at prices the anticipators had already pushed up. The gap between “what the stock was worth” and “what the fund paid” didn’t vanish into the air — it moved from the fund’s holders to the traders on the other side. Index investors were paying a toll, quietly, on every reshuffle.
Watch It Happen: Tesla, December 2020
The cleanest way to feel the mechanism is a case where everything was outsized. In November 2020, S&P announced Tesla would join the index in a single step before the open on December 21, 2020.
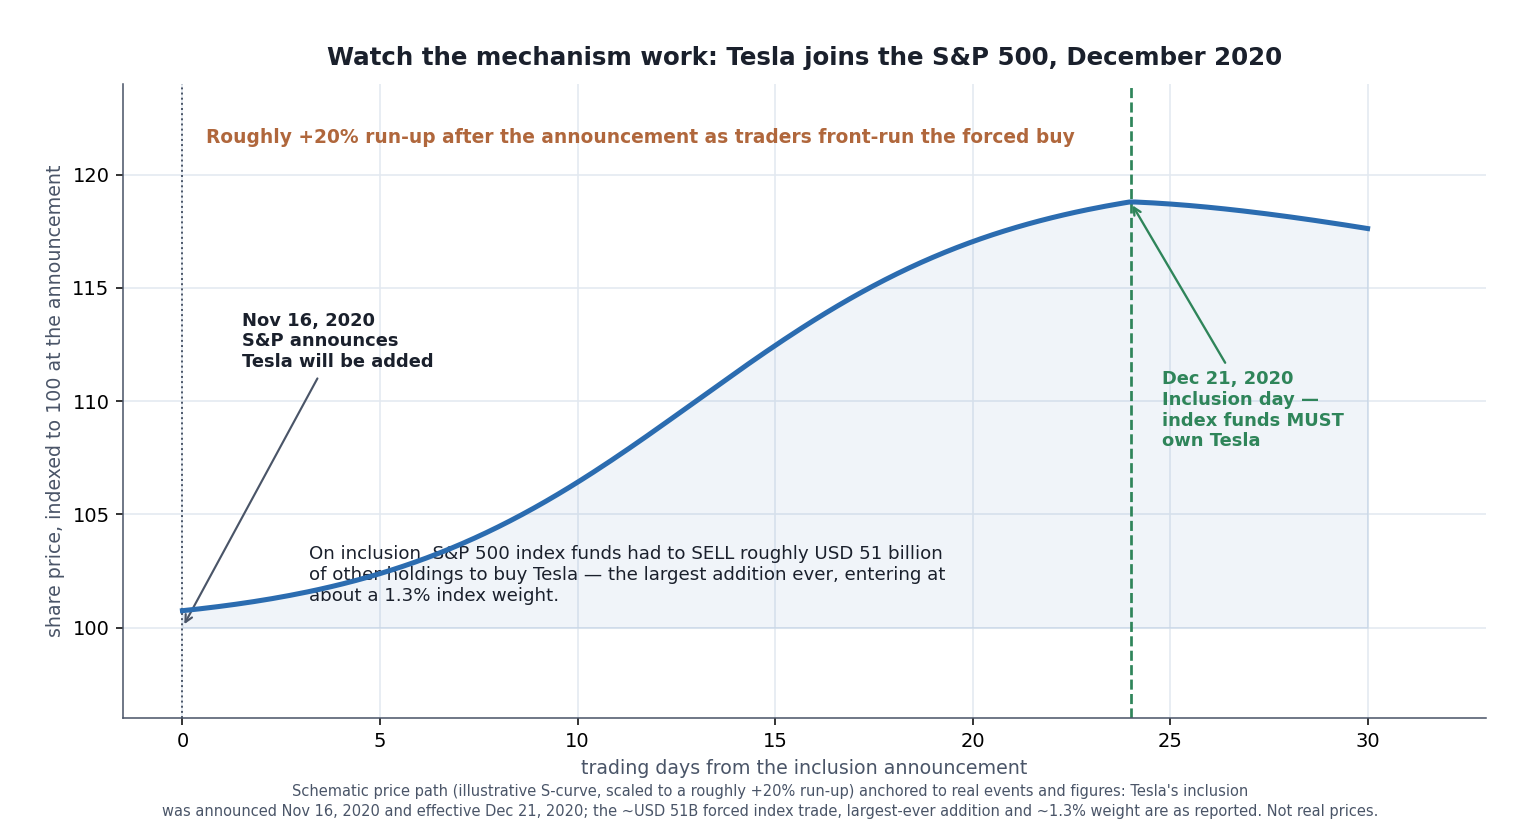
Tesla was the largest company ever added to the index, entering at roughly a 1.3% weight. To make room, S&P 500 funds had to sell around USD 51 billion of everything else and buy Tesla with the proceeds — all pinned to one date. The stock climbed sharply between announcement and inclusion as the market front-ran that forced demand. The shape here is illustrative; the events and the dollar figures are real.
Think about what that means for the index fund. It didn’t get to buy Tesla on its own schedule, at a price it liked. It had to own about 1.3% of the fund in Tesla by December 21, alongside every other S&P 500 fund on the planet, after weeks of everyone knowing the buying was coming. If you held an S&P 500 fund, you bought Tesla that week too — you just never saw the order. That’s the index effect made large enough to read on a chart.
Then It Faded
Now the twist, and it’s a genuinely surprising one. If the index effect were a simple, permanent tax, it should have gotten worse over time — the share of the stock market sitting in index funds has grown enormously, so the forced buying is bigger than ever. Instead, the tax nearly vanished.
Greenwood and Sammon, in a study titled The Disappearing Index Effect (working paper 2024, published in the Journal of Finance in 2025), tracked S&P 500 additions and deletions from 1980 to 2020. The addition pop fell from that +7.4% in the 1990s to about +0.3% over the past decade. The deletion effect collapsed from −16.1% in the 1990s to about −0.6% in the 2010s — statistically, hard to tell from zero. The right-hand panel of the featured chart is that whole arc: the effect grew through the 1980s and 1990s, and then, as more money than ever indexed, it faded to almost nothing. Both directions, roughly at the same time.
That’s not a rounding error or a one-index fluke. The authors, and S&P’s own researchers in a companion look at the question, find the same shrinkage across index families. Something structural changed.
Why It Faded
The disappearance is more interesting than the effect ever was, because it’s a small case study in how markets absorb a known inefficiency.
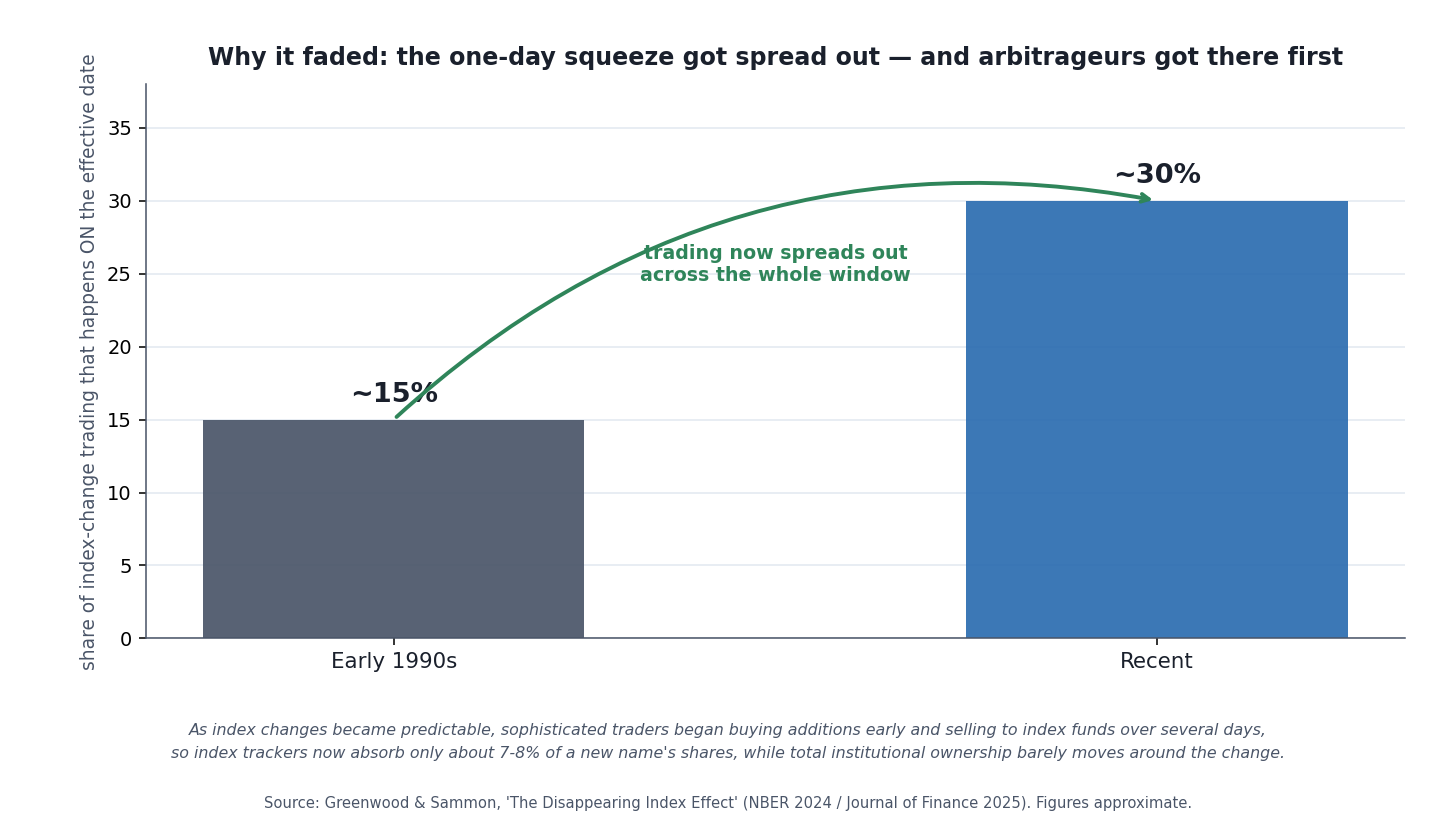
The squeeze got spread out. When all the forced buying happened in one crush on the effective date, it moved the price hard. As traders learned to supply that demand early and over several days, the one-day crush eased — and with it, the pop that the crush created.
A few things happened at once. Index changes became more predictable, so arbitrageurs got good at anticipating them — buying likely additions before the announcement and selling likely deletions, which pulls the move forward and flattens it. Institutions started standing ready to sell to the index funds rather than making them chase the price; the funds now absorb only about 7 to 8% of an added stock’s shares while total institutional ownership around the change barely moves. And the trading itself spread out — the share happening on the single effective date roughly doubled from the early 1990s, which sounds backwards until you realize the rest is now happening across the window instead of in one violent day. A quieter contributor: more additions these days are “migrations” from a related index (a company moving up from the S&P MidCap), where index-family funds already held the stock, so there’s less new buying to front-run.
Put simply: the market found the free money and competed it away. The people who used to collect the toll now compete to provide the liquidity, and competition drove the toll toward zero. That’s the efficient-markets story working exactly as advertised, on a timescale you can actually watch.
The Scale Is Still Enormous — Which Is Why It Isn’t Quite Zero
Faded is not the same as gone, and it helps to see why the vulnerability can’t fully disappear.
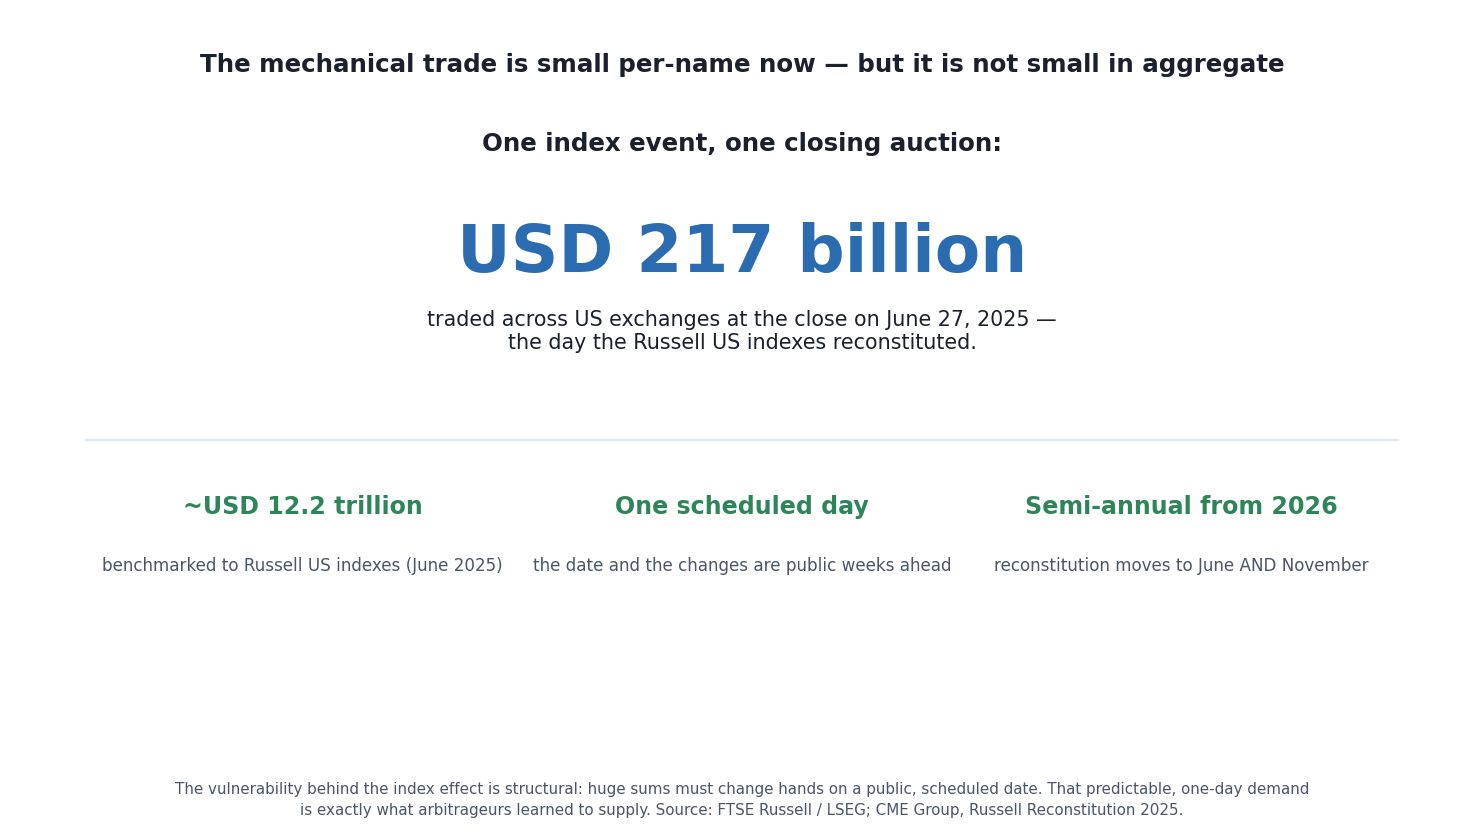
This is the structural fact underneath the whole story. Huge sums must change hands on a public, scheduled date — about USD 217 billion in one closing auction on the 2025 Russell reconstitution alone. That predictable, one-day demand is exactly what arbitrageurs learned to supply, which is why the price impact shrank; but the trade itself is as big as ever, so the impact can be squeezed, not eliminated.
The place the effect still shows up most is where liquidity is thinnest and the schedule is most predictable — smaller companies and narrower indexes, where a forced trade is large relative to how much the stock normally trades. A mega-cap joining the S&P 500 barely budges now; a small-cap shuffled around the bottom of the Russell 2000 can still move, because the same dollar of forced buying is a much bigger deal for a stock that trades lightly. The broad, deep, large-cap indexes most people actually own are where the effect is smallest.
So What Does This Mean for an Index Investor?
Here’s the honest accounting, which is the point of an article like this.
The index effect was a real cost of the indexing style — a structural consequence of outsourcing your “what to own and when to trade it” decisions to a public rulebook. For the large-cap index funds most people hold, that cost is now small, on the order of a rounding error per reshuffle. It’s larger in thin, niche, or heavily-reconstituted indexes, which is a genuine reason to be wary of exotic or narrow index products and to prefer broad, deep ones. And it never came close to outweighing the things indexing gets right: costs near zero, no stock-picking mistakes, no performance-chasing, and the behavioral discipline of a plan you don’t touch. The drags on the typical active fund — higher fees, higher turnover, and the long record of most of them underperforming their benchmark — are far larger than the toll a broad index fund pays at reconstitution.
If you want to be precise about minimizing even the small remaining cost, the levers are unglamorous and familiar: prefer broad total-market or large-cap index funds over narrow thematic ones; don’t assume a fund’s headline expense ratio is the only cost it carries (reconstitution and trading frictions are real, if usually tiny); and, as always, judge a fund on long-run after-cost tracking, not on the sticker fee alone. None of that is a reason to abandon indexing. It’s a reason to understand it.
The Accounting, Actually Done
That section calls itself the honest accounting and then stops one step short of it, settling for “on the order of a rounding error per reshuffle.” The figures needed to replace that phrase with a number are already above, in three different sections that never meet. Putting them together takes only arithmetic.
Start with a fact the article states twice without ever using it: a reshuffle is a pair of trades. One company comes in and another goes out, and the fund is on the wrong side of both — buying the stock that has already popped, selling the stock that has already fallen. The addition figures and the deletion figures appear four paragraphs apart and are never added together.
The round trip. The adverse move across both legs of one swap, from the article’s own Greenwood and Sammon figures.
| Era | Addition | Deletion | Round trip |
|---|---|---|---|
| 1990s | +7.4% | −16.1% | 23.5 points |
| Past decade | +0.3% | −0.6% | 0.9 points |
Twenty-three and a half points of adverse move per swap, down to nine-tenths of a point — a paired trade 26.11 times cheaper than it was. That is a larger collapse than either leg shows on its own, and it is the number that describes what a reshuffle actually costs, because a reshuffle is never one-sided.
The Fade Was Proportional, Not Absolute
The article notes that both directions faded “roughly at the same time” and leaves “roughly” undefined. It is worth defining, because the two legs look nothing alike until you pick the right measure.
Two very different declines that are almost the same decline. In points they are far apart; in proportion they are nearly identical.
| Side | 1990s | Recent | Fall in points | Fall in percent |
|---|---|---|---|---|
| Addition | 7.4% | 0.3% | 7.1 | 95.946% |
| Deletion | 16.1% | 0.6% | 15.5 | 96.273% |
Measured in points, the deletion effect fell 2.183 times as far as the addition effect — 15.5 points against 7.1. Measured in proportion, the two are 0.327 of a percentage point apart. The deletion side shrank by a factor of 26.83 and the addition side by 24.67. Whatever competed the toll away scaled it down rather than subtracting a fixed amount from it, which is what you would expect if the cause was competition for a proportional opportunity rather than a change in any one mechanism.
The same arithmetic settles a question the article raises and does not resolve — whether the fade moved where the cost sat. It did not. Deletions were 2.176 times as damaging as additions in the 1990s and 2.000 times as damaging in the recent period. The toll got far smaller and kept almost exactly the same shape.
Now the Number the Section Promised
A pop is a move in one stock, and an index fund holds that stock only at its index weight, so the cost to a holder is the pop multiplied by the weight. That multiplication has a tidy form: at a 1% index weight, the cost in basis points is equal to the pop in percent. A 7.4% pop on a 1%-weight addition costs the fund 7.4 basis points; a 0.3% pop costs 0.3.
The article supplies one real weight — Tesla at roughly 1.3% — and it is deliberately the wrong weight to generalize from, because the article also says Tesla was the largest company ever added to the index. Used as an upper bound, though, it answers the question exactly.
One addition, at the largest entry weight the index has ever seen. An upper bound on a single event, not an annual figure.
| Era | Pop | Weight | Cost | Per $10,000 |
|---|---|---|---|---|
| 1990s | 7.4% | 1.3% | 9.62 bp | $9.62 |
| Past decade | 0.3% | 1.3% | 0.39 bp | $0.39 |
So the toll at its historical worst, on the biggest addition the index has ever absorbed, was about $9.62 per $10,000 held — and today the same event costs about 39 cents. “A rounding error per reshuffle” turns out to be a fair description, and now it is a fair description with a figure behind it. A typical addition enters at a small fraction of Tesla’s weight, so both numbers are ceilings; and because the article gives no count of index changes per year, no annual figure is derived here and none should be inferred from these.
One last division, because the article states the scale repeatedly in words and never resolves it. Tesla entered at 1.3% of the index and forced funds to sell about $51 billion of everything else to make room. Buying to a 1.3% weight means selling 1.3% of everything you hold, so those two figures imply roughly $3.923 trillion tracking the index on that date. That is the money the whole article is about: large enough that a fifth of a percent of adverse move is a serious sum in aggregate, and small enough per holder that it never showed up on anyone’s statement.
Method and limits, so this can be checked rather than taken on trust. Every input is a figure this article already publishes — the +7.4% and +0.3% addition returns, the 16.1% and 0.6% deletion returns, Tesla’s 1.3% entry weight and the roughly $51 billion of forced selling — and nothing was brought in from outside it. Every cell was recomputed in code, which checks each published figure quoted above before it reports anything. This is arithmetic on reported averages, not a measurement: the abnormal returns are averages across many events with wide variation around them, so no single reshuffle cost exactly these amounts. The round-trip row adds two separately measured averages and inherits both of their uncertainties. The Tesla-weight rows are an explicit upper bound and are labeled as such. No market data was used and no fund was tested; these are historical averages the article already reports, not a projection of what any fund will pay next.
The Failure Mode, Named Plainly
Every style has a failure mode, and honesty means naming this one even though it turned out to be mild. Indexing hands the market a script: here is exactly what I will buy, and roughly when, and I will do it regardless of price. That scriptedness is mostly a feature — it’s the thing that keeps you from panic-selling in a crash or chasing a hot stock at the top, and that behavioral protection is worth far more than the toll ever cost. But it is also, precisely, the vulnerability: a price-insensitive, predictable buyer is the easiest counterparty in the world to trade against. For decades, faster players did exactly that. The reason it stopped working is not that indexing got less scripted — it’s that the people exploiting the script multiplied until they competed away their own edge.
I have watched this play out more than once — Amazon joining the Dow in early 2024, Nvidia replacing Intel in it later the same year, and a run of S&P 500 additions before those. What stayed with me each time was the sequence. The move does not begin when the announcement lands. It begins earlier, among whoever sits high enough in the information chain to be positioned before the rest of us read anything. By the time the headline exists, the institutions that must hold the name are buying because a mandate requires it rather than because they judge it cheap, and everyone else is buying the headline itself. Standing at the end of that queue is not an edge; it is the cost being described in this article, viewed from the other side. The index effect was never a signal you could act on — it is a description of who was already there.
The Summary
The index effect was the price index-fund holders paid for the one thing that makes indexing work — a mechanical, public, rules-based approach that forces the fund to trade on cue. When a stock joined the S&P 500 it used to pop about 7% in the 1990s; when it was dropped it fell about 16%; and if you held the fund, you were on the losing side of that trade without ever seeing it. Over the past decade the effect faded to near zero for big liquid indexes, because the market learned to supply the forced demand and competed the toll away — a rare, watchable example of an inefficiency being arbitraged into the ground. The mechanical trading behind it is still enormous, so the cost isn’t truly zero, and it’s larger in thin or narrow indexes. But for the broad, cheap index fund most people should own, this is a solved problem — one worth understanding precisely so you can tell the difference between the version of indexing that works beautifully and the narrow, exotic version where the old costs still lurk.
Keep Going
- Total Market vs S&P 500 Index Funds: Does the Difference Matter? — which index to track, and why broader usually means calmer reconstitution.
- Expense Ratios Explained: Why 0.1% vs 1% Matters More Than You Think — the visible cost of a fund, alongside the invisible ones this piece is about.
- VTI vs VOO: Which Benchmark ETF Should You Hold for Life? — two of the broadest, deepest index funds there are — the opposite end from the narrow products where the index effect still bites.
- How to Build a 3-Fund Portfolio (And Why It Works) — the boring, broad, low-cost approach that sidesteps most of what this article warns about.
- Dollar-Cost Averaging: The Evidence, the Math, and the Limits — the behavioral half of why mechanical, scripted investing beats improvising.
If you want the plain-English, evidence-first read on investing — including the small hidden costs most guides skip — that’s what the newsletter is for. Subscribe below.
Disclaimer: This article is educational content, not financial advice. I am not a licensed financial advisor, and nothing here is a recommendation to buy or sell any security or asset. Investing and trading involve risk, including the possible loss of the money you invest. Do your own research and consider consulting a licensed financial professional before making investment decisions. Read the full Disclaimer.
Historical and backtested results are hypothetical, carry inherent limitations, and do not guarantee future results. Figures were accurate to the best of my knowledge as of this article’s last-updated date and may have changed.
