Factor Investing Explained: Value, Momentum, Quality, and Size
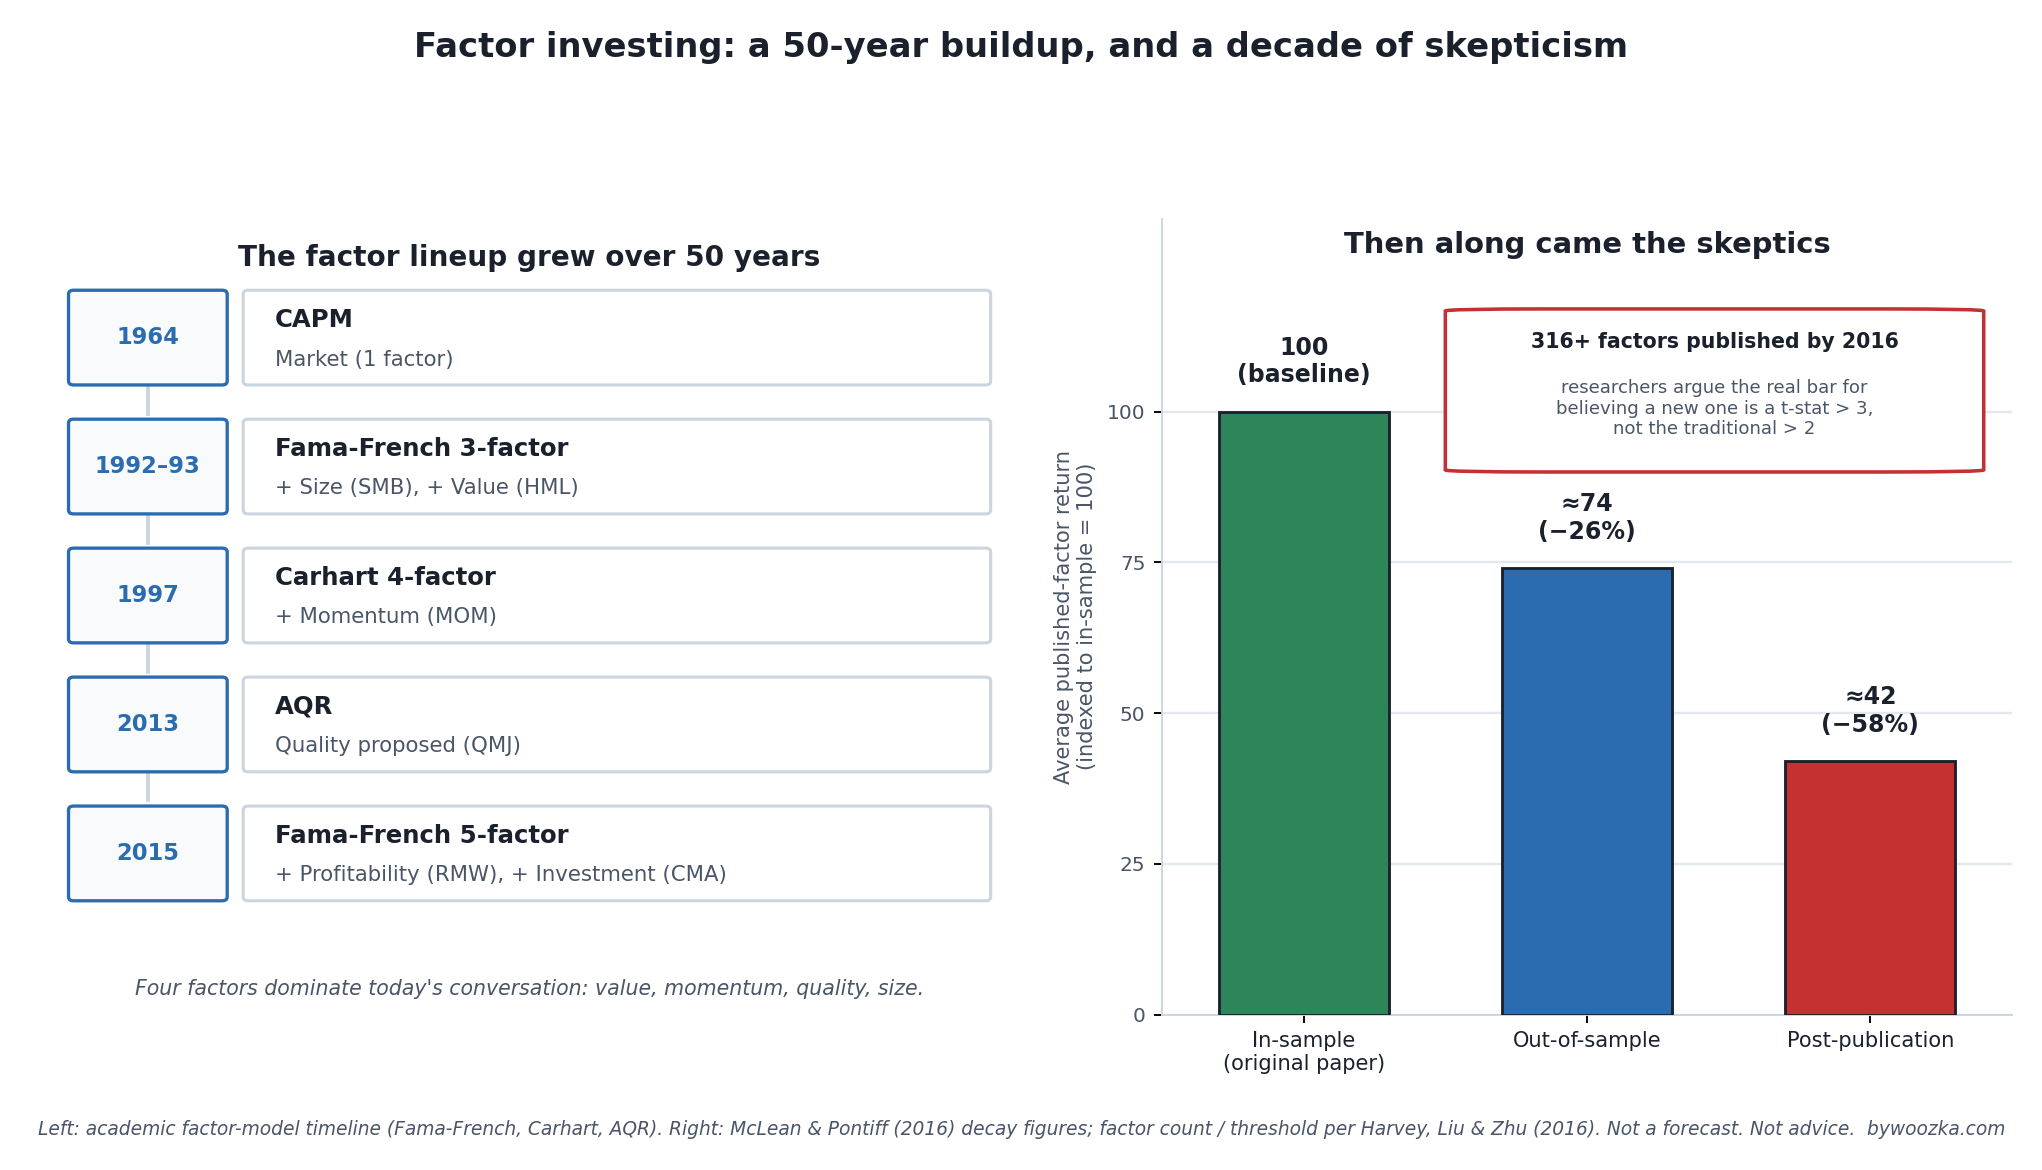
The list of “factors” that supposedly explain why some stocks beat others has grown for 50 years — and a separate, equally serious body of research has spent the last decade explaining why you should be skeptical of most of that list. Illustrative summary of published findings, not a forecast and not advice.
If you’ve read what a P/E ratio is and growth vs value investing, you’ve already met two “factors” without the label. This article puts the label on, zooms out to the whole framework academics and fund managers call factor investing, and — because this is the point most factor-investing content skips — spends real time on the uncomfortable second half of the story: a large and growing body of research suggesting that many published factors may not be real at all. If you haven’t opened a brokerage account yet, start with the pillar for this section, How to Open Your First Brokerage Account; this piece assumes you already own real stocks or funds and want to understand the debate around why certain slices of the market have historically outperformed others.
What a “Factor” Actually Is
A factor, in the academic sense, is a measurable characteristic of a stock that’s been associated with a persistent difference in average returns — not a story about a specific company, but a property shared by many companies (being cheap relative to earnings, or having recently gone up in price, or having strong profitability) that shows up across large samples and long time periods.
The framework traces back to the Capital Asset Pricing Model (CAPM) of the 1960s, which explained stock returns with a single factor: exposure to the overall market. That single-factor world didn’t last. In two landmark papers published in 1992 and 1993, Eugene Fama and Kenneth French showed that a stock’s size (small companies vs. large) and its value characteristics (cheap vs. expensive, measured by book-to-market) explained differences in average returns that the single-market-factor CAPM missed entirely — the Fama-French three-factor model [source: Corporate Finance Institute, “Fama-French Three-Factor Model”]. It became one of the most cited frameworks in financial economics, and it’s the direct ancestor of the “factor investing” industry that exists today.
It didn’t stop at three. In 1997, Mark Carhart added a fourth factor — momentum — to build the Carhart four-factor model, most famous for showing that most mutual-fund manager “skill” could be explained away once momentum was accounted for [source: Carhart, “On Persistence in Mutual Fund Performance,” Journal of Finance, 1997]. In 2013, a team at AQR Capital formalized a quality factor. And in 2015, Fama and French themselves expanded their original model into a five-factor model, adding profitability and investment patterns [source: Springer, “The Fama-French Five-Factor Model Plus Momentum,” summarizing the 2015 model]. The featured graphic’s left panel lays out that 50-year buildup. Four factors dominate the conversation today: value, momentum, quality, and size — the four in this article’s title.
Value: Cheap Relative to Fundamentals
The growth vs value article covers this one in depth, so here’s the factor-framework version: value stocks — cheap relative to earnings, book value, or cash flow — have historically outperformed expensive ones by a premium that Fama and French’s own data puts at roughly 3% to 5% a year, though the number varies enormously by period and the premium’s post-2007 “lost decade” is a real, well-documented reversal [source: Alpha Architect, summarizing Fama-French HML data]. The core lesson that carries over to the rest of this article: value is a genuine, decades-old academic finding — and it still went through a period long enough to make its believers question everything.
Momentum: Winners Keep Winning (Until They Don’t)
Momentum is the tendency for stocks that have gone up over the past several months to keep going up, and stocks that have gone down to keep going down — the “winners keep winning” effect the factor-ETF industry now sells as a systematic strategy.
The landmark study is Jegadeesh and Titman (1993), “Returns to Buying Winners and Selling Losers,” which tested strategies of buying stocks that had risen over the prior 3 to 12 months and selling stocks that had fallen over the same window, then holding those positions for another 3 to 12 months. Every one of the 16 formation-and-holding-period combinations they tested produced positive average returns, with buying past winners and selling past losers generating a compounded excess return of about 12% a year [source: Jegadeesh & Titman, “Returns to Buying Winners and Selling Losers,” Journal of Finance, 1993]. This was a genuinely awkward finding for market efficiency: past prices, on their own, appeared to predict future returns.
Momentum is also the factor with the scariest tail risk of the four, and it’s worth spending real time on because “systematic strategy with strong average returns” undersells what can happen. Momentum strategies are built by going long recent winners and short (or underweighting) recent losers — which means that when the market crashes and then violently rebounds, a momentum portfolio can be caught holding exactly the wrong positions, having sold the beaten-down stocks right before they snapped back hardest. Kent Daniel and Tobias Moskowitz documented this precisely in their paper “Momentum Crashes”: momentum’s crashes are concentrated in “panic” periods — following market declines, when volatility is high — and are contemporaneous with sharp market rebounds, with the two clearest historical examples occurring around the Great Depression and the 2008–09 financial crisis [source: Daniel & Moskowitz, “Momentum Crashes,” Journal of Financial Economics, 2016; NBER Working Paper 20439]. The 2009 episode is the textbook case: as global markets staged their violent rebound off the financial-crisis lows, momentum portfolios that had spent the crisis short beaten-down, high-beta stocks were suddenly short exactly the stocks that rallied hardest — inflicting steep, fast losses in a matter of weeks, even though momentum’s long-run average return over the full sample remained strongly positive [source: Daniel & Moskowitz, 2016].
That combination — a real, persistent long-run premium, sitting on top of the risk of a sudden, sharp, and specifically mistimed crash — is why momentum gets flagged as the highest-risk of the four mainstream factors, and why professional implementations increasingly try to actively manage or hedge that crash risk rather than run a static long-past-winners strategy untouched [source: Daniel & Moskowitz, 2016].
Quality: Boring, Profitable, Well-Run Companies
Quality is the newest of the four factors to get a widely cited academic label. In a 2013 paper (later published and continually updated), Clifford Asness, Andrea Frazzini, and Lasse Pedersen of AQR Capital defined a quality-minus-junk (QMJ) factor: going long stocks that are safe, profitable, growing, and well-managed, and short stocks that lack those characteristics [source: Asness, Frazzini & Pedersen, “Quality Minus Junk,” AQR/SSRN]. Their central, slightly odd finding is that high-quality stocks do trade at somewhat higher prices on average — but not by nearly enough to erase the advantage, which is why a long-quality/short-junk portfolio has historically produced meaningfully positive risk-adjusted returns: about 0.66% a month in the U.S. sample and 0.45% a month globally, with an information ratio above 1 across 24 countries studied [source: AQR, “Quality Minus Junk”]. Put simply: the market doesn’t fully price in “this is a well-run, profitable, safe business,” and that gap has historically been a source of return.
Quality is also the factor most often pitched as defensive — the idea being that boring, profitable, low-debt businesses hold up better when markets get rough, which is part of why quality-factor ETFs are frequently marketed as a smoother ride rather than a higher-octane bet. That defensive framing is a reasonable characterization of the underlying companies; it is not a guarantee that a quality-factor fund won’t lose money in a bad year for stocks generally.
Size: The Original Factor, and the One That’s Struggled Most Lately
Size — the tendency for small companies to outperform large ones — is the oldest of the group, documented by economist Rolf Banz in 1981, who found small-cap U.S. stocks outperforming large caps by roughly 2 to 3 percentage points a year from 1926 to 1975 [source: Banz (1981), via Verdad Capital / academic literature reviews]. It’s covered in more depth, with the more recent performance data, in Total Market vs S&P 500 Index Funds — the short version for this article is that the size premium has been the least reliable of the four in recent decades, with large caps actually outperforming small caps by a meaningful margin from 2010 through 2024. Even Dimensional Fund Advisors, the asset manager most closely associated with commercializing factor investing, has publicly acknowledged that the raw size premium has been statistically weak in recent decades. Size is the clearest illustration in this whole article of a pattern that shows up across every factor to some degree: a real, published historical premium that then goes quiet — sometimes for a very long time — after everyone learns about it.
The Skeptic’s Case: Welcome to the “Factor Zoo”
Here is the part of factor investing that most explainer content leaves out, and it’s the reason this article is filed as advanced, not beginner: a serious and influential strand of academic finance argues that most published return factors are probably not real.
The clearest statement of the problem is Campbell Harvey, Yan Liu, and Heqing Zhu’s paper “…and the Cross-Section of Expected Returns,” which cataloged at least 316 factors that academic papers had claimed predicted stock returns [source: Harvey, Liu & Zhu, Review of Financial Studies 29, 2016]. Their argument is a statistics problem, not a market-mechanics one: the traditional bar for “this factor is statistically significant” is a t-statistic above 2.0 — but that threshold assumes you tested one hypothesis. When hundreds of researchers, across decades, have effectively tested hundreds of overlapping ideas on largely the same historical dataset, some fraction of them will clear a t-statistic of 2.0 by pure chance alone. Harvey, Liu, and Zhu’s conclusion: given how much testing has actually occurred, the credible bar for a genuinely new factor should be closer to a t-statistic above 3.0, not 2.0 — which would disqualify a large share of the published “discoveries” [source: Harvey, Liu & Zhu, 2016].
A companion finding makes the same point from a different angle. McLean and Pontiff (2016) studied 97 return-predicting variables from published academic studies and asked a direct question: does the return actually persist once the paper is out and traders can act on it? Their answer, quantified: the average factor’s return runs about 26% lower out-of-sample (tested on data outside the original study’s window) and about 58% lower after publication (once the finding is public and investors can trade against it), for an overall post-publication decay of roughly 50% [source: McLean & Pontiff, “Does Academic Research Destroy Stock Return Predictability?,” Journal of Finance, 2016]. The featured chart’s right panel shows exactly this arithmetic: 100 (in-sample, the number in the original paper) shrinks to roughly 74 out-of-sample and roughly 42 post-publication.
Put the two findings together and the honest picture of “factor investing” looks less like a settled list of four proven premiums and more like a long list of candidates, a fair number of which were probably statistical noise dressed up as a discovery, and even the real ones tend to shrink once everyone knows about them. This is, notably, the exact same statistical trap covered in What Is Overfitting in Backtesting — the “factor zoo” is the stock-picking-research version of the same overfitting problem that shows up when someone tests hundreds of trading-indicator combinations against the same historical data and calls the best one a “strategy.” The math of multiple testing doesn’t care whether you’re mining for factors or mining for indicators.
None of this means value, momentum, quality, and size are fake. All four have theoretical stories (risk compensation, behavioral biases, or both) that predate and don’t depend solely on the statistical mining problem, and all four have been re-tested out-of-sample and in other countries with at least partial success. It means the honest confidence level on any individual factor is lower than a clean, single backtested number makes it look — and it’s a good reason to be skeptical of factor claims that aren’t among the handful with the longest, most independently replicated track records.
The Four Premiums on One Scale, and What the Decay Does to Them
The section above ends on a claim it never checks against its own pages: that every one of these four factors “has weakened from its original published magnitude, per the McLean-Pontiff figures.” Those figures are right there — 26% lower out of sample, 58% lower after publication — and the featured chart applies them, but only to an abstract index that starts at 100. The four premiums this article spent four sections establishing are never put through the same arithmetic. Doing it turns out to require one step first, and that step produces the more surprising result.
One of These Four Is Not in the Same Unit
Three of the four premiums above are quoted per year. Quality’s is quoted per month. Both conventions are faithful to how the underlying papers report their results, and neither is an error — but it does mean the four headline numbers on this page cannot be read against each other as printed, which is exactly what a list of four factors invites you to do.
| Factor | As printed | Per year | Rank |
|---|---|---|---|
| Momentum | 12% a year | 12.00% | 1 |
| Quality (US) | 0.66% a month | 8.21% | 2 |
| Quality (global) | 0.45% a month | 5.54% | 3 |
| Value | 3-5% a year | 3-5% | 4 |
| Size | 2-3 pts a year | 2-3% | 5 |
Read as printed, 0.66% is the smallest number anywhere in this article. Annualized, it is the second largest premium the article reports. Nothing about the finding changed; the unit did, and it moved the figure by a factor of 12.45.
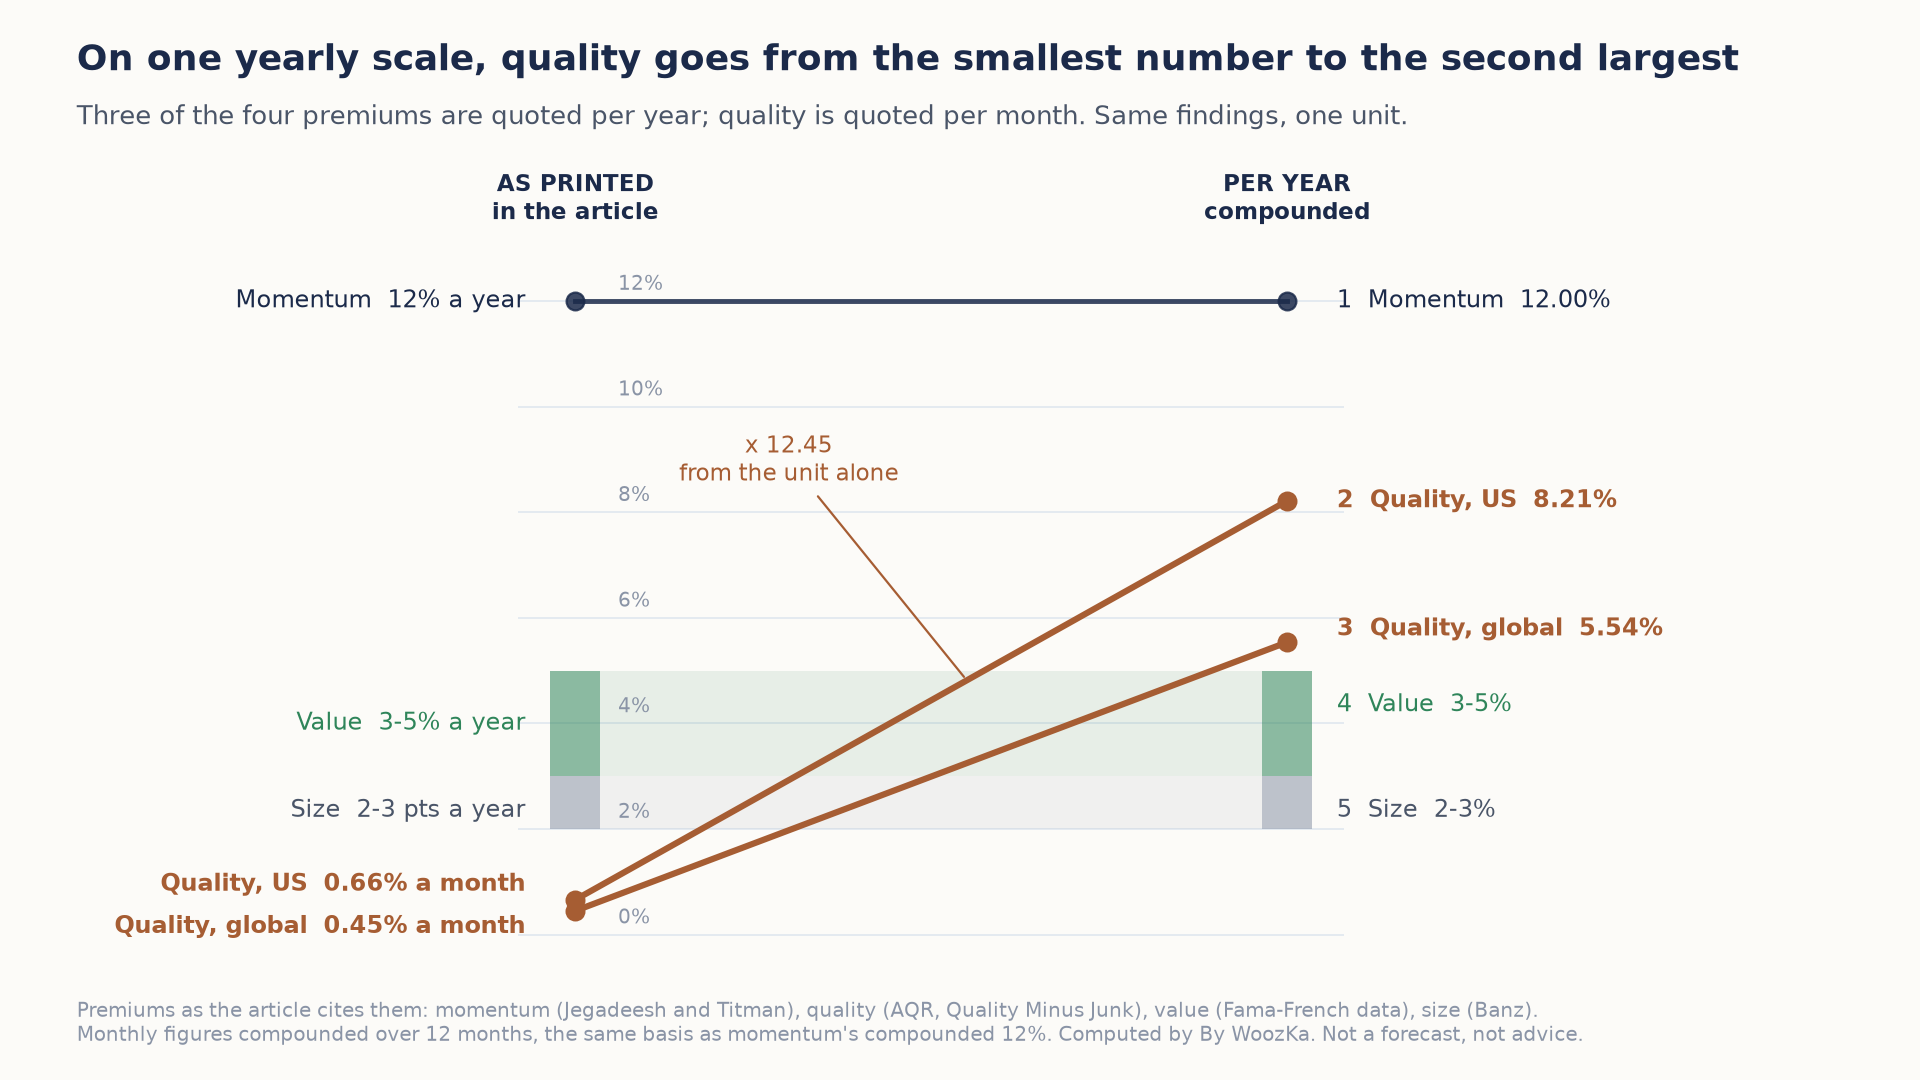
Quality’s premium is quoted per month and the other three per year, so the list can’t be read straight down. On one yearly scale, quality moves from the smallest number on the page to the second largest, and the finding itself doesn’t change at all.
The rank change survives both ranges, which is what makes it more than a rounding curiosity. At 8.21% the US quality premium clears the top of the value range and the top of the size range, while at 0.66% it sits below the bottom of both. Even the global figure, 5.54%, edges past value’s best case of 5%. And the article itself settles which annualization is the fair one: it describes momentum’s 12% as a compounded excess return, so the like-for-like treatment of a monthly figure is the compounded one, 8.21%, rather than the simple twelve-times reading of 7.92%.
The Shrinkage, Applied to This Article’s Own Numbers
With the four on one scale, the McLean-Pontiff multipliers can do the work the article promises them for. Out-of-sample keeps 74% of the published premium; post-publication keeps 42%. These are the same two numbers behind the chart’s 100, 74 and 42.
| Factor | Published | Out of sample | After publication |
|---|---|---|---|
| Momentum | 12.00% | 8.88% | 5.04% |
| Quality (US) | 8.21% | 6.08% | 3.45% |
| Quality (global) | 5.54% | 4.10% | 2.32% |
| Value | 3.00-5.00% | 2.22-3.70% | 1.26-2.10% |
| Size | 2.00-3.00% | 1.48-2.22% | 0.84-1.26% |
One row survives the trip almost intact in relative terms: momentum at 5.04% after the full decay still clears the top of the value range as originally published, by 0.04 points. The strongest factor after its haircut is roughly where the second-strongest started before any haircut at all.
The more useful observation is about what this decay cannot tell you. It enters as a single multiplier, so it scales every premium by the same amount — which means it preserves every ratio between them exactly. Momentum is 6.000 times the low end of size before the decay and 6.000 times it afterward, to as many decimals as you care to carry. The factor-zoo research is a strong reason to expect less from all four; it contains no information whatsoever about which of the four to prefer. What it does change is the size of the prize for choosing well: the gap between the best and worst premium on this page narrows from 10.00 points to 4.20, shrinking by the same 58% as everything else.
Where the Shrinkage Actually Happens
The article reports the two decay figures in one sentence and the two are not measured from the same place — both are cuts from the original published finding, not one from the other. Laying the chart’s three levels out with the step between them made explicit separates what the research is actually saying.
| Stage | Index | Cut | Share of decline |
|---|---|---|---|
| Original finding | 100.0 | — | — |
| Re-tested out of sample | 74.0 | -26.00% | 44.83% |
| After publication | 42.0 | -43.24% | 55.17% |
The total decline is 58% of the original, not the 32-point difference between the two published percentages — and the two stages have different causes. The first 44.83% of the damage was already present before anyone outside the study could act on it: the original sample flattering the finding. That is a statistics problem, and it is the factor zoo. The remaining 55.17% arrived only after the result was public and investors could trade against it. That is an arbitrage problem, and it is a different objection entirely.
So slightly more than half of a typical factor’s decay is arbitrage and slightly less than half is statistics — which is what this article’s “roughly 50%” is reaching for. That phrase sits in the same sentence as the 58% figure and the two measure different quantities, which is worth separating because the second stage is the harsher of the two: a 43.24% cut against 26.00%, or 1.663 times as severe. On these numbers, being published costs a factor more than being re-tested on fresh data does.
Underneath every number above: inputs, code and assumptions. Every figure above was computed in code whose only inputs are numbers this article already publishes, and both annualizations are reproduced to nine decimal places by the shipped code behind this site’s compound growth calculator. The 26% and 58% are McLean and Pontiff’s averages across 97 published variables; applying them uniformly to four named factors is this article’s own framing, and real factors decayed by different amounts, so the second and third tables illustrate the article’s stated claim rather than measuring any individual factor. No market data was used, nothing here is a forecast, and no allocation to any factor is suggested or implied. This article’s own arithmetic was recomputed and confirmed correct: 26% and 58% off 100 do give the chart’s 74 and 42, a 3-to-12-month formation window against a 3-to-12-month holding window at quarterly steps does give exactly 16 combinations, and Banz’s 1926-to-1975 sample is 50 years.
Can You Actually Invest in These Factors?
Yes — this is where “factor investing” stopped being an academic curiosity and became a retail product category, generally marketed as “smart beta” ETFs: rules-based funds that systematically tilt toward one or more of these characteristics instead of weighting every stock by market capitalization. As of the end of February 2024, ETFGI — an independent research firm that tracks the global ETF industry — counted 1,330 smart-beta equity ETFs listed globally, holding roughly $1.56 trillion in assets across 204 providers on 48 exchanges in 38 countries, figures that move constantly with markets and flows and should be confirmed current before citing again [source: ETFGI, press release, March 2024].
Concretely, that means there are funds built to track something close to each factor in this article — for example, at different points funds like the iShares MSCI USA Quality Factor ETF (QUAL), the Invesco S&P 500 Momentum ETF (SPMO), the JPMorgan US Momentum Factor ETF (JMOM), and style funds like the Vanguard Value ETF (VTV) and Vanguard Growth ETF (VUG) have appeared among the largest and most actively traded smart-beta products [source: ETFGI, March 2024 press release, “Top 20 Smart Beta ETFs by net new assets”]. These are named here only as labeled examples of how factor exposure is packaged as a product — not a recommendation to buy any of them. Fund lineups, methodologies, fees, and rankings change constantly; confirm the current provider, expense ratio, and factor-construction methodology directly with the fund before considering anything.
So Should You Tilt Toward a Factor?
This is where the honest answer refuses to be a clean yes or no, on purpose.
A modest tilt is defensible; a concentrated bet is a gamble on a single historical statistic holding up. Every factor covered here has been through long stretches — sometimes a decade or more — of underperforming the broad market, exactly like the growth-versus-value reversals covered in the growth vs value article. If you can’t stomach a factor tilt doing nothing, or actively hurting you, for years at a stretch, a concentrated factor bet isn’t a fit for you regardless of how solid the academic pedigree looks on paper.
Combining factors doesn’t cancel out the uncertainty, but it can reduce the odds of catastrophic timing. Multi-factor funds that blend value, momentum, quality, and size are a common middle-ground product precisely because no single factor has ever been reliably “on” every year, and different factors have historically underperformed in different periods.
The factor-zoo research is a reason for humility, not paralysis. Value, momentum, quality, and size are the four factors with the longest, most independently replicated evidence trails of the roughly 316-plus that have been proposed — that’s exactly why this article covers those four and not the others. But “most replicated” is a relative, not an absolute, claim, and every one of them has weakened from its original published magnitude, per the McLean-Pontiff figures above.
Owning the whole market remains a completely legitimate answer to this entire debate. A broad total-market or S&P 500 index fund already holds a diversified mix of value and growth, large and small, high and low quality, in market proportions — you don’t have to have a view on any of this to be a competent long-term investor. Nothing in this article is a case against the simple broad-index default covered in Total Market vs S&P 500 Index Funds; it’s a map of a debate you’re allowed to skip entirely.
Whatever you decide, the same three guardrails that apply to growth-versus-value apply here: size any tilt so being wrong for a decade is survivable, keep costs low because a factor’s edge is small and uncertain while a fund’s fee is certain, and don’t expect to out-time which factor leads next — professional quantitative researchers with entire academic careers built around this question haven’t solved that part either.
The natural next steps in this section connect directly to what’s above: growth vs value investing is the deepest look at the single most-discussed factor pair, what a P/E ratio is is the valuation tool most factor screens lean on, and how to analyze a company before you buy the stock gives you a framework that sits underneath all of this, factors included. The weekly plain-English newsletter below is where ideas like these get connected over time.
Disclaimer: This article is educational content, not financial advice. I am not a licensed financial advisor, and nothing here is a recommendation to buy or sell any security or asset. Investing and trading involve risk, including the possible loss of the money you invest. Do your own research and consider consulting a licensed financial professional before making investment decisions. Read the full Disclaimer.
Historical and backtested results are hypothetical, carry inherent limitations, and do not guarantee future results. Figures were accurate to the best of my knowledge as of this article’s last-updated date and may have changed.
