How Credit Scores Actually Work: A Data-Driven Breakdown
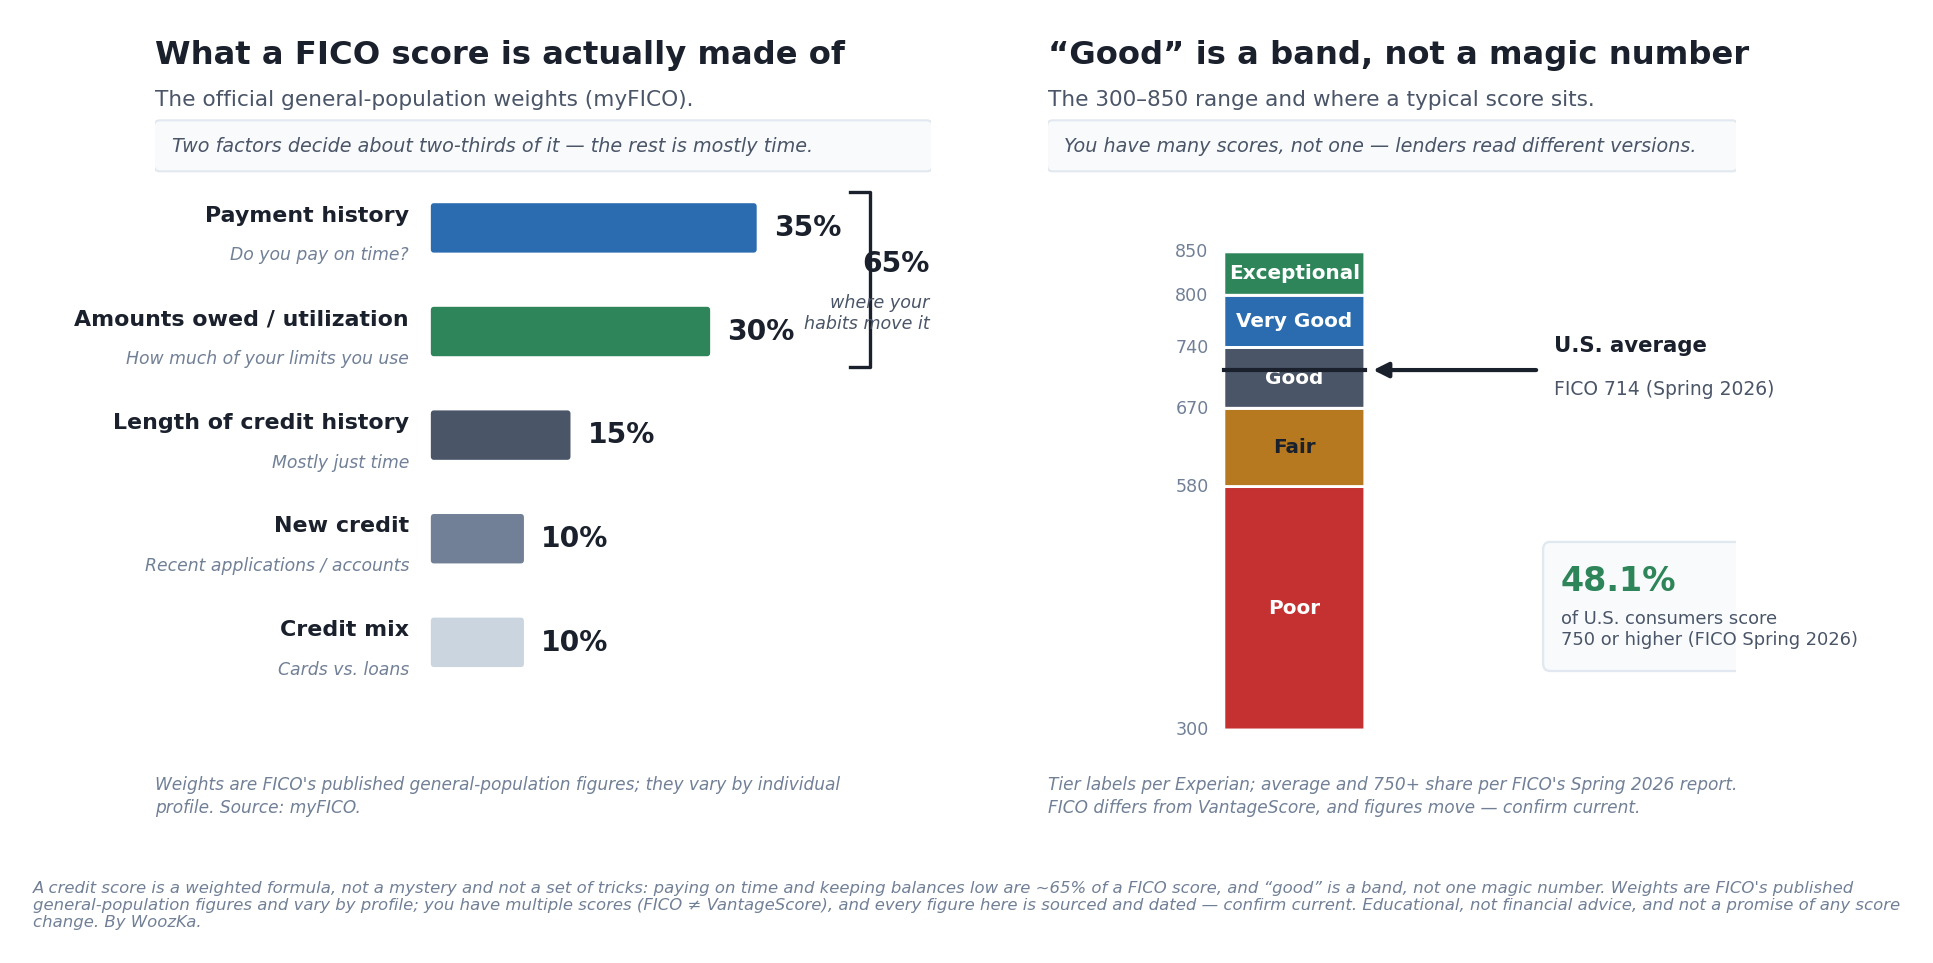
Left: a credit score isn’t a mystery — it’s a weighted formula, and two behaviors (paying on time and keeping balances low) drive roughly 65% of a FICO score; the rest is mostly the passage of time. Right: “good” is a band on the 300–850 scale, not one magic number, with the U.S. average at 714 as of FICO’s Spring 2026 report. Figures are FICO’s general-population data, date-stamped below and subject to change — this is how the score is built, not a target to chase.
“How does a credit score actually work?” gets answered online mostly by people trying to sell you something — a monitoring subscription, a “credit repair” service, or a card. Strip the sales pitch away and the truth is refreshingly boring: a credit score is a weighted formula run on your credit report. It is not a mystery, not a personality test, and — the part the hustle-culture posts get most wrong — not a set of tricks. Two ordinary habits decide about two-thirds of it. Everything else is mostly time.
This is foundational money literacy, not personal financial planning. Nothing here promises you a specific number, a point gain, or a timeline, and nothing tells you which card to get. It explains how the score is defined and calculated — sourced to the companies that build it — so you can understand what actually moves it and stop paying for “hacks” that mostly don’t exist.
Why the Number Matters at All
A credit score exists for one reason: lenders use it to estimate how likely you are to repay, and they price that risk into your interest rate. A higher score generally qualifies you for lower rates on cards, auto loans, and mortgages; a lower score generally means higher rates or a declined application [source: Consumer Financial Protection Bureau and myFICO, “How lenders use credit scores,” 2026]. That’s the whole game, and it’s why this unglamorous three-digit number quietly moves real dollars: the difference between a good and a poor score can be several percentage points of APR on a loan, and — as the companion piece on APR vs APY shows — a few points of APR compounds into serious money over the life of a balance. Understanding the score is the cheapest interest-rate reduction available, because it costs nothing but attention.
The One-Sentence Version
A credit score is a number (for the most common models, on a 300–850 scale) produced by a formula that reads your credit report and weights five kinds of information — most heavily whether you pay on time and how much of your available credit you’re using — to estimate how likely you are to repay borrowed money.
That’s it. The rest of this article unpacks the five inputs, what each one actually rewards, and why the single most important thing to understand is that there isn’t one score at all.
What the Score Is Actually Made Of
The most widely used scores come from FICO, and FICO publishes the general-population weights of its five factor categories. This is the core of the whole topic, so it’s worth seeing the real numbers rather than the vague “pay your bills” advice that usually stands in for them [source: myFICO, “What’s in my FICO Scores,” 2026]:
- Payment history — 35%. Do you pay your accounts on time? This is the single largest factor.
- Amounts owed / credit utilization — 30%. How much of your available credit you’re actually using.
- Length of credit history — 15%. How long your accounts have been open — mostly a function of time.
- New credit — 10%. How many new accounts and applications you’ve had recently.
- Credit mix — 10%. The variety of credit types you manage (revolving cards vs. installment loans).
Add the top two and you get the whole point of the chart: payment history and amounts owed are about 65% of a FICO score. The two things fully within your day-to-day control — paying on time and not maxing out your limits — are where nearly two-thirds of the number is decided. The other 35% is mostly the passage of time, which no “hack” accelerates.
One honest caveat, stated up front: these weights are for the general population. FICO is explicit that the importance of each factor varies by individual profile — for someone with a short history, “length of credit history” carries different weight than for someone with decades of accounts [source: myFICO, 2026]. Treat 35/30/15/10/10 as the shape of the formula, not a personal guarantee.
The Two That Actually Move: Payment History and Utilization
Because these two are ~65% of the score, they deserve most of your attention.
Payment history (35%). The mechanism is simple: the score rewards a long, unbroken record of paying at least the minimum by the due date, and it penalizes missed payments. A payment generally has to be 30 days past due before a lender reports it to the bureaus, so being a few days late and catching up usually doesn’t hit your score — but once a late payment is reported, its damage depends on how recent, how severe, and how frequent it is, and a reported late mark can linger on your report for years [source: myFICO, “Payment history,” 2026]. There is no trick here. The durable move is boring: automate at least the minimum payment on everything so a busy month never becomes a reported late.
Amounts owed / utilization (30%). This factor is dominated by credit utilization — the ratio of your revolving balances to your credit limits. Lower is generally better, because high utilization signals you may be stretched. A widely repeated rule of thumb is to keep utilization “under 30%,” but it’s worth being precise about what that is and isn’t: FICO does not publish a magic threshold or a cliff at 30%, and the “under 30%” figure is a rule of thumb, not a line in the formula. In practice, people with the highest scores tend to use only a small single-digit percentage of their available credit [source: Experian and myFICO, 2026]. Two mechanical facts follow from how it’s measured. First, utilization is usually calculated from the balance reported on your statement, so paying down a balance before the statement closes can lower the number the score sees — not a hack, just how the snapshot works. Second, because it’s a ratio, utilization also falls if your limit rises (all else equal), which is one reason closing an old card can unintentionally raise your utilization by removing available credit.
The Three That Are Mostly Time
The remaining 40% moves slowly and is largely outside daily control.
Length of credit history (15%) looks at the age of your accounts — both your oldest account and the average age across all of them. This is why closing your oldest card can quietly hurt, and why “just get a new card to boost your score” is usually backwards: new accounts lower your average age [source: myFICO, 2026].
New credit (10%) reflects recent applications and newly opened accounts. Applying for several accounts in a short window can look like risk, and each application can trigger a hard inquiry that may shave a few points temporarily. Two important nuances: rate-shopping for a single loan — auto, mortgage, or student — is generally treated as one inquiry when the applications fall within a short window (FICO’s newer models use a 45-day window), so shopping around for the best rate isn’t penalized as if you opened many loans; and checking your own score is a “soft” inquiry that does not affect it at all [source: myFICO, “Credit checks and inquiries,” 2026]. You can look as often as you like.
Credit mix (10%) rewards managing a variety of credit types — say, a card and an installment loan — but it’s the smallest factor and explicitly not a reason to take on debt you don’t need. Opening a loan purely to “improve your mix” usually costs more in interest than it’s worth [source: myFICO, “Credit mix,” 2026].
“Good” Is a Band, Not a Magic Number
People fixate on hitting a specific number, but scores are read in ranges, not exact figures. On the common 300–850 scale, the widely used tier labels are roughly: Poor (below 580), Fair (580–669), Good (670–739), Very Good (740–799), and Exceptional (800–850) [source: Experian tier labels, 2026]. A lender cares which band you’re in, not whether you’re a 742 or a 758.
Where do real scores sit? As of FICO’s Spring 2026 report, the average U.S. FICO Score was 714 — down 2 points from a record high of 716 reached in 2024, the first decline after years of steady increases, which FICO attributed largely to the resumption of student-loan delinquency reporting and a rise in some delinquencies [source: FICO, “FICO Score Credit Insights Report,” Spring 2026 — fico.com; confirm current, these figures are updated periodically]. At the same time, 48.1% of consumers scored 750 or higher, up from 43.3% in 2019 — a reminder that the distribution is wide and, lately, uneven [source: FICO, Spring 2026]. The practical takeaway: you’re aiming to reach and hold a band that qualifies you for good rates, not to chase a perfect 850. Past roughly the mid-700s, additional points rarely change the rate you’re offered.
The Most Important Thing: You Don’t Have One Score
Here is the fact that dissolves most credit-score anxiety and nearly all “credit hacks”: you do not have a single credit score. You have many.
Two things drive that. First, there are multiple score developers — FICO and VantageScore are the two dominant ones — and they use different formulas. Both run on a 300–850 range and read similar report data, but they weight it differently. VantageScore’s 4.0 model, for example, leans even more heavily on payment history and treats some items differently: it can generate a score from as little as one month of history (FICO generally needs about six months and a recently reported account), it factors in rent and utility payments when those are reported, and it uses “trended” data — how your balances move over time — rather than a single snapshot [source: Experian and Britannica Money, “FICO vs. VantageScore,” 2026]. So a FICO score and a VantageScore for the same person on the same day can differ, sometimes meaningfully.
Second, even within FICO there are many versions. FICO has released a series of models over the years — FICO 8 is the most widely used, with newer FICO 9, 10, and 10T models and a set of industry-specific versions tuned for auto or card lending; there are on the order of a dozen-plus FICO versions in active use, and each lender decides which one to pull [source: myFICO, “FICO Score versions,” 2026]. Mortgage lenders, for instance, have long used older versions than the one a free app might show you. This is why the “free score” in your banking app is frequently not the number a given lender sees, and why obsessing over a single displayed figure misses the point.
The liberating consequence: since you can’t optimize for one specific number that a specific lender will use, you optimize the underlying behavior every model rewards — on-time payments, low utilization, a long history left intact, and few unnecessary new applications. Do that, and every version of your score tends to move in the same direction.
Two of those levers can be computed exactly
Most of what you read about credit scores is either a rule of thumb or a guess dressed as a number. But two of the levers above are not opinions at all — they are arithmetic on figures you already have, and both behave in a way that is worth seeing before you act on them.
A note on what is deliberately missing. Nothing below converts into score points, and that is not an oversight. As this article already says, FICO does not publish the function that turns these inputs into a number — so the conversion cannot be calculated, only guessed. Any table that offers you “utilization X costs you Y points” was invented by whoever published it. What follows stops at the input, because the input is the part that is actually knowable.
Closing a card you never use, having spent nothing
Utilization is revolving balances divided by revolving limits. Close a card and the balance does not move — but the limit does, and it is the denominator. The result is that a card you keep in a drawer is doing real work simply by existing:
| Closed card held this share of your total limit | Utilization multiplied by | If you were at 5% | If you were at 15% | If you were at 30% |
|---|---|---|---|---|
| 10% | ×1.111 | 5% → 5.6% | 15% → 16.7% | 30% → 33.3% |
| 20% | ×1.250 | 5% → 6.2% | 15% → 18.8% | 30% → 37.5% |
| 30% | ×1.429 | 5% → 7.1% | 15% → 21.4% | 30% → 42.9% |
| 40% | ×1.667 | 5% → 8.3% | 15% → 25.0% | 30% → 50.0% |
| 50% | ×2.000 | 5% → 10.0% | 15% → 30.0% | 30% → 60.0% |
The striking part is the middle column: the multiplier depends only on the share of your total limit that disappeared, never on what you owe. Closing a card carrying 30% of your limit multiplies utilization by 1.43 whether your balance is $200 or $12,000. Close one holding half your limit and utilization doubles — someone sitting comfortably at 15% lands at 30% without having bought a thing.
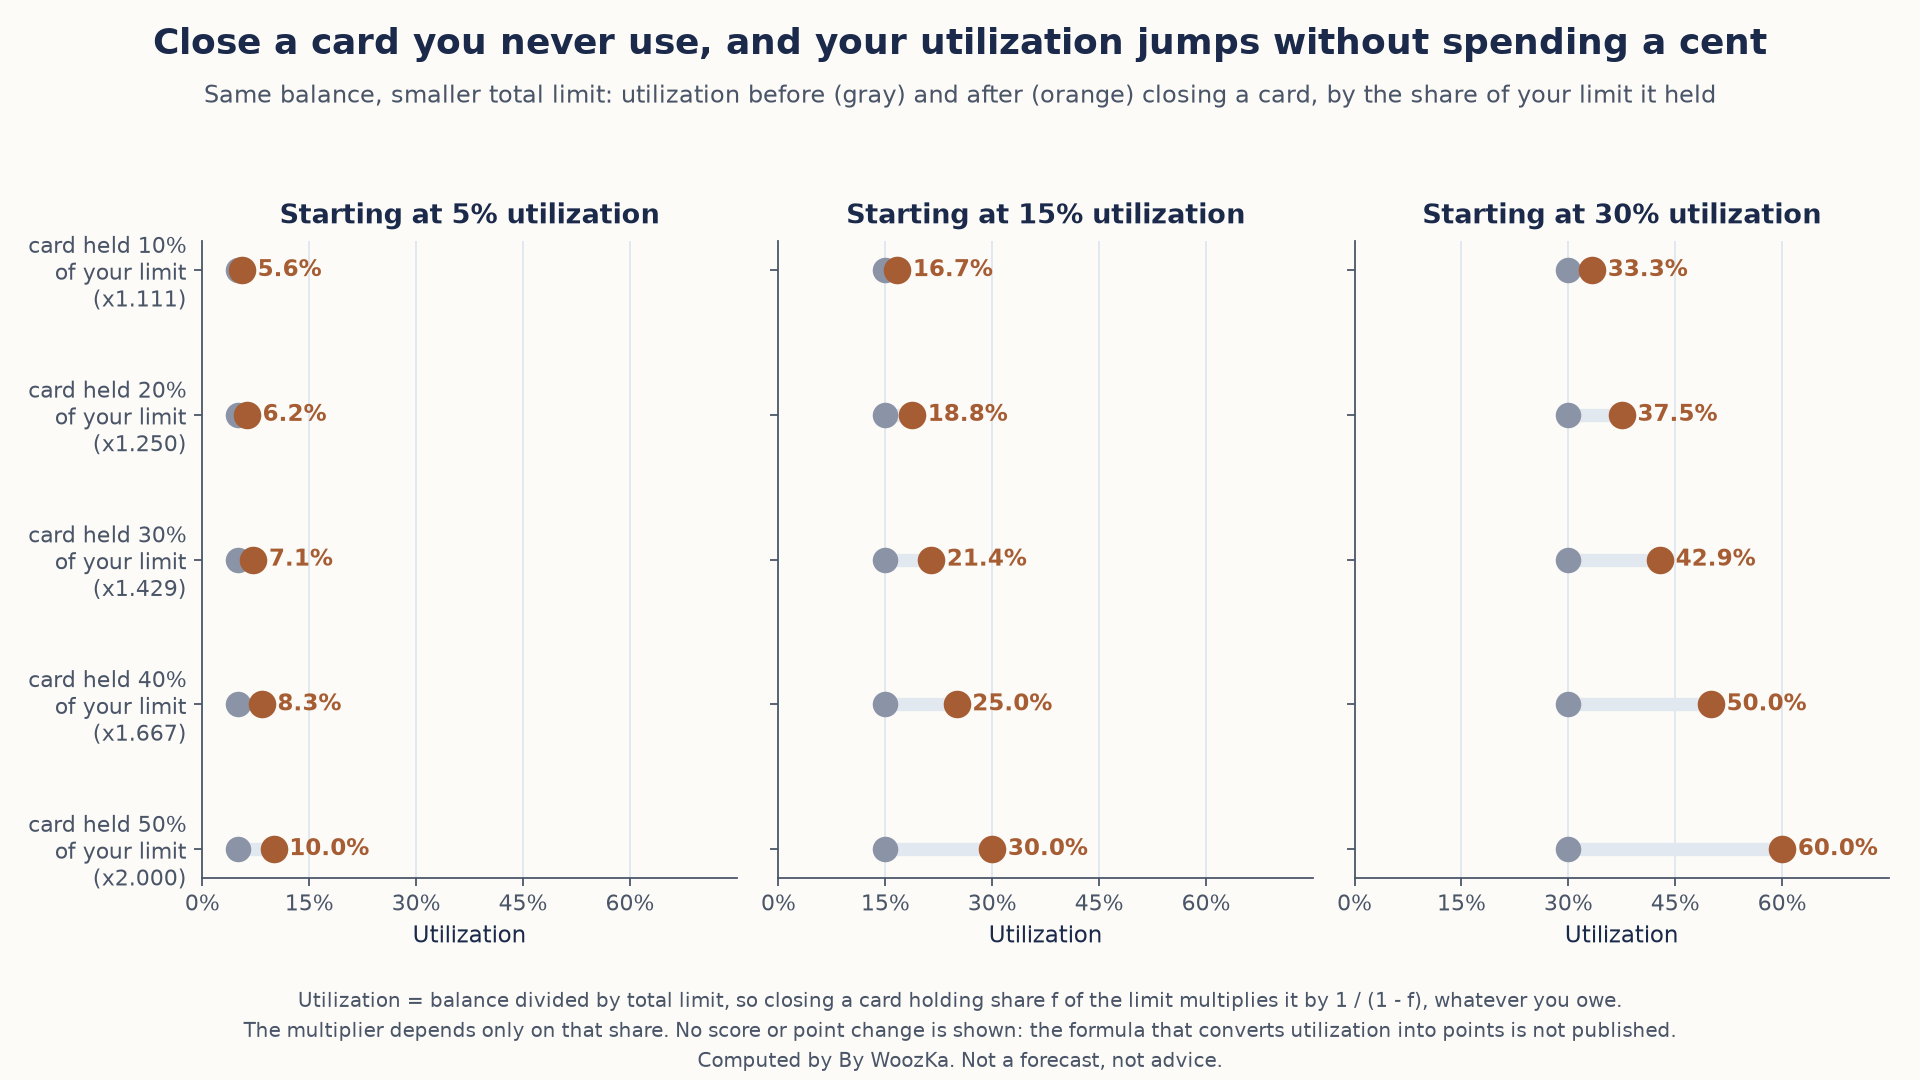
Closing a card changes nothing you owe, only the limit you owe it against. The jump depends on how much of your limit the card held, so a card with half your limit doubles your utilization whatever your balance.
This is the arithmetic behind the article’s advice to keep old accounts open. It is not a superstition about the age of the account; it is that the limit leaves with it.
Opening one new account, and what it does to your average age
The mirror image applies to length of history. Your accounts have some average age; a new account arrives at zero and pulls the mean down. How far depends on a single number — how many accounts you already had:
| Accounts you already have | Average age falls by | If the average was 4 years | If the average was 8 years | If the average was 12 years |
|---|---|---|---|---|
| 2 | 33.3% | 4 yrs → 2.7 yrs | 8 yrs → 5.3 yrs | 12 yrs → 8.0 yrs |
| 3 | 25.0% | 4 yrs → 3.0 yrs | 8 yrs → 6.0 yrs | 12 yrs → 9.0 yrs |
| 4 | 20.0% | 4 yrs → 3.2 yrs | 8 yrs → 6.4 yrs | 12 yrs → 9.6 yrs |
| 5 | 16.7% | 4 yrs → 3.3 yrs | 8 yrs → 6.7 yrs | 12 yrs → 10.0 yrs |
| 8 | 11.1% | 4 yrs → 3.6 yrs | 8 yrs → 7.1 yrs | 12 yrs → 10.7 yrs |
| 12 | 7.7% | 4 yrs → 3.7 yrs | 8 yrs → 7.4 yrs | 12 yrs → 11.1 yrs |
Again the proportional effect is fixed: opening one account cuts your average age by exactly 1 ÷ (accounts + 1), no matter how old those accounts are. With 4 accounts a fifth one costs you 20% of your average age; with 12 accounts the same new card costs 7.7%. A long history is not just valuable in itself — it is what makes the next account cheap.
Which points at something the “should I open a card?” question usually misses. The cost of a new account is not fixed. It is largest for exactly the people most often told to build credit by opening one, because they are the ones with the fewest accounts to average against.
Method, so it can be checked rather than taken on trust: utilization is balance ÷ limit, and closing a card holding share f of the total multiplies it by 1 ÷ (1 − f); average age after adding one account to n accounts of mean age A is A × n ÷ (n + 1), a fall of 1 ÷ (n + 1). The script checks both against explicit simulations in dollars and in individual account ages, and confirms that each effect really is independent of the balance and of the ages. The numbers in both tables are the code’s own output rather than hand-copied values. It contains no score, no point value and no prediction, for the reason given above.
What Actually Moves It (Mechanism, Not Hacks)
Pulling the factors together, the durable, model-agnostic levers are unglamorous and entirely behavioral:
- Pay every account on time, every time (automate the minimum as a floor). This is the 35% factor and the one with the most downside if it slips.
- Keep revolving balances low relative to limits — the lower the better; there’s no magic threshold, and paying before the statement closes lowers the reported figure. This is most of the 30% factor.
- Let your history age — keep old accounts open, especially your oldest, so you don’t shorten your average account age.
- Apply for new credit sparingly and deliberately, and do your rate-shopping for a single loan within a short window so it counts as one inquiry.
- Check your own reports and scores freely — it’s a soft inquiry that never hurts — and dispute genuine errors, since the score is only as accurate as the report underneath it.
Notice what’s not on that list: any promise of a specific point gain, any “raise your score 100 points in 30 days” timeline, or any paid trick. Be openly skeptical of that framing. Legitimate improvement is a byproduct of the habits above playing out over months, not a service you buy. “Credit repair” companies can generally do only what you can do yourself for free — dispute real inaccuracies — and cannot legally erase accurate negative information [source: Consumer Financial Protection Bureau, “credit repair,” 2026].
A 5-Point Sanity Check
Whenever a credit-score claim or worry crosses your path, five questions cut through most of the noise:
- Is this about payment history or utilization? If yes, it’s in the ~65% that matters most — take it seriously. If it’s about credit mix or one hard inquiry, it’s a small factor.
- Which score and version is being quoted? A number means little without knowing whether it’s FICO or VantageScore, and which version.
- Does the “tip” promise a specific point gain or timeline? That’s the tell of a hack or a sales pitch — real movement is a byproduct of habits, not a guarantee.
- Am I in a good band, or chasing a perfect number? Past the mid-700s, more points rarely change your rate.
- Is the underlying report accurate? The score can only be as right as the data beneath it — check your reports and dispute genuine errors yourself, for free.
The Bottom Line
A credit score is a weighted formula, not a mystery and not a set of tricks. Two habits you fully control — paying on time (35%) and keeping balances low relative to your limits (30%) — decide about two-thirds of a FICO score; the rest is mostly the passage of time. “Good” is a band on the 300–850 scale, not a single magic number, and the U.S. average sits at 714 as of FICO’s Spring 2026 report. Most importantly, you don’t have one score — different developers and versions read your report differently — so the winning move isn’t to chase a specific figure but to run the boring, model-agnostic behaviors every formula rewards. Get those right and the number takes care of itself, which quietly lowers the interest rates you’re offered across your whole financial life. It’s the same theme as the rest of this cluster: the plain terminology on your statements is where the money is made or lost, long before you ever pick an investment (see Assets vs Liabilities and Good Debt vs Bad Debt). Understand the economic machine at the top and your own statements at the bottom, and the middle gets a lot easier.
Disclaimer: This article is educational content, not financial advice. I am not a licensed financial advisor, and nothing here is a recommendation to buy or sell any security or asset. Investing and trading involve risk, including the possible loss of the money you invest. Do your own research and consider consulting a licensed financial professional before making investment decisions. Read the full Disclaimer. Historical and backtested results are hypothetical, carry inherent limitations, and do not guarantee future results. Figures were accurate to the best of my knowledge as of this article’s last-updated date and may have changed.
This is the third piece in the money-terminology cluster, after APR vs APY and Emergency Fund Math: once you can read a rate and know how much cash to keep on hand, the next foundation is understanding the three-digit number that sets the price of every rate you’re offered. Still ahead in this cluster: the real cost of carrying a credit-card balance, with the math. For the weekly market read this blog uses — plus the money-foundations checklist that ties APR, emergency-fund sizing, and credit together — subscribe to the newsletter below.
