How Banks Actually Create Money (It’s Not What You Think)
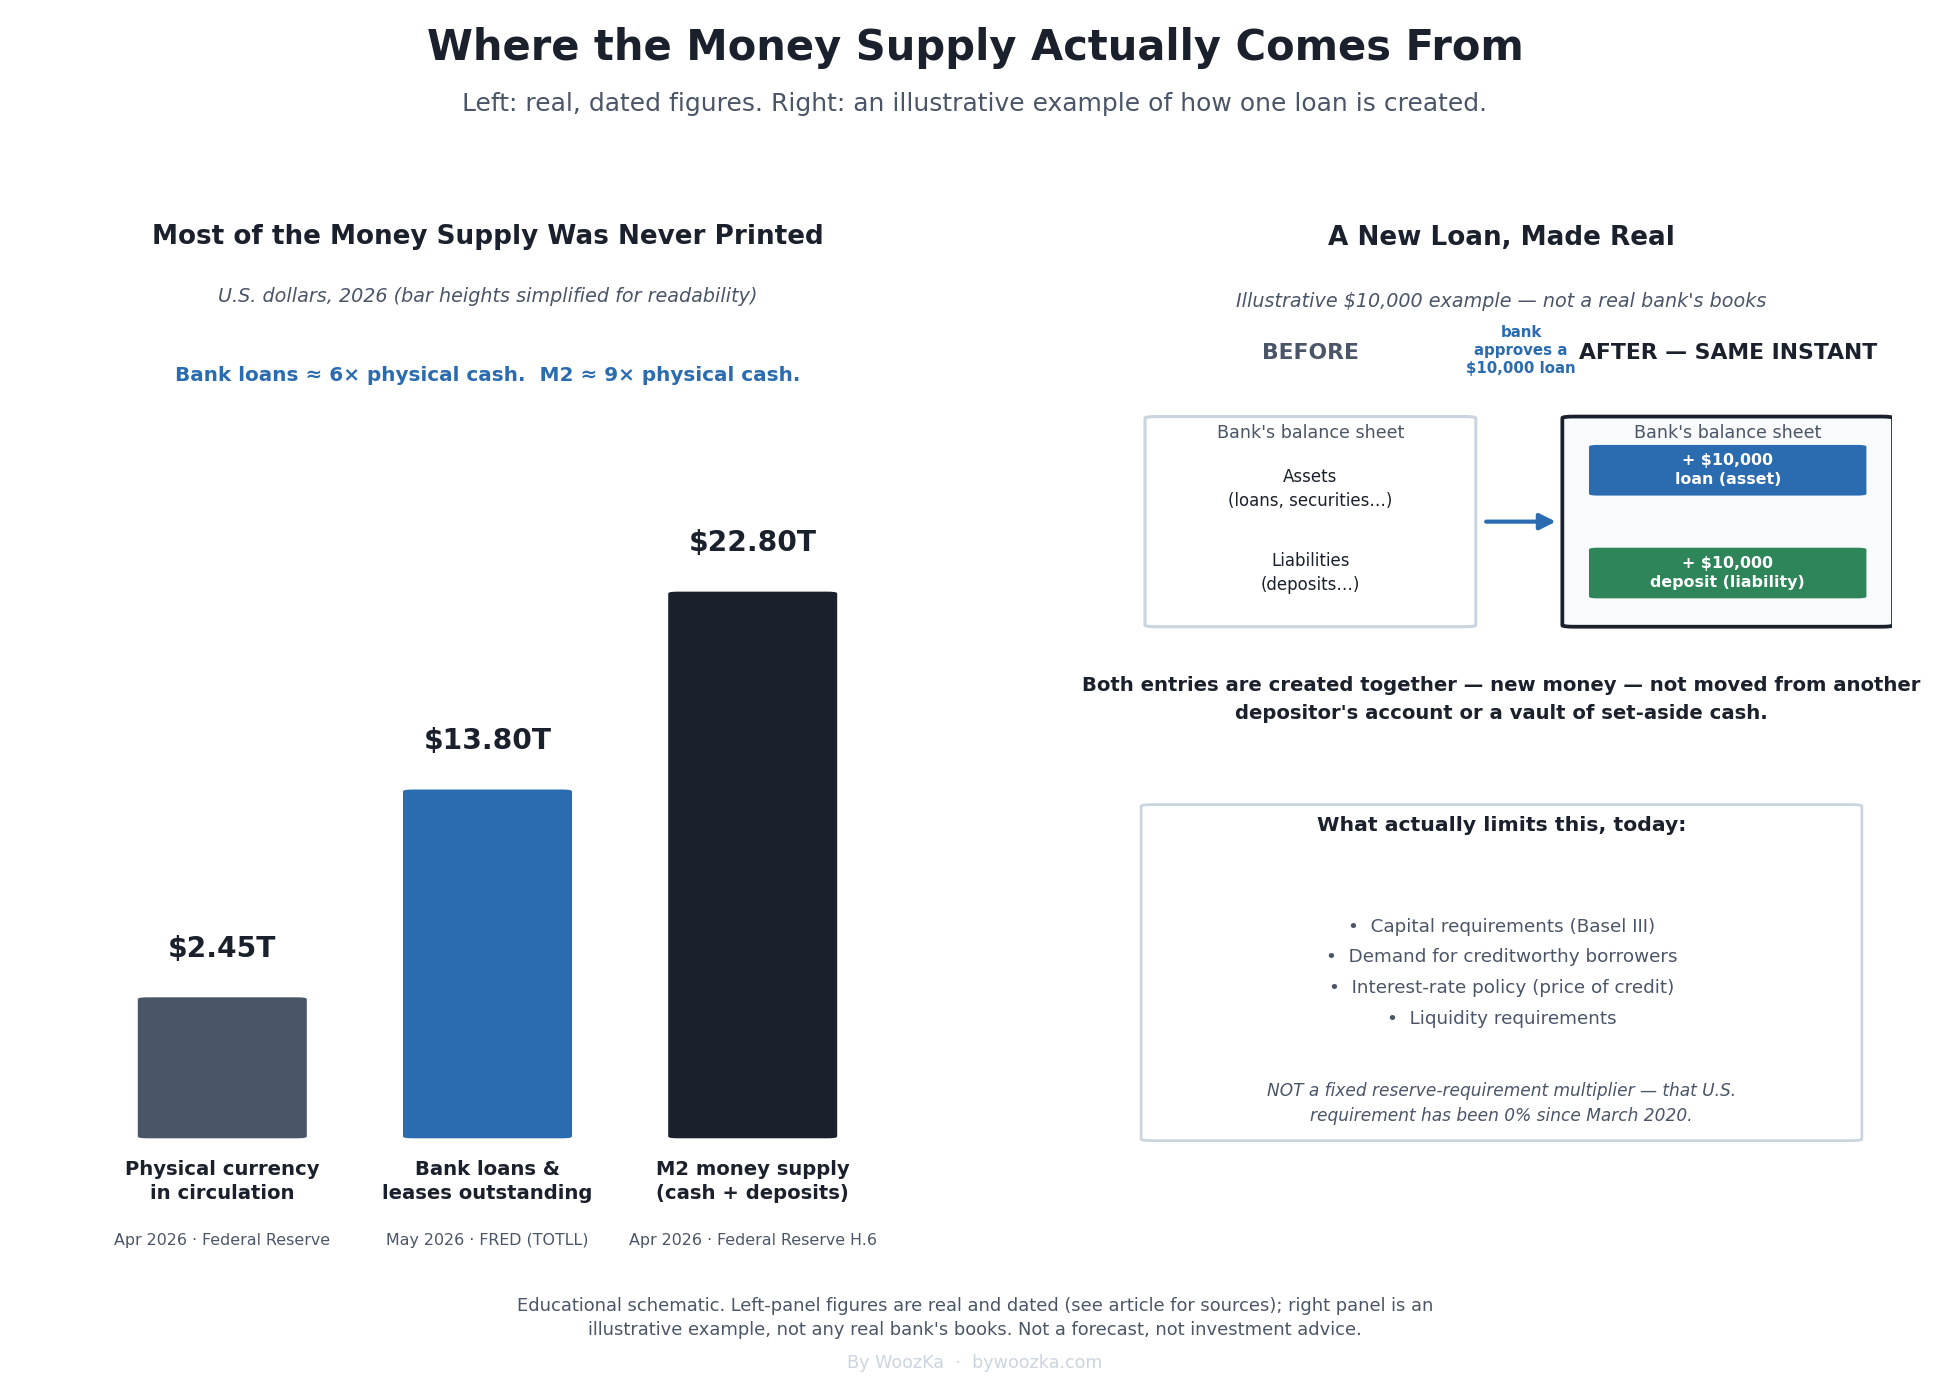 Almost all the “money” in the economy is not paper. It’s a number in a database that a bank created the moment it approved a loan. This is an educational schematic — the left bars are real, dated figures; the right side is an illustrative example, not a real bank’s actual books.
If you picture the amount of money in the economy as a fixed pile of bills sitting in a giant vault somewhere, here’s a number that breaks that picture: as of April 2026, physical U.S. currency in circulation — every bill and coin outside a bank vault or the Treasury — totaled about $2.45 trillion [source: Federal Reserve Board, Currency in Circulation: Value / Monetary Base data]. Total loans and leases sitting on U.S. commercial banks’ books, meanwhile, were about $13.8 trillion as of May 2026 [source: Federal Reserve / FRED, “Loans and Leases in Bank Credit, All Commercial Banks” (TOTLL)], and the broader M2 money supply — cash plus checking and savings balances plus a few other liquid holdings — was about $22.8 trillion as of April 2026 [source: Federal Reserve H.6 release / FRED, M2 (M2SL)]. Bank loans alone are roughly six times all the physical cash in existence. The money supply as a whole is more than nine times it.
That gap is the whole story of this article. Most of what you call “money” was never printed by anyone. It was created the moment a bank approved a loan — and understanding exactly how that happens (and what actually stops a bank from doing it without limit) is one of those pieces of financial literacy that quietly reframes everything else in this silo: what a “deposit” really is, why a banking panic can spiral, and why the Fed’s interest-rate lever (covered in Why Interest Rates Move Markets) is really a lever on the pace of money creation itself.
Most of the money supply was never printed. Each figure is roughly six to nine times the one before it.
| Measure | Approximate size |
|---|---|
| Physical currency in circulation | ~$2.45 trillion |
| Bank loans and leases outstanding | ~$13.8 trillion |
| M2 money supply | ~$22.8 trillion |
The Textbook Story You Were Probably Taught
If you took an introductory economics class, you likely learned something like this: a bank takes in $1,000 of deposits, keeps a “reserve requirement” of 10% ($100) in the vault, and lends out the rest ($900). That $900 gets deposited in another bank, which keeps 10% and lends out $810, and so on — a chain that, added up, could theoretically turn $1,000 of deposits into $10,000 of total money in the system (1 ÷ 10% = a “money multiplier” of 10). Banks were taught as intermediaries: they gather up money savers already have and pass it along to borrowers, constrained by how much of each deposit they’re required to keep on hand.
It’s a tidy story, it’s genuinely useful for building intuition about some connection between reserves and lending, and it is still printed in plenty of textbooks. It is also not how the modern banking system actually works, and hasn’t been an accurate description of the binding constraint on U.S. banks for a long time. Two separate developments make that clear: how banks actually book a loan, and what happened the last time regulators tried to test the multiplier story directly.
What Actually Happens: A Loan Creates the Deposit
The clearest, most cited plain-English correction to the textbook story comes not from a fringe source but from a central bank. In its 2014 Quarterly Bulletin, the Bank of England published “Money Creation in the Modern Economy,” stating flatly that the popular description of money creation is a misconception: banks do not simply act as intermediaries, lending out deposits that savers place with them, and they don’t “multiply up” central-bank money into new loans and deposits either [source: Bank of England Quarterly Bulletin 2014 Q1, McLeay, Radia & Thomas, “Money creation in the modern economy”]. Instead, whenever a bank makes a loan, it simultaneously creates a matching deposit in the borrower’s account — new money, created at the moment of lending, not sourced from somewhere else in the vault.
Walk through what actually happens on a bank’s own books when it approves, say, a $10,000 loan. On the asset side of its balance sheet, the bank records a new asset: “loan receivable, $10,000” — money the borrower now owes the bank, with interest. On the liability side, at the very same instant, the bank records a new liability: “deposit, $10,000” — money the bank now owes the borrower, payable on demand. Nothing was moved out of a vault. No other depositor’s balance went down. Both entries — the asset and the liability — were created together, out of a keystroke, backed by nothing more than the borrower’s promise to repay and the bank’s assessment that the loan is sound. That’s the “before/after balance sheet” on the right side of the chart above: a $10,000 asset and a $10,000 liability appear simultaneously, and the total money supply is $10,000 larger than it was a moment before. If the same idea sounds familiar, it’s the same mechanic explored from the reader’s own side of the ledger in Assets vs Liabilities — your loan is the bank’s asset, and your new deposit is the bank’s liability, at the same time it’s your asset and (eventually) your liability to repay.
This isn’t a loophole or a trick unique to one bank — it’s how the modern fractional-reserve banking system is designed to work, and central banks describe it plainly, not as a scandal. The point of walking through the mechanics isn’t that something shady is happening; it’s that the “bank as passive middleman, moving pre-existing dollars from savers to borrowers” mental model is simply wrong, and a more accurate one — “banks create new money as a byproduct of extending credit, within limits set elsewhere” — explains a lot more of what you actually observe, including the experiment described next.
The Real-World Test That Broke the Old Model
If the classic multiplier story were true — banks lending out a fixed multiple of their reserves — then flooding the banking system with reserves should have mechanically flooded the economy with new loans and a correspondingly larger money supply. In the years after the 2008 financial crisis, that experiment effectively ran in public.
Total bank reserves held at the Fed grew from roughly $0.01 trillion in August 2008 to about $2.8 trillion by 2014 as the Fed responded to the crisis and then ran multiple rounds of quantitative easing [source: FRED Blog, Federal Reserve Bank of St. Louis, “The monetary multiplier and bank reserves,” July 2023]. Under the textbook multiplier model, that roughly 280-fold increase in reserves should have driven a comparable explosion in bank lending and the money supply. It didn’t: the same analysis shows the M2 money multiplier — which had been fairly stable for the fifteen years before the crisis — fell by about half within a few months in late 2008 and early 2009, and stayed depressed for years afterward [source: FRED Blog, “The monetary multiplier and bank reserves,” July 2023]. Banks sat on enormous piles of reserves rather than lending them out anywhere near the old multiplier’s prediction.
Part of the reason is a policy change that happened in the middle of the crisis: on October 6, 2008, the Federal Reserve announced — accelerated by the Emergency Economic Stabilization Act — that it would begin paying banks interest on the reserve balances they held at the Fed, effective October 9, 2008 [source: Federal Reserve Board, press release, October 6, 2008, “Board announces that it will begin to pay interest on depository institutions’ required and excess reserve balances”]. Once holding reserves paid banks a safe, dependable yield, and the economy was short on creditworthy borrowers willing to take on new debt in a recession, banks had every reason to hold reserves rather than race to lend them out. The lesson isn’t a conspiracy — it’s that reserves were never the tight leash the textbook chain assumed. What actually constrains lending lives elsewhere, and by 2020 the reserve requirement itself was formally retired.
What Actually Limits Money Creation Today
If reserve requirements aren’t the binding constraint, what is? Since March 26, 2020, the answer to “how much does a reserve requirement limit U.S. bank lending” is: not at all, by rule. The Federal Reserve Board reduced reserve requirement ratios on all net transaction accounts to zero percent, eliminating reserve requirements for every U.S. depository institution, as part of a deliberate, pre-planned shift to what the Fed calls an “ample reserves” framework for implementing monetary policy [source: Federal Reserve Board, “Reserve Requirements”; Federal Register, “Regulation D: Reserve Requirements of Depository Institutions,” March 24, 2020 notice]. The old 10%-reserve, 10x-multiplier textbook chain isn’t just empirically weak — it no longer describes U.S. bank regulation at all. If you learned it as “the rule,” it’s worth updating that specific fact even if the broader intuition (banks are limited, just not that way) still holds.
So what does the limiting, in practice? A handful of things, working together, none of them a single dial:
- Capital requirements. Banks must fund a slice of their assets (including loans) with their own capital — shareholders’ equity — as a buffer against losses, under the Basel III international framework as implemented by U.S. regulators. This is a live, moving target: on March 19, 2026, the Federal Reserve, OCC, and FDIC jointly proposed rules that would ease several of these capital requirements — lowering aggregate common-equity-tier-1 requirements by roughly 4.8% for the largest banks, 5.2% for mid-sized banks, and 7.8% for smaller banks — with a comment period that closed June 18, 2026 [source: Mayer Brown, “US Banking Regulators Propose Reforms to Capital Requirements,” 2026; ABA Banking Journal, March 2026]. As of this writing the proposal had not been finalized; confirm its status before citing a specific requirement level. The direction matters more than the exact number for this article’s point: capital, not vault cash, is the modern lever regulators pull to tighten or loosen how much banks can lend.
- Demand for creditworthy borrowers, and profitability. A bank can be flush with capital and still not lend if it can’t find borrowers it believes will repay at a profitable rate — exactly what happened with the post-2008 excess reserves above. Money creation through lending is demand-constrained as much as supply-constrained.
- Monetary policy, transmitted through interest rates. The Fed no longer controls lending by capping reserves; it influences the price of credit by setting its target for the federal funds rate (held at 3.50%–3.75% as of the June 17, 2026 FOMC meeting — confirm current before relying on it) and the rate it pays on reserve balances. Raise that price and borrowing (and the money creation that comes with it) tends to slow; cut it and the reverse tends to happen — the same transmission mechanism walked through channel-by-channel in Why Interest Rates Move Markets.
- Liquidity requirements. Separate from capital rules, banks must hold enough readily-saleable, high-quality assets to meet expected short-term cash outflows, which constrains how aggressively they can convert deposits into longer-term loans.
None of these is a hard, mechanical multiplier you can compute on the back of an envelope the way the old textbook model let you. That’s a less satisfying answer than “10% reserve requirement, multiply by 10” — but it’s the accurate one, and it’s why economists and central banks increasingly teach interest-rate policy and capital regulation as the real levers, not reserve arithmetic [source: Federal Reserve Bank of St. Louis, Page One Economics, “Teaching the Linkage Between Banks and the Fed: R.I.P. Money Multiplier,” 2021].
The Part That Makes It Work — and the Part That Can Break
Here’s the uncomfortable flip side of “your deposit is the bank’s liability, created out of a loan, not sitting in a vault with your name on it”: the system only works because almost everyone, almost all the time, doesn’t ask for their money back on the same day. Banks hold only a fraction of deposits as readily available cash and short-term assets; the rest is out the door as loans, mortgages, and securities that can’t be liquidated instantly without a loss. That’s fine as long as withdrawals stay orderly and roughly predictable. It stops being fine the moment a large share of depositors want their money back at once — a bank run.
The clearest recent illustration is Silicon Valley Bank in March 2023. Depositors — heavily concentrated in tech startups with large, often uninsured balances — withdrew roughly $42 billion in a single day (March 9, 2023) after the bank disclosed losses on its securities portfolio and tried to raise capital; regulators shut the bank down the next day [source: FDIC, “Silicon Valley Bank” failed-bank record; NPR, “A Silicon Valley lender collapsed after a run on the bank,” March 10, 2023]. About 89% of SVB’s roughly $172 billion in deposits exceeded the FDIC’s standard insurance limit at the time [source: FDIC press materials on the SVB resolution, March 2023]. That standard limit — $250,000 per depositor, per insured bank, per ownership category — is the backstop that exists precisely because deposits are a promise, not a vault of set-aside cash, and the promise can fail for an individual bank. Regulators ultimately invoked emergency authority to guarantee all of SVB’s deposits, insured or not, at an estimated cost to the FDIC’s Deposit Insurance Fund of about $20 billion — but that decision was a discretionary systemic-risk response to that specific event, not a standing guarantee reformers should assume applies automatically to any future bank failure [source: FDIC press release, March 2023; reporting on the FDIC chairman’s cost estimate].
None of this means deposits are unsafe as a rule — deposit insurance, capital requirements, and liquidity rules exist precisely because regulators understand the mechanism described in this article and design safeguards around it. It does mean “money in the bank” is a claim on an institution managing a mismatch between instantly-payable liabilities and slower-to-liquidate assets, not literal cash held in your name — which is exactly why the emergency-fund and account-diversification guidance elsewhere on this site (see Assets vs Liabilities) treats “which institution, and how much is actually insured there” as a real question, not paranoia.
How the Money Supply Is Actually Measured
If bank lending is what creates most money, the obvious next question is how anyone counts the result. The chart at the top of this article leans on one such measure — M2 — and it is worth knowing what that is, what its smaller sibling M1 is, and why the aggregate people ask about most often does not exist in the United States at all.
What the Fed Publishes, and What It Does Not
The Federal Reserve reports the money stock in a statistical release called the H.6. It publishes two aggregates. Not four. [source: Federal Reserve statistical release H.6, “Money Stock Measures,” released August 25, 2026; seasonally adjusted levels for July 2026 — federalreserve.gov]
| Aggregate | Published? | Level, July 2026 |
|---|---|---|
| M0 | No | — |
| Monetary base | Separately | — |
| M1 | Yes, in the H.6 | $19,886.4B |
| M2 | Yes, in the H.6 | $23,218.0B |
| M3 | Not since 2006 | — |
There is no such thing as US M0. It is a British term — the Bank of England used it for the narrowest measure of money, and retired it years ago — and it gets imported into American discussion by people who assume every central bank numbers its aggregates the same way. What Americans usually mean by it is the monetary base: physical currency in circulation plus the reserve balances banks hold at the Fed. That is a real and useful quantity, but it is reported separately rather than as an H.6 headline aggregate, so if you see a chart labeled “US M0” you are looking at someone’s reconstruction, not at a Federal Reserve series. M3 was genuinely published once and is not any more: the Board stopped it on March 23, 2006, on the grounds that it conveyed nothing about the economy that M2 did not already convey. [source: Federal Reserve, “H.6 Release — Discontinuance of M3” — federalreserve.gov]
M1 and M2 Today
M1 is the narrow measure: cash in the public’s hands plus the deposits you can spend immediately. M2 is M1 plus small time deposits and retail money market funds. So M2 contains M1 entirely, and the interesting number is the distance between them.
| Measure | July 2026 |
|---|---|
| M1 | $19,886.4B |
| M2 | $23,218.0B |
| M2 minus M1 | $3,331.6B |
| M1 share of M2 | 85.7% |
That last row surprises most people. M1 is 85.7% of M2 — the “narrow” measure is very nearly the whole of the “broad” one, and only $3,331.6B separates them. If you learned that M1 was a small slice of M2, you learned something that was true and stopped being true on a specific date, for a reason that has nothing to do with money being created.
The $11.2 Trillion That Was Never Created
This article is about money genuinely coming into existence when a bank lends. The largest single jump in the history of the M1 series is the exact opposite of that, and it is worth knowing about because it is a trap sitting inside almost every long-run money chart on the internet.
Reserve requirements were eliminated on March 26, 2020, and on April 24, 2020 the Board deleted Regulation D’s six-per-month limit on transfers out of a savings account. That removed the last practical difference between a savings deposit and a checking deposit, so savings deposits were reclassified as transaction accounts and folded into M1 under a new line called “other liquid deposits.” Effective May 2020, M1 rose by the entire industry total of savings deposits — approximately $11.2 trillion. [source: Federal Reserve, H.6 Technical Q&As, on the May 2020 series break in M1 — federalreserve.gov]
M2 did not move at all. That is the whole point, and it is the cleanest possible illustration of the difference between an accounting change and an economic one. Savings deposits were already inside M2; reclassifying them shifted money from one compartment of the box into another without changing what was in the box. Nobody borrowed, nobody lent, no bank wrote a new loan, and not one dollar was created — and yet a chart of M1 shows a near-vertical line. For scale, that reclassification was about 3.4 times the size of the entire remaining gap between M1 and M2 today.
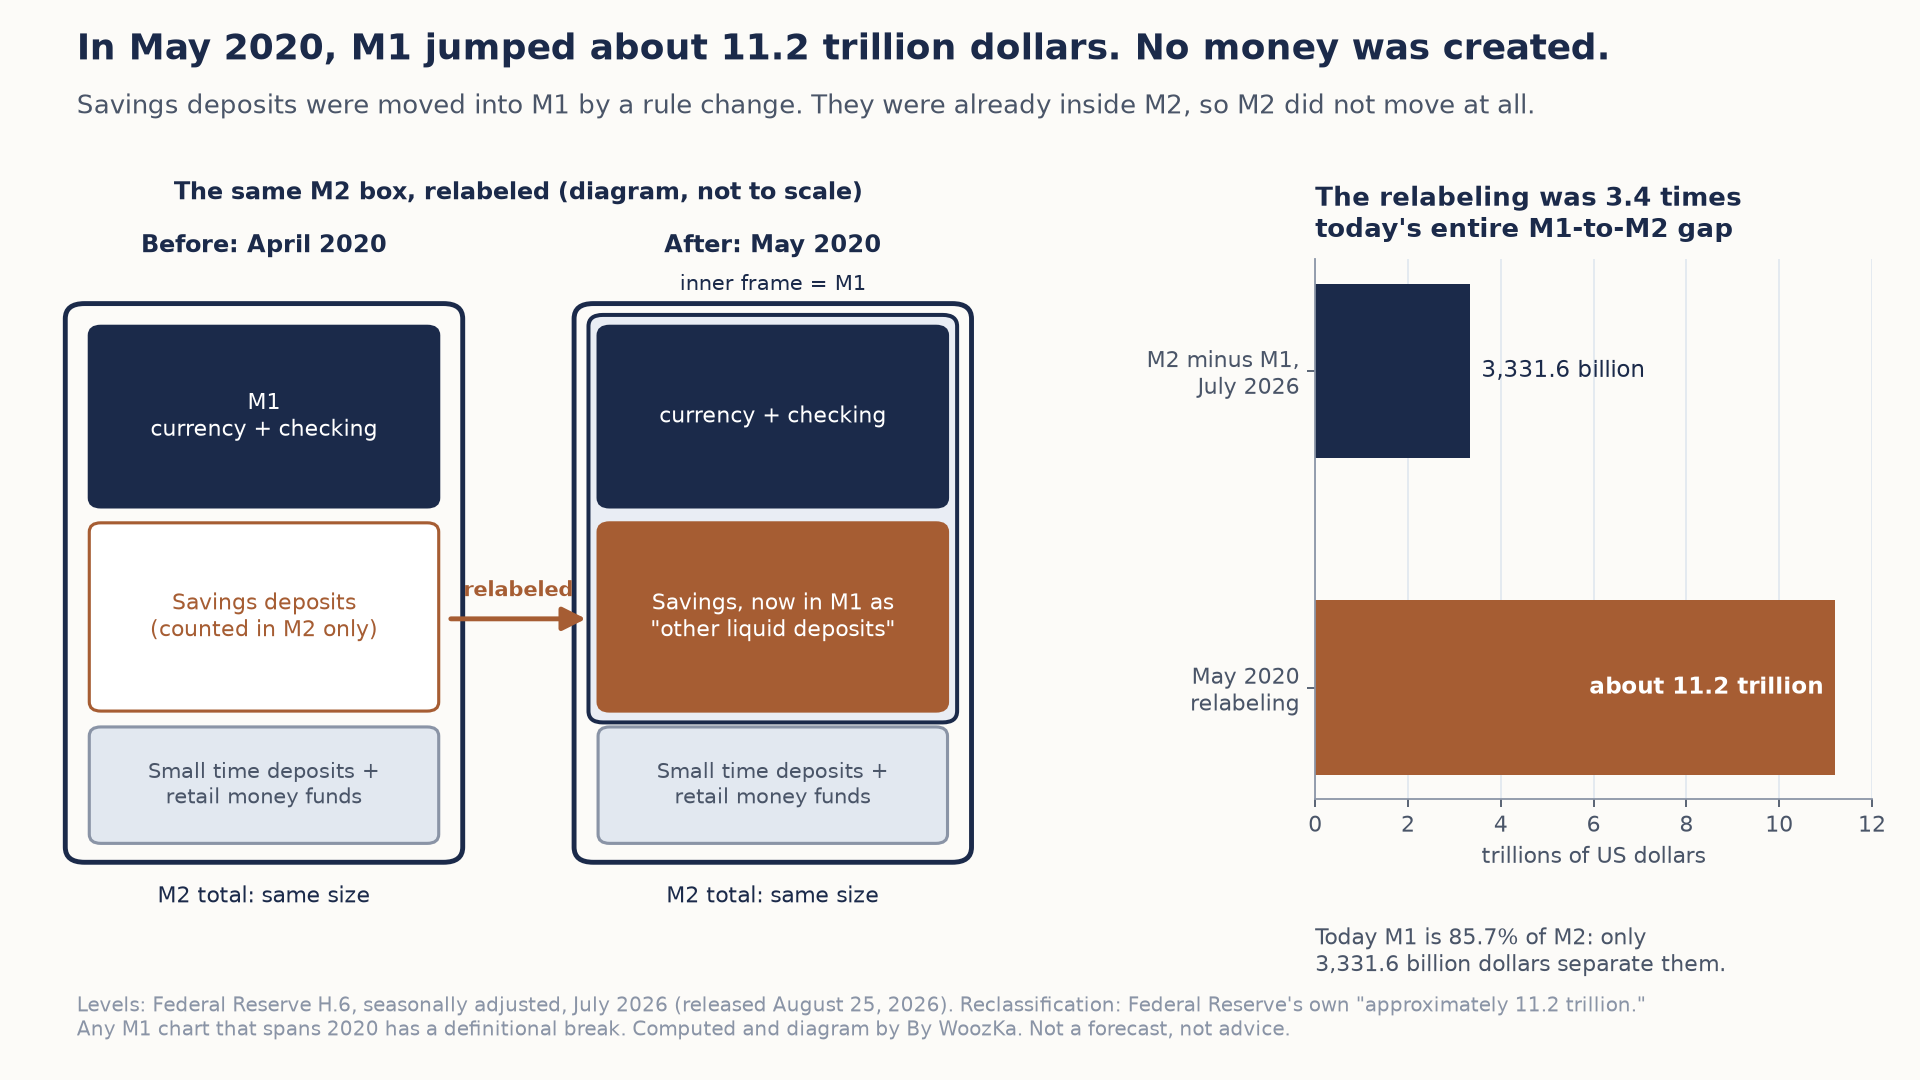 The biggest jump in the history of M1 was a change of label, not new money: savings deposits moved from one compartment of M2 into another. That one relabeling was 3.4 times the whole gap that separates M1 from M2 today, which is why any M1 chart spanning 2020 has a break in it.
The practical consequence: any M1 chart that spans 2020 is discontinuous, and the break is definitional. If you are trying to reason about whether the money supply grew, M2 is the series that stayed on a consistent footing across that date — and the mechanism this article describes, banks creating deposits by lending, is what actually moves it.
How recent these H.6 readings are, and what was done with them. The M1 and M2 levels are seasonally adjusted monthly figures for July 2026, from the H.6 release dated August 25, 2026; the money stock is revised and republished regularly, so treat them as a dated snapshot rather than a current quote, and check the H.6 for the latest. Two figures were deliberately left out: readings for the monetary base and for currency in circulation disagreed with each other in a way that is arithmetically impossible — the base contains currency, so it cannot be the smaller of the two — so neither is published here and both appear above only as concepts. The two derived rows are plain arithmetic on the sourced levels: $3,331.6B is M2 minus M1, and 85.7% is M1 divided by M2. The reclassification figure is the Federal Reserve’s own “approximately” and is not precise to the dollar. Nothing here is a forecast, a rate, or a recommendation. The code behind these tables reports every figure above and checks that each derivation reconstructs its inputs before reporting anything.
Why This Isn’t “Banks Are a Scam”
It’s tempting, once you see that banks create money rather than just moving it around, to conclude the whole system is some kind of con. That reaction is understandable but misses the actual point. Every modern economy needs a mechanism to fund productive activity — building a factory, buying a house, starting a business — faster than savers could otherwise accumulate the cash for it upfront. Credit creation is that mechanism: it lets economic activity expand ahead of savings, which is also, not coincidentally, the engine behind the short-term debt cycle described in Short-Term vs Long-Term Debt Cycles and the pillar for this whole section, The Economic Machine Explained. Credit expansion funds growth; credit over-expansion, unwound too fast or built on debt nobody can actually service, is what turns an ordinary slowdown into a crisis. The mechanism itself is neutral — it’s the pace and the underwriting discipline behind it that determine whether it’s healthy.
That’s also why “good debt vs. bad debt” (see Good Debt vs Bad Debt) is a question worth asking about your own borrowing specifically, separate from any view on the banking system as a whole: every loan you take out is, mechanically, new money entering the economy on the promise that you’ll service it. Whether that’s a healthy trade for you depends on what the loan buys and whether you can carry it — not on whether “banks create money,” which they do regardless of any individual loan’s merits.
Consider what actually happens the first time this clicks for someone: staring at a bank statement and realizing that the “money” sitting in that account isn’t a stack of bills with your name on it somewhere in a vault — it’s an IOU from an institution that manufactured it the moment somebody else took out a loan. For most people, that’s not a comforting thought at first. It’s usually followed by a second, calmer one: the system has rules, insurance, and regulators built around exactly this fact, and understanding the mechanism is what lets you tell the difference between “how banking normally works” and “a specific institution taking on risk I should know about.”
The Takeaway
Almost all the money you use day to day was never printed by anyone — it was created the moment a bank extended credit, as a matching entry on both sides of a ledger. The old “reserve requirement times the multiplier” story you may have learned is a useful first approximation for classroom intuition, but it hasn’t matched U.S. bank regulation since reserve requirements were set to zero in 2020, and it didn’t even predict what happened the last time regulators pumped trillions of reserves into the system after 2008. What actually limits banks today is a combination of capital requirements, the availability of creditworthy borrowers, and the price of credit set through interest-rate policy — all of which tie directly back to the Fed mechanics covered elsewhere in this silo, and none of which is a fixed multiple you can calculate from a reserve ratio.
The practical upshot for you as a saver and borrower isn’t to distrust banks — it’s to understand what a deposit actually is (a claim on an institution, not cash in a vault with your name on it), why deposit insurance limits exist and matter, and why “how much credit is expanding, and how fast” is one of the real engines behind the economic cycles this whole silo is built to explain. For the bigger system this fits inside, the pillar — The Economic Machine Explained — is the natural next stop.
Credit created at a keystroke is also what makes an economy move in cycles rather than a straight line. That thread is picked up in our interactive explainer on economic cycles.
Disclaimer: This article is educational content, not financial advice. I am not a licensed financial advisor, and nothing here is a recommendation to buy or sell any security or asset. Investing and trading involve risk, including the possible loss of the money you invest. Do your own research and consider consulting a licensed financial professional before making investment decisions. Read the full Disclaimer.
Historical and backtested results are hypothetical, carry inherent limitations, and do not guarantee future results. Figures were accurate to the best of my knowledge as of this article’s last-updated date and may have changed.
