Assets vs Liabilities: The Simple Distinction That Changes How You Spend
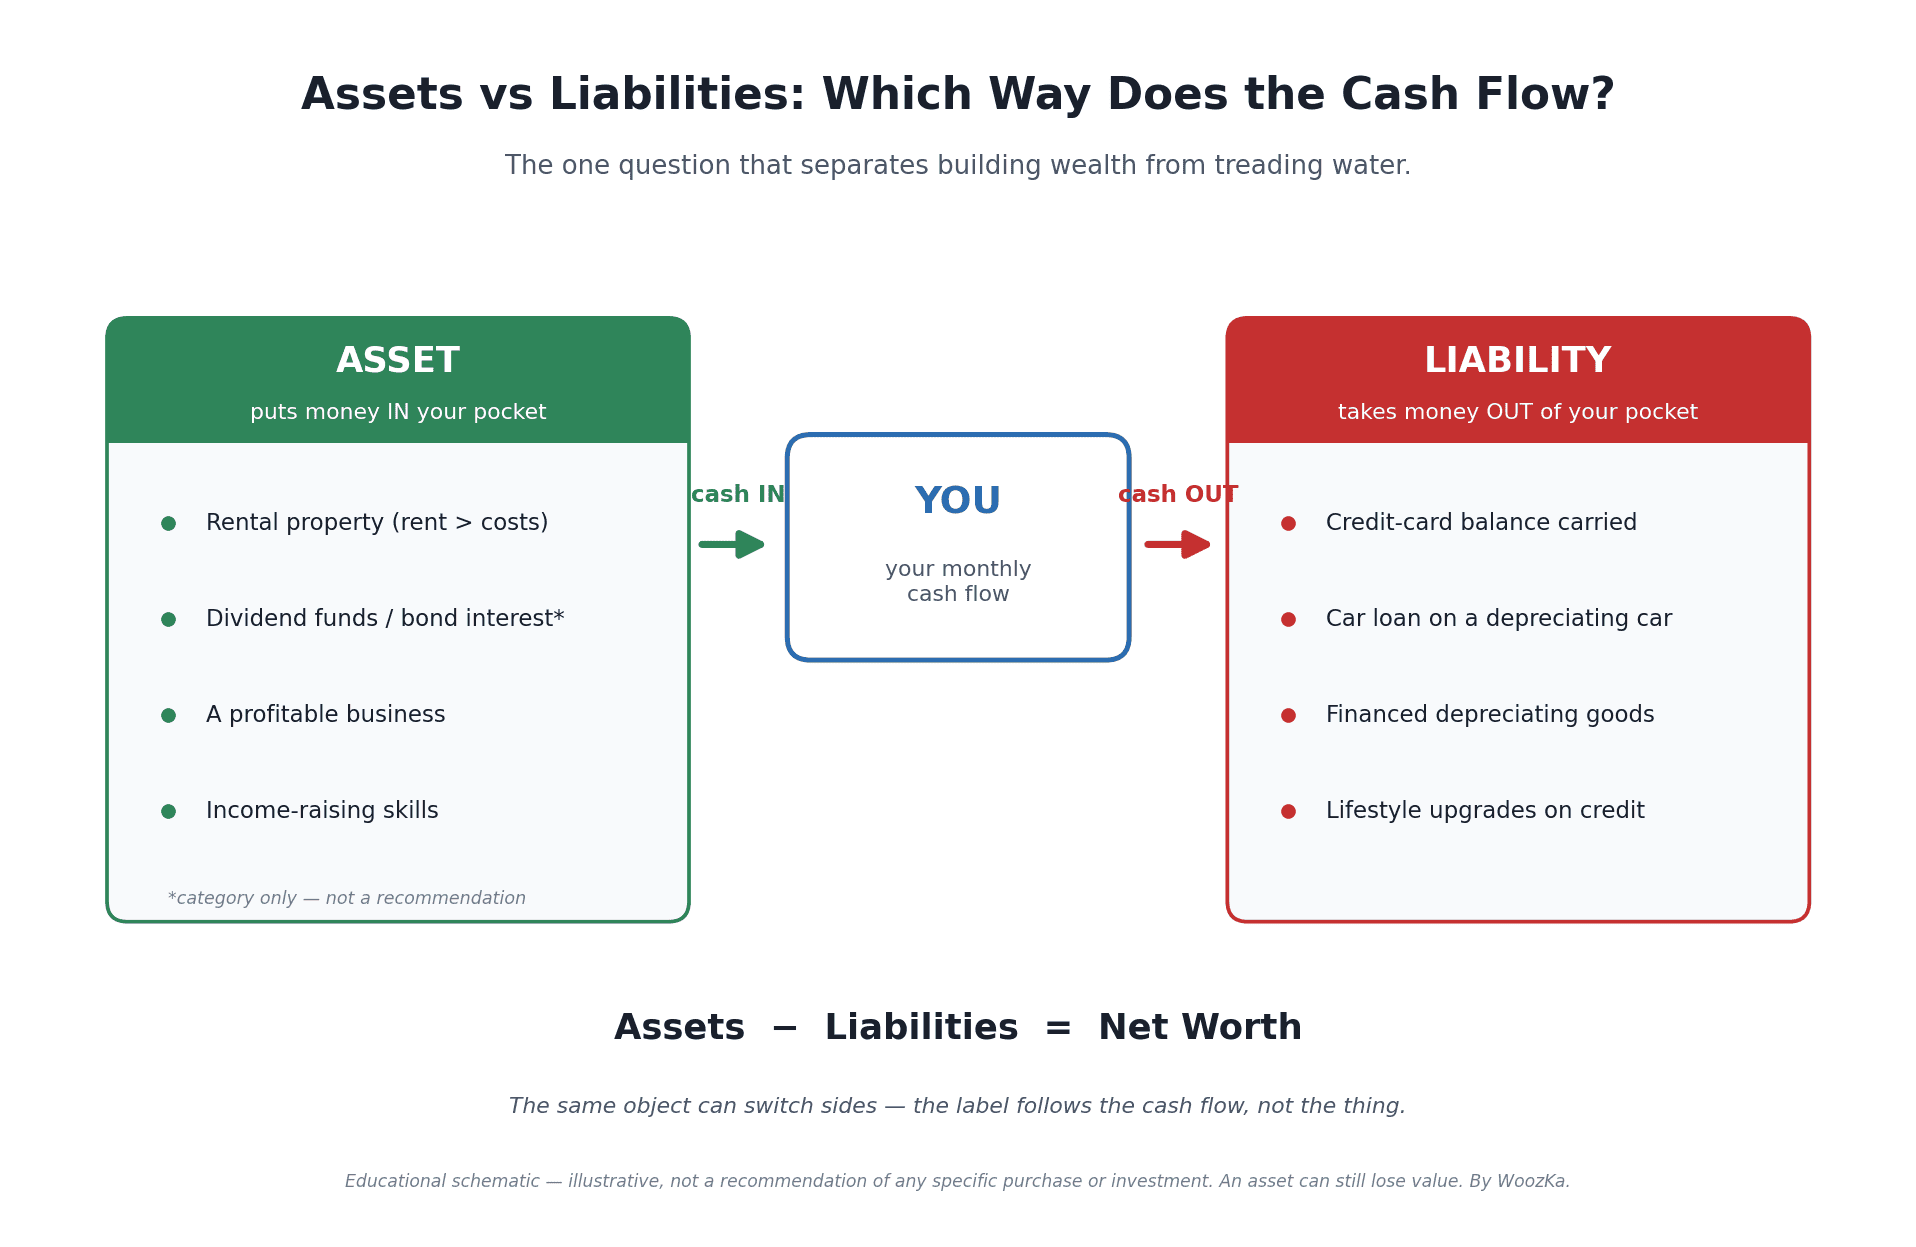 The whole distinction in one picture: assets push cash toward you, liabilities pull it away, and the difference between the two is your net worth. This is an educational schematic to make the concept concrete — not a recommendation of any specific purchase or investment.
Ask ten people to name an asset and most will point at something expensive: a new car, a bigger house, a designer watch. That instinct — expensive equals asset — quietly wrecks more budgets than almost any other money mistake, because it flips the one distinction that actually separates building wealth from treading water. The good news is that the distinction is genuinely simple, and once it clicks you’ll never look at a purchase the same way again.
This article separates two things that usually get blurred together: the formal accounting definition of an asset and a liability (what your accountant means) and the cash-flow reframe popularized by Robert Kiyosaki (what changes how you actually spend). Both are useful. They mostly agree, they famously collide on one question — is the house you live in an asset? — and understanding exactly where they diverge is the whole payoff. This is a foundational piece in the Money & Economics section here; if you want the bigger system these ideas live inside, start with The Economic Machine Explained.
The Textbook Definition: What Accountants Actually Mean
Let’s begin with the authoritative version, because it’s the anchor everything else swings from. In the United States, the body that sets the definitions used in financial reporting is the Financial Accounting Standards Board (FASB). In December 2021 it issued Concepts Statement No. 8, Chapter 4, which superseded the older Concepts Statement No. 6 and updated the core definitions [source: FASB Concepts Statement No. 8, Chapter 4, “Elements of Financial Statements,” December 2021]. Stripped to their essence:
- An asset is a present right of an entity to an economic benefit [source: FASB CON 8, Ch. 4, 2021].
- A liability is a present obligation of an entity to transfer an economic benefit [source: FASB CON 8, Ch. 4, 2021].
Translate that out of accountant-speak: an asset is something you have a right to that can produce a benefit — cash, or something convertible to cash. A liability is something you’re obligated to hand over — a debt, a bill you owe, a future payment you can’t escape. A savings account is an asset; the balance on your credit card is a liability. Simple enough.
The reason these two definitions matter so much together is the equation that connects them, the bedrock of all accounting:
Assets − Liabilities = Net Worth (in business terms, equity).
Your net worth is simply everything you own minus everything you owe. This isn’t abstract. It’s exactly how the Federal Reserve measures household wealth: in its most recent Survey of Consumer Finances, the median U.S. family had a net worth of about $192,900 as of 2022 — total assets minus total liabilities — a figure the Fed reported as the largest three-year jump on record [source: Federal Reserve, Survey of Consumer Finances, “Changes in U.S. Family Finances from 2019 to 2022,” October 2023]. (That’s a snapshot from the 2022 survey and will have moved since; treat it as an illustration of the method, not a current number.) Whether you’re a household or a Fortune 500 company, growing net worth comes down to the same lever: own more of what produces benefit, owe less of what drains it.
The Reframe That Changes Behavior
The accounting definition is correct, but it’s static — a photograph of what you own and owe on one day. What it doesn’t emphasize is direction: which way is the money flowing over time? That emphasis is the contribution of Robert Kiyosaki, whose 1997 book Rich Dad Poor Dad reframed the whole idea around cash flow [source: Robert Kiyosaki, Rich Dad Poor Dad, 1997]. His version is deliberately, almost provocatively simple:
An asset puts money in your pocket. A liability takes money out of your pocket.
That reframe is powerful precisely because it’s behavioral. It forces a single question at the moment of every buying decision — after I own this, will cash tend to flow toward me or away from me? — and that question is far easier to act on at the checkout than a balance-sheet definition. A rental property that a tenant pays for sends money toward you: asset. A financed sports car that demands loan payments, insurance, fuel, and depreciation sends money away: liability, no matter how impressive it looks in the driveway.
It’s worth being honest about the trade-off, though, because this blog doesn’t sell simplifications as gospel. Kiyosaki’s cash-flow test is a lens, not the formal accounting definition, and it can diverge from it. Financial planners and accountants have pushed back on his framing for exactly that reason [source: reporting on the “your house is not an asset” debate — richdad.com; Journal-style commentary]. The accounting definition looks at what you have a right to; the cash-flow lens looks at what the thing does to your monthly budget. Keep both in your head. The accountant’s version tells you what you’re worth; Kiyosaki’s version tends to change what you buy.
Where the Two Definitions Collide: Is Your House an Asset?
Here’s the famous fight, and it’s the best possible illustration of the gap between the two definitions.
The accounting view: the home you own is an asset — you hold a present right to an economic benefit (you can live in it, rent it, or sell it), and it typically carries real market value. The mortgage against it is a separate liability. On a proper balance sheet the two sit on opposite sides: the house under assets, the loan under liabilities, and only the difference (your equity) counts toward net worth.
Kiyosaki’s view: by the cash-flow test, a primary residence you live in fails, because month after month the mortgage, property taxes, insurance, and maintenance pull money out and nothing flows back in as income. On that basis he provocatively called the home you live in a liability — a claim that struck many accountants as flatly wrong, since it nets an asset and its financing into a single label [source: Rich Dad Poor Dad, 1997; the “your house is not an asset” debate].
Who’s right? Honestly, both are describing something true, and the disagreement is really about what you’re measuring. If you’re tallying net worth, your home’s equity is unambiguously an asset. If you’re deciding whether a bigger house will help or hurt your monthly cash flow and freedom, Kiyosaki’s lens is the more useful one — a larger primary residence usually consumes more cash than it generates, even as it may build equity over time. A paid-off home changes the math again: it stops the largest outflow (rent or mortgage) while still costing taxes and upkeep. The practical takeaway isn’t a verdict; it’s the habit of asking both questions before you sign — what does this do to my net worth, and what does it do to my monthly cash flow? — rather than assuming “house = asset” and stopping there.
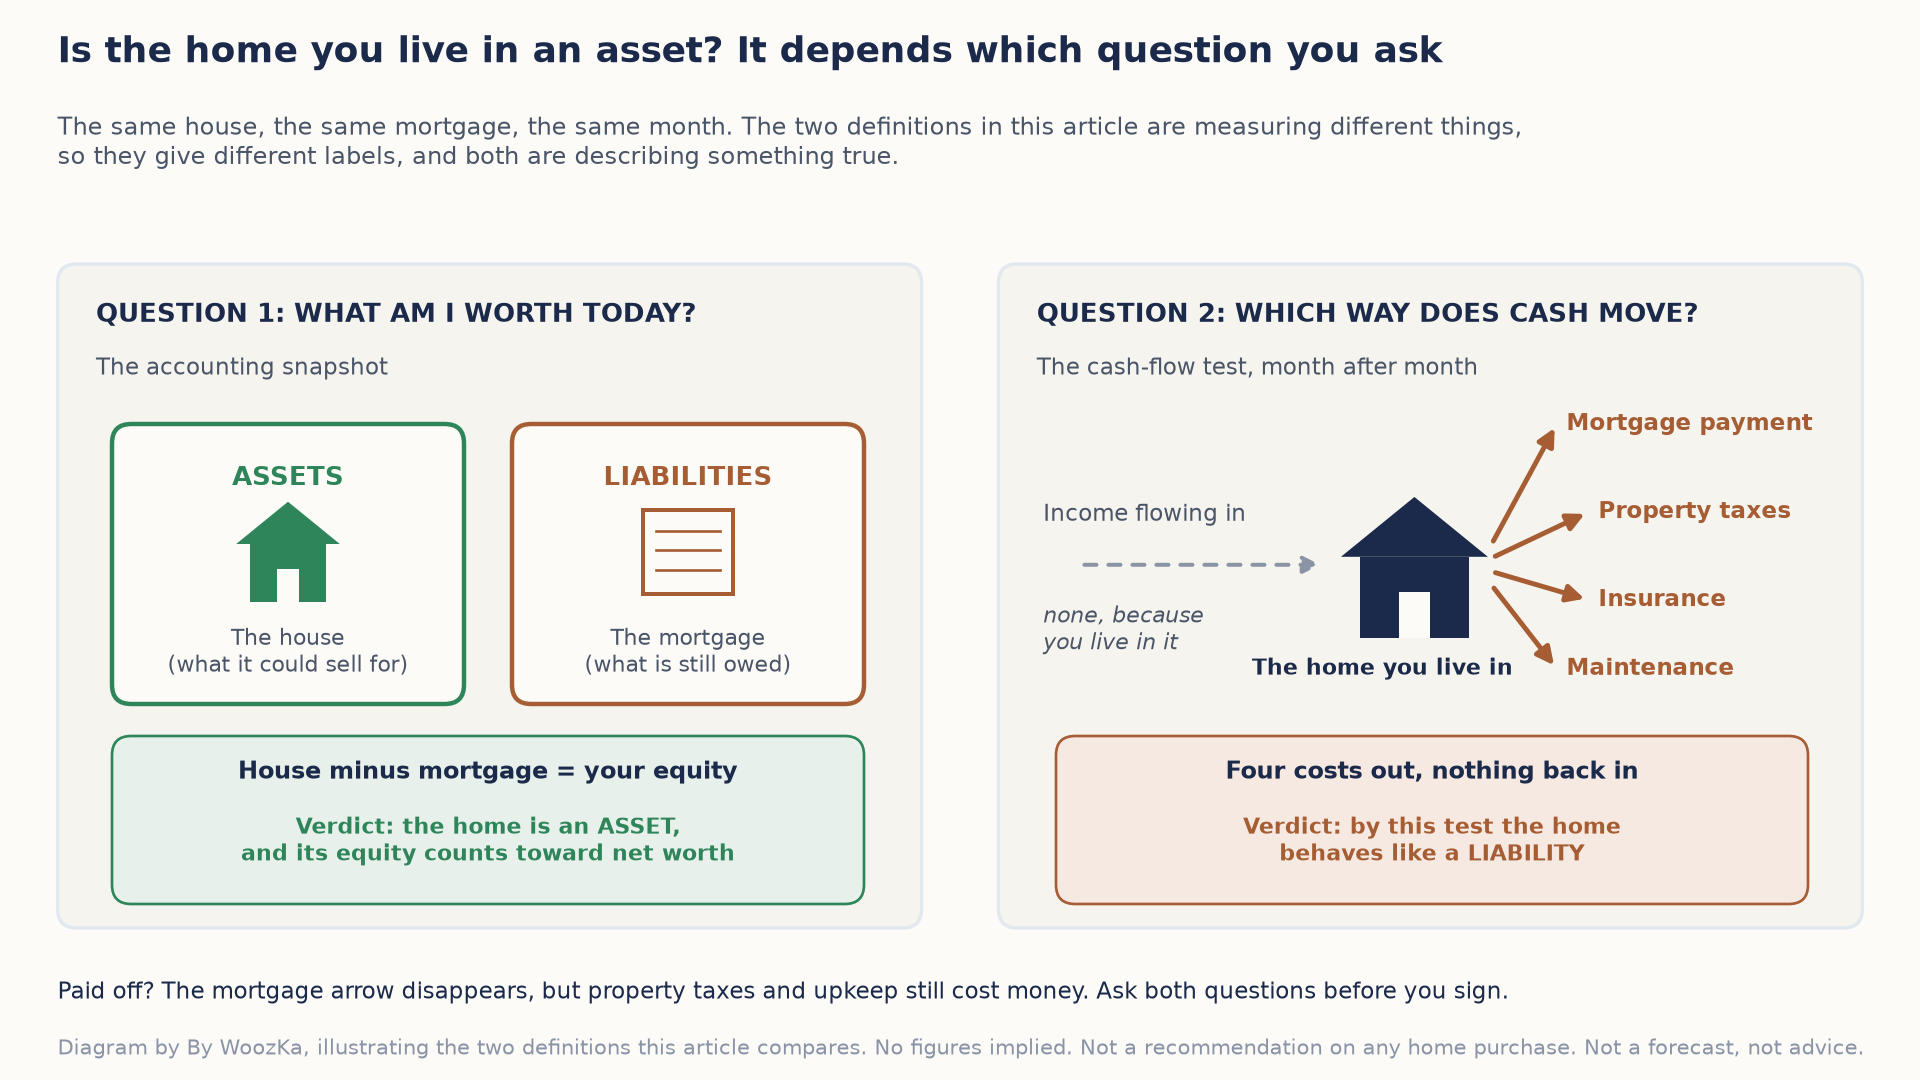 The accountant and the cash-flow test are answering different questions about the same house, which is why one calls it an asset and the other a liability.
Sizing the House Argument
The section above lands on a fair verdict — both lenses describe something true — and leaves the size of the disagreement unstated. It has a size, and the equation printed earlier on this page is enough to find it. A mortgage payment is two things bundled into one withdrawal. The interest leaves your account and nothing offsets it: cash falls, and net worth falls with it. The principal leaves your account too, but the loan balance drops by the same amount, so cash falls, the liability falls, and assets minus liabilities does not move. The cash-flow test counts both halves as money out of your pocket. The balance sheet counts the first as a cost and the second as a transfer from one line to another. So the accountant and the cash-flow test are not arguing about the whole payment. They are arguing about the principal, and how much of a payment is principal is arithmetic rather than opinion.
One Payment, Two Ledgers
On a level-payment loan the split depends on the interest rate and on how far along the loan is, and on nothing else: the loan amount cancels out, so the table below reads the same for a small mortgage and a large one. The rate is the 6.43% thirty-year average that this site’s Good Debt vs Bad Debt article reports from Freddie Mac’s survey for the week of July 2, 2026 — a dated snapshot, used here only to have a real number to run.
| Loan year | Interest share | Principal share |
|---|---|---|
| 1 | 85.0% | 15.0% |
| 5 | 80.6% | 19.4% |
| 10 | 73.2% | 26.8% |
| 15 | 63.1% | 36.9% |
| 20 | 49.1% | 50.9% |
| 25 | 29.9% | 70.1% |
| 30 | 3.4% | 96.6% |
In the first year the two lenses disagree about 15.0% of what leaves the account; on the other 85.0% they are saying the same thing in different vocabularies. On an illustrative $300,000 loan that first payment is $1,882.41, and net worth falls by $1,607.50 of it. For most of the loan’s life the cash-flow reading of the payment sits much closer to the balance-sheet reading than the famous argument suggests, because most of the payment really is a cost under either definition. The divergence is a late-loan phenomenon. By year 25 the disputed portion is 70.1%, and in the final year 96.6% of every payment is money the cash-flow test records as leaving and the balance sheet records as staying.
How the Rate Moves the Line
One rate is one case, so here is the same thirty-year loan across a range wide enough that nothing rests on this year’s figure.
| Rate | First payment principal | Principal passes half after | Lifetime interest |
|---|---|---|---|
| 4.00% | 30.2% | 12.7 years | 41.8% |
| 5.00% | 22.4% | 16.2 years | 48.3% |
| 6.43% | 14.6% | 19.2 years | 55.7% |
| 7.00% | 12.3% | 20.1 years | 58.2% |
| 8.00% | 9.1% | 21.3 years | 62.1% |
The last column is the argument settled over the whole loan. At 6.43%, 55.7% of every dollar sent to the lender across thirty years is interest, so the balance sheet ends up agreeing with the cash-flow test about a little more than half of all the money paid and parting with it on the remaining 44.3%. At 4% the agreed portion is 41.8%; at 8% it is 62.1%. The higher the rate, the more the two definitions agree — which is a less comfortable way of saying that an expensive loan is a drain in anybody’s vocabulary, and a cheap one is mostly a slow way of moving money from your checking account into your own equity.
Ten Years and Nine Months from the End
Change the term instead of the rate and something tidier appears.
| Term | Payments | Principal passes half at | Payments left then |
|---|---|---|---|
| 10 years | 120 | payment 1 | 120 |
| 15 years | 180 | payment 52 | 129 |
| 20 years | 240 | payment 112 | 129 |
| 30 years | 360 | payment 232 | 129 |
The crossing is not a fraction of the way through the loan. It is a fixed distance from the end. At this rate every level-payment loan turns majority-principal when 129 payments remain — ten years and nine months — whatever its term, because the principal share of a payment depends only on how many payments are left, and it passes one half when that count falls below the natural log of two divided by the log of one plus the monthly rate, which here is 129.70. A ten-year loan has only 120 payments to begin with, so it is never majority-interest at all. That gives the article’s remark about a paid-off home a shape. Paying off the house is not a switch that flips the cash-flow verdict; it is the end of a gradient along which the part of the payment the two definitions disagree about grows from about a seventh to nearly all of it, and then disappears together with the payment.
Method and limits, so this can be checked rather than taken on trust. No calculator on this site amortizes a loan, so nothing above comes from a shipped tool; every figure is arithmetic on a level-payment fixed-rate loan, computed in code and checked before publication, with the closed-form principal share checked against a month-by-month schedule at all 360 payments, the loan amount shown to cancel by running $100,000 and $900,000 side by side, and this page’s own equation applied to a single payment to confirm that net worth falls by the interest alone. Four limits are real. Property taxes, insurance and upkeep are left out on purpose: both lenses already call them outflows, so they widen the agreed portion and leave the disputed one untouched. Changes in the home’s market value are left out as well; they move the asset side independently of any payment. Principal that becomes equity cannot be spent without selling or borrowing against the house, which is the cash-flow lens’s real point and is not contested here — the tables size the disagreement, they do not award it. And the 6.43% is a dated survey average, not a quote. Nothing here says whether to buy, which term to choose, or whether to pay a loan down early.
The Test You Can Actually Use
Here is that test applied to something I paid a lot to misclassify. Chasing a funded trading account, I opened and burned more than seventy prop-firm accounts — a number I put down to a gambling streak in my own temperament rather than to any analysis. Every cycle carried a subscription, and the ones that got far enough carried an activation fee on top. Now run the test on it: money left my pocket every month, and across the whole run the thing produced no income at all. By the definition in this section it was never anything other than a liability. It did not look like one, because a prop-firm subscription is sold as access to a future income rather than as a purchase — and that is exactly what the test is for. A liability rarely announces itself as a mistake. It usually arrives labeled as an investment in something, and the only thing that reliably tells the two apart is which way the cash moves while you are holding it.
Strip away the theory and you’re left with one question you can apply to almost any purchase or investment: which way does the cash flow after I own it? The schematic at the top of this article is that question, drawn out. Run a few examples through it:
Things that tend to send cash toward you (asset-like):
- A rental property whose rent exceeds its costs.
- Dividend-paying funds or interest-bearing bonds (as a category — this is not a recommendation of any specific security).
- Ownership in a profitable business.
- Even a skill or credential that raises your income can behave like an asset, though it never appears on a balance sheet.
Things that tend to pull cash away from you (liability-like):
- A credit-card balance carried month to month, quietly compounding against you.
- A car loan on a depreciating vehicle.
- Financed purchases of things that lose value the moment you own them.
Notice that the same object can land on either side depending on how it’s used and financed. A car used to run a delivery business that earns more than the car costs behaves like an asset; the identical car bought purely for status behaves like a liability. The label follows the cash flow, not the object. That’s the entire skill.
A quick caution the cash-flow test doesn’t show on its own: an asset can still lose value. A rental can sit empty; a dividend can be cut; a business can fail. “Sends cash toward you” describes the intended direction, not a promise — which is exactly why the honest version of this framework never turns into a claim that any particular purchase will pay off.
Why This Changes How You Spend
The reason this distinction is worth internalizing is that it quietly rewrites your default spending script. Most people, as their income rises, buy more liabilities — a nicer car, a bigger place, more financed things — and call it “success.” Each one commits a slice of future income to an outflow. The wealth-building move Kiyosaki emphasizes is the reverse: use income to acquire assets first, and let the cash those assets throw off cover the liabilities you genuinely want [source: Rich Dad Poor Dad, 1997]. You don’t have to adopt his whole philosophy to steal the useful habit — pausing at each purchase to ask which direction the cash will flow afterward is enough to bend a budget in the right direction over years.
Picture the ordinary version of getting this wrong: a raise arrives, and within a month it’s been fully absorbed by a larger car payment and a subscription or two — the income went up, but net worth didn’t move, because every new dollar was routed straight into an outflow. The assets-versus-liabilities lens is really just the discipline to notice that pattern before it locks in, and to send at least some of each raise toward the inflow side of the diagram instead.
The Limits: What This Distinction Doesn’t Tell You
Like every clean framework, this one is a lens, not a law, and using it well means knowing its edges.
First, a liability is not automatically bad. Borrowing that funds something which produces more than it costs — a mortgage on a cash-flowing rental, a loan for training that raises your income — can be perfectly sound. The distinction between borrowing that builds you up and borrowing that drags you down deserves its own treatment; that’s the subject of Good Debt vs Bad Debt. The point of the assets-versus-liabilities lens isn’t “avoid all liabilities,” it’s “know which side of the ledger each choice lands on, and choose on purpose.”
Second, the cash-flow test and the accounting definition answer different questions, as the house debate showed — so don’t treat Kiyosaki’s provocations as accounting fact, and don’t let the accountant’s static snapshot blind you to a purchase’s ongoing drain. Use each where it fits.
Third — and this is the boundary that matters most on a site about money — none of this is investment advice. Identifying that rental property or dividend funds are “asset-like” as a category says nothing about whether any specific property, fund, or security is right for you, fairly priced, or safe. That’s a decision for your own research and, where it counts, a licensed professional. This framework is a thinking tool for how you categorize money decisions, not a signal for which ones to make.
Get comfortable with just this one distinction and a surprising amount of personal finance falls into place. It’s the quiet hinge underneath budgeting, debt, and investing alike — and it’s why “assets versus liabilities” belongs near the very start of learning how money works. If you want to see how credit and debt drive the whole economy that your household sits inside, the pillar for this section — The Economic Machine Explained — is the natural next read. And for the weekly plain-English take on these ideas, the newsletter is below.
Disclaimer: This article is educational content, not financial advice. I am not a licensed financial advisor, and nothing here is a recommendation to buy or sell any security or asset. Investing and trading involve risk, including the possible loss of the money you invest. Do your own research and consider consulting a licensed financial professional before making investment decisions. Read the full Disclaimer.
