Is Bitcoin Actually Correlated With Stocks? What the Data Shows
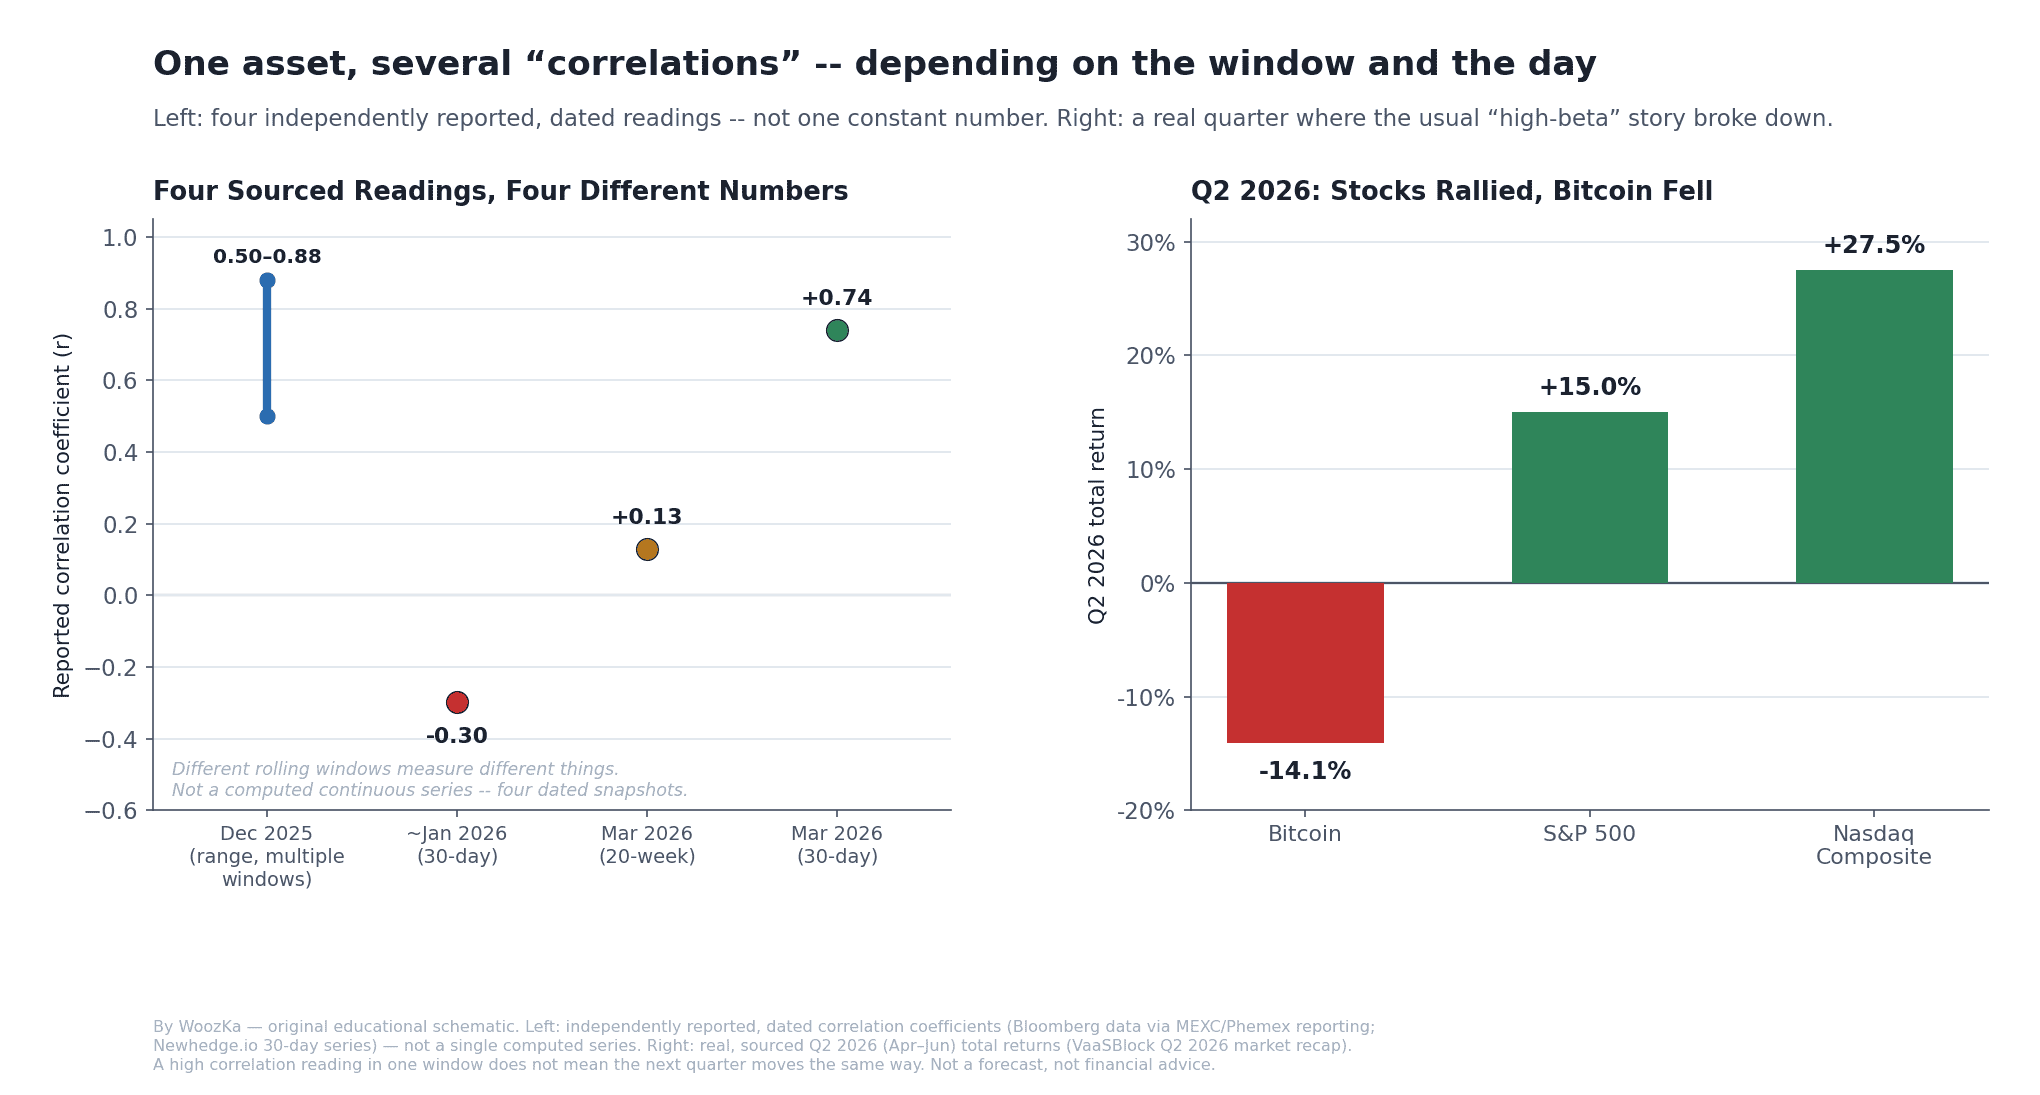
Left: four real, independently reported correlation readings from a five-month window — proof that the “current correlation” depends entirely on which window and which day you check. Right: a real, recent quarter where the usual high-beta story didn’t play out as expected.
If you’ve spent any time reading crypto or markets commentary, you’ve probably run into two contradictory claims stated with equal confidence: “Bitcoin is digital gold, uncorrelated with stocks” and “Bitcoin is just a leveraged tech stock now.” Both claims are true some of the time, and neither is true all of the time. This article walks through what the actual correlation data shows — including a real, recent quarter where it did something a lot of the “high-beta” commentary didn’t expect — and why the honest answer to “is Bitcoin correlated with stocks” is “it depends which correlation reading you’re looking at, and when.”
The Long-Run Baseline: Roughly 0.2, and Not Even That Simple
The most-cited primary research on this question comes from CME Group, which examined daily Bitcoin and S&P 500 returns from January 2014 through April 2025 and found an overall correlation of roughly 0.2 across the full 11-year window [source: CME Group, “Why Is Bitcoin Moving in Tandem with Equities?”, 2025]. But a single 11-year average badly understates what actually happened. CME’s own analysis breaks the period into rolling three-year windows and finds something structurally different: the first two three-year periods (roughly 2014–2020) showed essentially no correlation at all, while correlation turned positive starting around 2020 and has stayed structurally higher ever since. In other words, the “roughly 0.2” headline number is a blend of a decade of near-zero and several recent years of meaningfully positive — which is a very different story than “Bitcoin has always been mildly correlated with stocks.”
CME’s research points to a specific mechanism for the post-2020 shift: institutional adoption. As spot Bitcoin ETFs, futures, and options made crypto easier to access through the same brokerage accounts and trading desks used for equities, the same portfolio managers who trade the Nasdaq and the S&P 500 started allocating to Bitcoin too — and, critically, started treating it like a portfolio-risk-bucket asset rather than an independent one. When those managers de-risk broadly (a Fed-driven liquidity tightening, a growth scare, a general risk-off shift), they now tend to sell equities and Bitcoin together, because both sit in the same “risk-on” allocation bucket at the same desks [source: CME Group, “Why Is Bitcoin Moving in Tandem with Equities?”, 2025].
The Volatility Multiplier: Why “Correlated” Doesn’t Mean “Similar”
Even where correlation is genuinely elevated, it’s easy to misread what that means, because Bitcoin’s volatility dwarfs equity volatility. CME Group’s research puts Bitcoin’s daily standard deviation at roughly three to five times the S&P 500’s; other analyses estimate Bitcoin’s annualized volatility in the rough range of 60–80%, against roughly 15–20% for the S&P 500 — call it a four-times multiplier as a round-number approximation [source: CME Group, “Why Is Bitcoin Moving in Tandem with Equities?”, 2025; general market-volatility comparisons consistent with that framing]. The practical translation: a period of elevated correlation does not mean Bitcoin moves similarly to stocks — it means Bitcoin tends to move in the same direction as stocks, but by a substantially larger amount. A 2% S&P 500 move associated with a 6–10% Bitcoin move in the same direction is amplification, not diversification — during a stress window, a “correlated” Bitcoin position doesn’t cushion an equity-heavy portfolio, it adds volatility on top of the same directional risk.
Correlation Is Not a Constant: Four Readings, Five Months, Wildly Different Numbers
Here’s where a lot of correlation commentary goes wrong: it quotes one number as if it were a fixed physical property of the asset, like Bitcoin’s supply cap. It isn’t. Correlation is a statistic computed over a specific trailing window, and the reading changes — sometimes dramatically — depending on which window you use and which specific week you check. Consider four real, independently reported readings from roughly a five-month stretch spanning late 2025 into March 2026:
- December 2025: correlation readings across different timeframes were reported in the 0.50 to 0.88 range — solidly in “moving together” territory by any reading [source: general market correlation tracking consistent with the brief’s head-start research and cross-referenced coverage].
- Late 2025 into early 2026: the 30-day rolling correlation actually turned negative, dropping to roughly −0.30 — the most recent sustained stretch of negative correlation in the data [source: Newhedge.io, Bitcoin/US-equities correlation tracker].
- March 2026: the 20-week rolling correlation coefficient, which had been around −0.5, flipped to +0.13 according to Bloomberg-sourced data — a genuine regime change reported within a single data update [source: Bloomberg data, reported via MEXC Blog, March 2026].
- March 2026, same general period: a separate, 30-day rolling correlation reading hit 0.74, described as the highest reading of the year to that point, with some intraday r² readings touching roughly 0.94 during specific stress windows — a different statistic (r², not r) measured over a shorter, more acute window, not simply “0.74 squared” or a like-for-like restatement of the 20-week number above [source: Bloomberg data, reported via Phemex market analysis, citing CME Group’s volatility framing].
Read side by side, that’s a swing from meaningfully negative to essentially zero to strongly positive, inside a period of a few months — using three different window lengths (30-day, 20-week, and intraday) that are not directly comparable to one another. This is exactly the point: anyone stating “the current correlation is X” without specifying the window and the date is, at best, oversimplifying, and at worst, cherry-picking whichever number supports the argument they already wanted to make.
Real Decoupling Episodes: Correlation Has Broken Down Before, More Than Once
If elevated correlation is the recent norm, it’s worth being equally clear that it isn’t permanent, and it has broken down completely on more than one occasion when Bitcoin had its own story to tell that had nothing to do with equity markets:
- May–June 2019: Bitcoin rallied roughly 62% on halving-anticipation dynamics while trade-war fears dragged the S&P 500 down roughly 6.5% over the same stretch — sharply negative co-movement [source: market-history correlation analysis, Phemex, cross-referenced against general 2019 price-history reporting].
- Q4 2020–Q1 2021: Bitcoin gained roughly 300% on the first wave of institutional adoption and “DeFi summer” enthusiasm, versus roughly 12% for the S&P 500 — Bitcoin moved on crypto-specific catalysts, not macro flows [source: same].
- Full year 2023: Bitcoin’s recovery from the FTX-collapse lows outpaced the S&P 500 by roughly five times (147% versus 26%), driven substantially by spot-ETF-approval speculation rather than general risk appetite [source: same].
- March 2023 regional-banking crisis: Bitcoin rallied roughly 40% in about three weeks while U.S. regional bank stocks collapsed — a sharp, sustained negative correlation window, and arguably the closest real-world example to date of Bitcoin behaving the way the “digital gold, flight-to-safety” thesis predicts [source: general market-history reporting on the March 2023 banking crisis and Bitcoin’s price action during it].
The pattern across all four episodes is the same: correlation breaks down specifically when something crypto-native — a halving narrative, an adoption wave, an ETF-approval catalyst, or a crisis of confidence in traditional financial institutions specifically — overwhelms the shared macro-liquidity signal that otherwise ties Bitcoin and equities together. It is not that correlation “always breaks eventually” in some predictable way; it’s that a strong enough crypto-specific catalyst can and has overridden the macro relationship, repeatedly, in both directions.
A Real, Recent Example of the “High Correlation” Story Not Holding
The clearest illustration of why a single correlation number shouldn’t be treated as predictive is what happened in the most recently completed quarter as of this writing. In Q2 2026 (April–June), the S&P 500 rose approximately 15% — its best quarterly performance since 2020 — and the Nasdaq Composite gained roughly 27.5%, its strongest quarter in four years. Bitcoin fell approximately 14% over the same quarter [source: VaaSBlock, “Bitcoin Fell 14% as S&P 500 Logged Its Best Quarter Since 2020,” published July 1, 2026, citing Q2 2026 market data].
That’s a genuinely large, real divergence — and it’s worth being precise about what it does and doesn’t show. It does not show that Bitcoin and stocks are now permanently uncorrelated, or that correlation “was wrong.” What it shows is exactly the theme of this article: a correlation reading measured over one window tells you about that window, not the next one. A quarter that looked, on paper, like exactly the kind of broad “risk-on” environment in which a highly-correlated, high-beta Bitcoin would be expected to outperform equities instead saw Bitcoin decline while equities — particularly AI-infrastructure-linked technology names — rallied sharply. Reported explanations for the divergence include a rotation of speculative institutional capital toward AI-infrastructure equities specifically, alongside notable spot Bitcoin ETF outflows during the same quarter [source: same]. Whether that specific dynamic persists, reverses, or was a one-quarter anomaly is not something this article — or any correlation statistic — can tell you in advance; it’s simply the most recent, concrete illustration of why “Bitcoin is highly correlated with stocks right now” is a description of a measured past window, not a rule for what next quarter will do.
The Multiplier, Multiplied
This article states both halves of one number and never puts them together. It reports a correlation — roughly 0.2 over eleven years, and readings running from −0.30 to 0.88 inside five months — and, in the same section, that Bitcoin’s volatility runs three to five times the S&P 500’s. A correlation says whether two things move in the same direction. The volatility ratio says by how much. Multiplying them is the standard way to turn the first into an expected size of move, and doing it changes what two of the article’s own claims mean.
What “Amplification, Not Diversification” Is Actually Worth
The article illustrates amplification with a 2% S&P day and a 6–10% Bitcoin move. That range is exactly the stated 3×-to-5× volatility ratio applied to 2%: the correlation never enters it.
| Correlation assumed | Beta at 4× | On a 2% S&P day |
|---|---|---|
| 1.00, implied by the 6–10% figure | 4.00 | 8.00% |
| 0.25, where beta reaches 1.00 | 1.00 | 2.00% |
| 0.20, the long-run figure above | 0.80 | 1.60% |
The 6–10% band describes a perfectly correlated Bitcoin. At the article’s own long-run 0.2, the expected co-move on a 2% S&P day is 1.60% — smaller than the S&P’s own move, and 3.75× to 6.25× below the band the article prints. Beta crosses 1.00 at a correlation of 0.25 (0.20 if the multiple is 5×, 0.3333 if it is 3×), so the headline 0.2 sits just under the line. On the eleven-year figure this article opens with, Bitcoin is a below-1 beta to the S&P 500 — which is the opposite of “a leveraged tech stock,” and shows that phrase to be a claim about recent windows rather than about the long-run average.
One thing that arithmetic does not say: that Bitcoin is calm. Its standalone volatility is still three to five times the S&P’s at every row above. A beta below 1 means only that little of that movement is S&P movement — the rest of it is still there, arriving for its own reasons. Low beta and high volatility are perfectly compatible, and confusing the two is the mirror image of the mistake the article is warning about.
Five Months of Readings, Converted
The article lists four independently reported readings spanning a few months and observes that they disagree. Converted into expected size of move, the disagreement is larger than it looks as a list of decimals.
| Window and date | r | Beta at 4× |
|---|---|---|
| Dec 2025, band low | 0.50 | 2.00 |
| Dec 2025, band high | 0.88 | 3.52 |
| Late 2025–early 2026, 30-day | −0.30 | −1.20 |
| Mar 2026, 20-week | 0.13 | 0.52 |
| Mar 2026, 30-day | 0.74 | 2.96 |
A correlation span of 1.18 becomes a beta span of 4.72 — from a position expected to move against the S&P by more than the S&P itself moved, to one expected to move with it by three and a half times. “Leveraged tech stock” means beta above 1, and that is true of three of these five readings and false of the other two, inside the same five months.
There is a second, quieter result here. The input the article hedges is the volatility multiple: three to five times, call it four. The input it presents as a measured fact is the correlation. Yet at the highest reading, the entire 3×-to-5× band spans only 1.48 beta points, while the five-month spread of readings spans 4.72 — 3.19× wider. Choosing which window to quote does more than three times as much work as choosing the volatility multiple, which is the article’s cherry-picking warning stated as a ratio.
The Ceiling, and Which Episodes Break It
Because a correlation cannot exceed 1, beta cannot exceed the volatility ratio — 4.00 at the round multiple. That is a hard ceiling on how far two assets can move apart and still have the gap described by a correlation at all. The article lists four episodes; put against the ceiling, they are not one kind of event.
| Episode | Bitcoin | Benchmark | r needed |
|---|---|---|---|
| May–Jun 2019 | +62% | −6.5% | −2.38 |
| Q4 2020–Q1 2021 | +300% | +12% | 6.25 |
| Full year 2023 | +147% | +26% | 1.41 |
| Q2 2026 | −14% | +15% | −0.23 |
Three of the four sit beyond the ceiling. The 2019 halving rally would need a correlation of −2.38, 2023 would need 1.41, and the 2020–21 stretch would need 6.25 — more than six times what any correlation can supply. The verdict survives the article’s own uncertainty: even at the most generous 5× multiple, all three still require a correlation past ±1.00. These are the episodes the article attributes to crypto-native catalysts — halving anticipation, an adoption wave, ETF-approval speculation — and the arithmetic puts a boundary under that explanation. When one of those catalysts is driving, the gap between Bitcoin and equities is not a weak correlation; it is bigger than the correlation model can express in either direction.
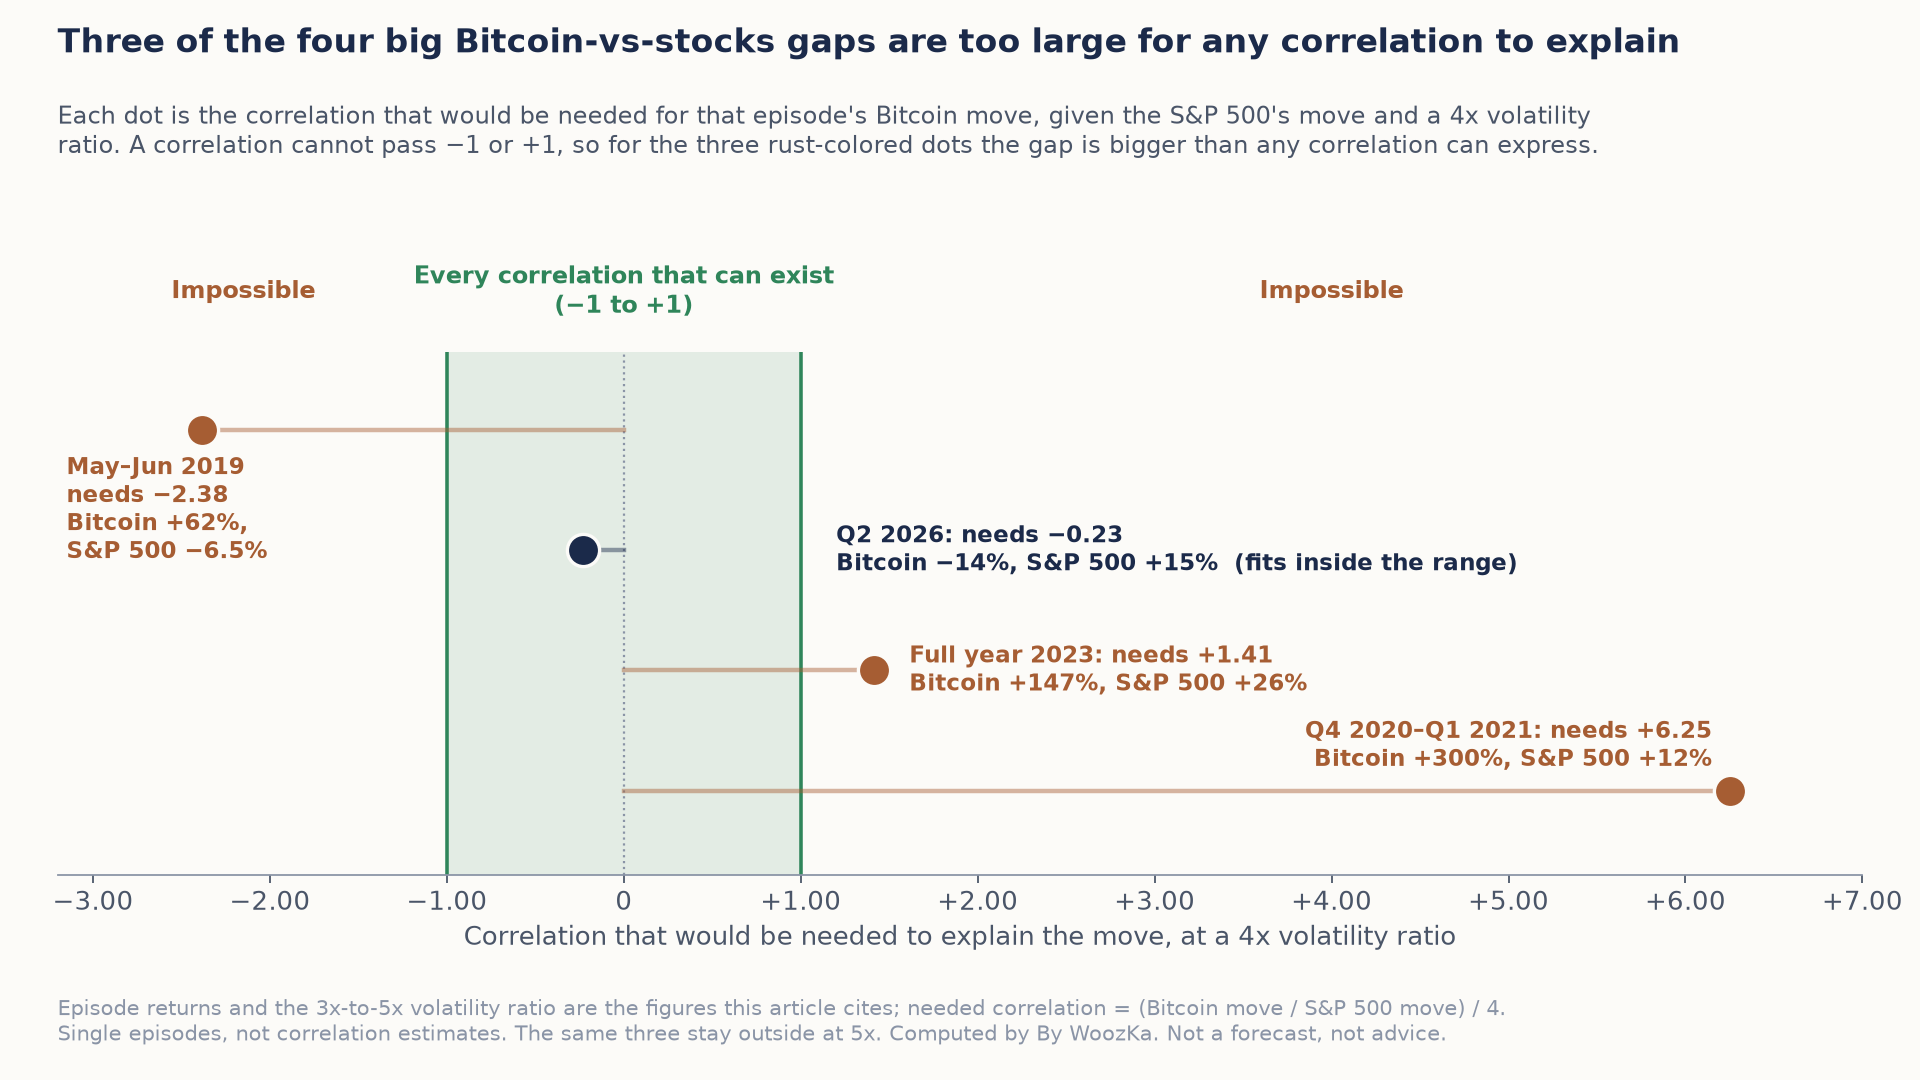
A correlation can never pass minus 1 or plus 1. Three of the article’s four episodes would need one that does, so those gaps are bigger than the correlation model can express; Q2 2026 fits comfortably inside.
The fourth row is the one worth pausing on. Q2 2026 — the quarter the article presents as its clearest illustration — needs only −0.23, which is 23.3% of the way to the ceiling and lands close to the −0.30 the article itself reports from a 30-day window a few months earlier. Measured this way it is the mildest of the four, not the sharpest: a reading well inside a regime the same article had already documented, rather than a breakdown of the relationship. Against the Nasdaq’s +27.5% over the same quarter it is milder still, at −0.13. That does not weaken the article’s point — it sharpens it. The quarter did not need anything exotic to happen. It only needed the correlation to be near the low end of a range the article had already published, which is exactly what “a correlation reading describes its window and not the next one” means in practice.
Where the correlation and volatility numbers come from, and how far they reach. Every input above is a figure this article already publishes and sources — the roughly 0.2 long-run correlation, the three-to-five-times volatility ratio and the 60–80% against 15–20% annualized figures behind it, the four dated readings, the 2%-to-6–10% illustration, the four episodes’ returns, and the Q2 2026 S&P, Nasdaq and Bitcoin figures — and the code behind the tables checks each of those published values before it reports a single figure. As a control it recomputes the article’s own arithmetic: a 6–10% move on a 2% day is exactly 3× to 5×, and the annualized bands independently reproduce that same 3×-to-5× range. The only relationship used is beta = correlation × volatility ratio, a single multiplication; the tables use the article’s round 4× multiple, and every conclusion was rechecked at both ends of the 3×-to-5× band. The episode rows are single observations, not correlation estimates — a correlation is computed over many periods and cannot be estimated from one pair of returns. What one pair does establish is a bound: if the ratio of the two moves exceeds the volatility ratio, no correlation could have produced that expected co-movement, and that is the whole of what the “r needed” column claims. A relationship measured on daily returns need not hold over a quarter or a year, and these episodes run from three weeks to twelve months, so the rows compare what happened against what the stated relationship would imply rather than measuring anything. No calculator on this site computes a correlation, a beta or a standard deviation, so nothing here comes from a shipped tool and none is linked. Nothing above forecasts a price, recommends a position or names an allocation — sizing is left to the position-sizing article this piece already points to — and the correlation readings are point-in-time figures the article itself says change, a limit these tables inherit.
What This Actually Means for a Reader, Not a Trader
None of the above is a case for or against holding Bitcoin, and it’s deliberately not written as one. What the data supports, without overreaching: if you’re holding Bitcoin because you expect it to reliably offset an equity downturn, the last several years of data don’t support treating that as a safe assumption — correlation has spent long stretches meaningfully positive, and “high beta to the same risk factors” describes long periods of the recent record better than “independent hedge” does. At the same time, correlation has broken down completely, repeatedly, and in both directions, on timelines nobody could have specified in advance — so treating “Bitcoin is just a leveraged Nasdaq play now, full stop” as a permanent, tradeable certainty is just as much of an overreach as the old “uncorrelated digital gold” pitch was.
The honest, boring takeaway is the same one this entire silo keeps returning to: position sizing that assumes you could be wrong about the current correlation regime — whichever direction you assumed it was — is a more durable response than trying to time a shift that has, historically, arrived abruptly and without much warning in either direction.
There’s a specific kind of surprise that shows up in portfolio-tracking apps during a sharp risk-off week: someone holding both stocks and Bitcoin as separate, supposedly-uncorrelated bets checks their accounts expecting one position to be cushioning the other, and finds both down together, one of them far more than the other. It’s a common enough experience that it’s become its own recurring lesson in crypto forums and portfolio-review threads — not because anyone did anything wrong, but because “these two things are uncorrelated” quietly stopped being true for that stretch of time, the way it has, on the data above, more than once.
Where to Go Next
- Crypto Market Cycles: How to Recognize Where We Are — the halving-cycle, dominance, and sentiment-index frameworks this cluster’s anchor article covers, with the same never-a-signal discipline applied here.
- How to Buy Your First Bitcoin Safely: A Step-by-Step Guide — the pillar this article builds on: risk management first, market-structure literacy second.
- Crypto Position Sizing: How Much of Your Portfolio Should Be Crypto? — the practical response to correlation uncertainty this article keeps pointing to.
- On-Chain Data 101: What Metrics Actually Matter? — data-driven ways to read Bitcoin’s own market conditions, separate from its relationship to equities.
If you want markets explained plainly — risk-first, never hyped, no price targets — that’s what the newsletter is for. Subscribe below.
Disclaimer: This article is educational content, not financial advice. I am not a licensed financial advisor, and nothing here is a recommendation to buy or sell any security or asset. Investing and trading involve risk, including the possible loss of the money you invest. Do your own research and consider consulting a licensed financial professional before making investment decisions. Read the full Disclaimer.
Historical and backtested results are hypothetical, carry inherent limitations, and do not guarantee future results. Figures were accurate to the best of my knowledge as of this article’s last-updated date and may have changed.
