What Is a P/E Ratio and How Do You Actually Use It?
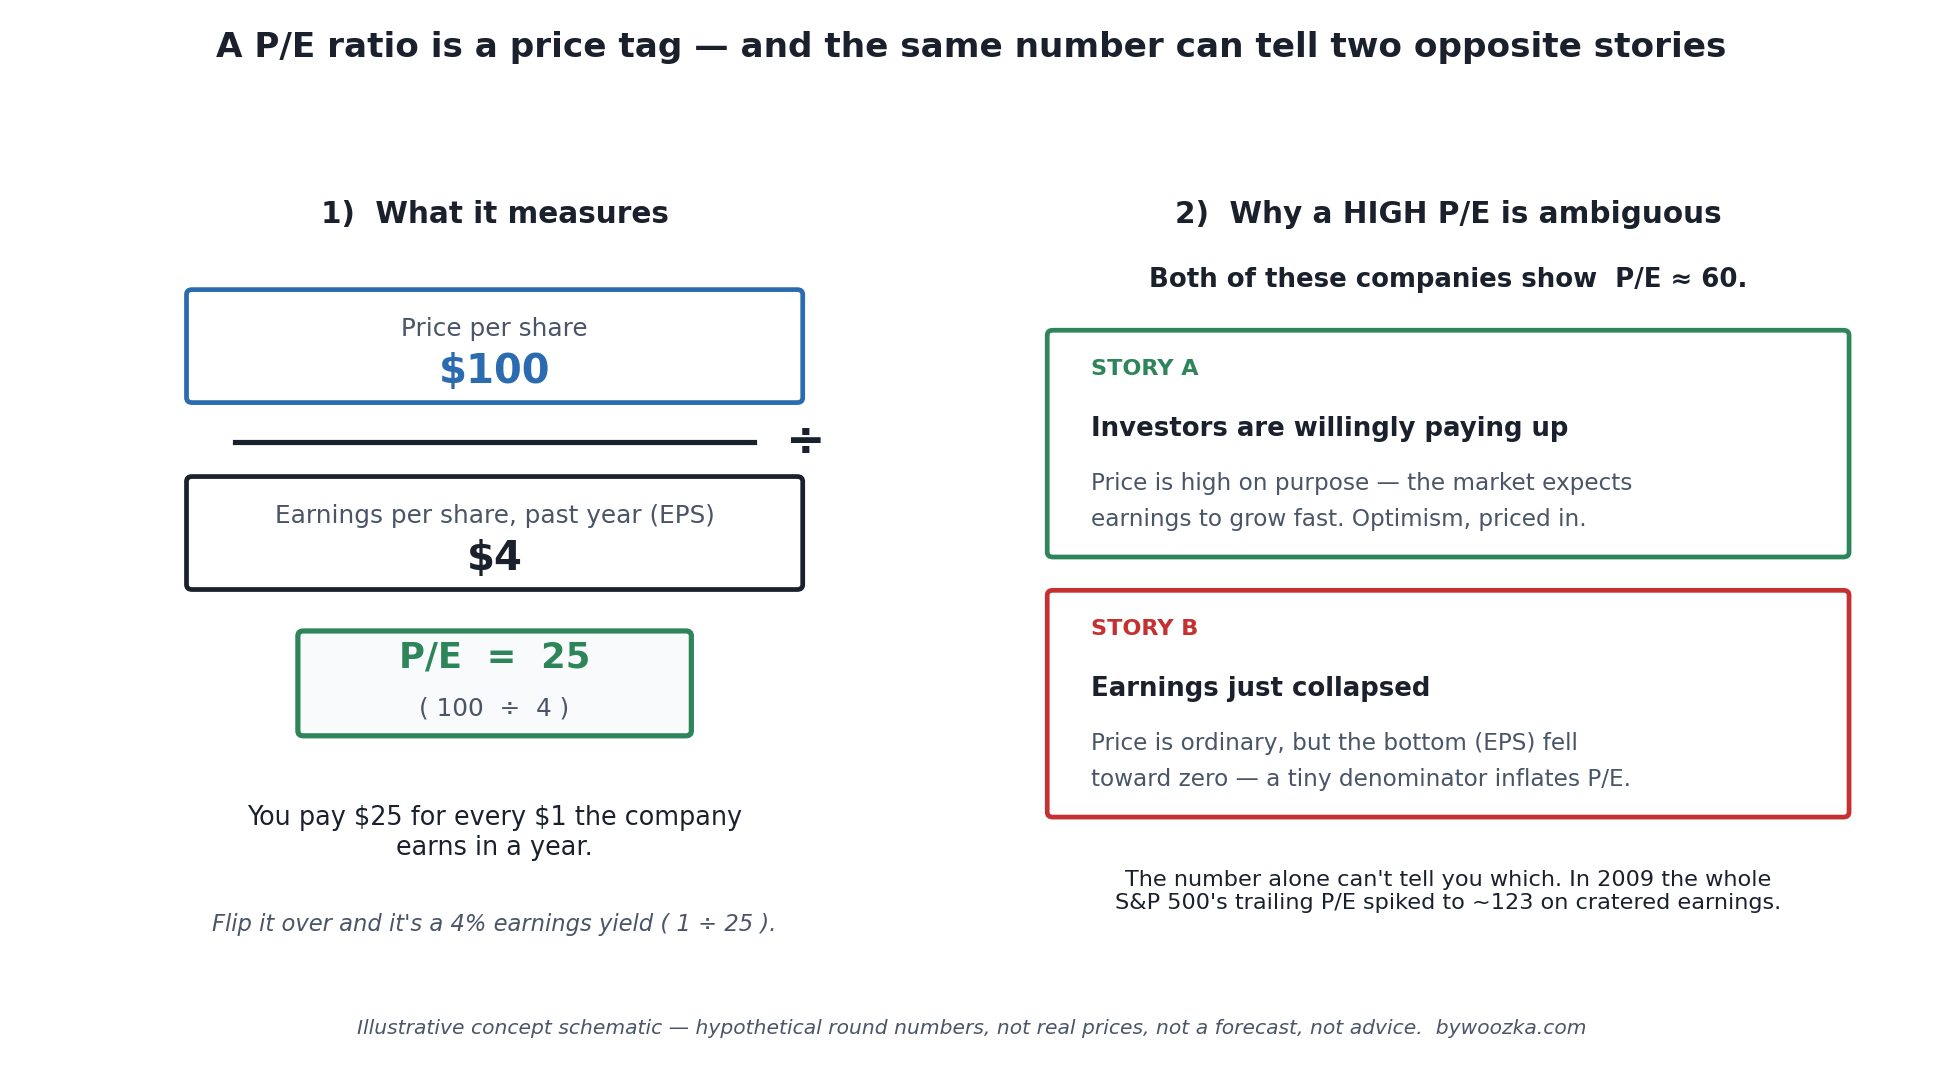
The P/E ratio is one number doing two very different jobs: it tells you the price you’re paying per dollar of earnings, and — if you read it carelessly — it fools you into thinking a high number means “expensive” and a low number means “cheap.” Both halves of that are wrong often enough to matter. Illustrative schematic, not real prices and not advice.
The price-to-earnings ratio is the most quoted number in all of stock analysis, and also the most misused. You’ll see it in every stock quote, every headline about whether the market is “overvalued,” every hot take about a company being cheap or expensive. It looks like a grade — a single figure that tells you whether a stock is a good deal. It isn’t, and treating it that way is one of the most common and most expensive beginner mistakes.
This guide explains what the P/E ratio actually is, the two versions you’ll run into, why a high or low number tells you far less than it seems to, what a “normal” P/E even looks like as of 2026, and — most importantly — how to use it as a question worth investigating rather than an answer that grades a stock for you. If you haven’t opened an account yet, start with the pillar for this section, How to Open Your First Brokerage Account, because everything here assumes you’re looking at real stock quotes.
What a P/E Ratio Actually Is
The P/E ratio is simply the price of one share divided by the company’s earnings per share (EPS) — the profit the company made, split across all its shares [source: U.S. Securities and Exchange Commission investor education / Investopedia, “Price-to-Earnings (P/E) Ratio”]. A stock trading at $100 with EPS of $4 over the past year has a P/E of 25. You can also compute it as the company’s total market value divided by its total profit — same ratio, bigger numbers.
The most useful way to read that number is as a price tag: a P/E of 25 means you’re paying $25 for every $1 the company earns in a year. Put differently, if the company’s earnings never grew and it paid all of them out to you, it would take about 25 years of earnings to get your purchase price back. That’s the intuition the featured schematic captures on the left.
Flip the ratio upside down and you get its quiet cousin, the earnings yield: EPS divided by price, expressed as a percentage. A P/E of 25 is a 4% earnings yield (1 ÷ 25); a P/E of 10 is a 10% earnings yield. The earnings yield is handy because it puts a stock on the same footing as a bond yield or a savings rate — it’s the same information wearing more familiar clothes.
Trailing vs Forward: Two Different Numbers With the Same Name
Here’s the first trap, and it’s a subtle one: “the P/E ratio” is actually two different numbers depending on which earnings you use.
Trailing P/E uses the company’s actual earnings over the last twelve months (often written “TTM,” trailing twelve months). It’s backward-looking but real — it happened, it’s reported, it’s audited [source: Investopedia, “Trailing Price-to-Earnings (Trailing P/E)”].
Forward P/E uses estimated earnings for the next twelve months — analysts’ forecasts of what the company will earn [source: Investopedia, “Forward Price-to-Earnings (Forward P/E)”]. Because a growing company is expected to earn more next year, its forward P/E is usually lower than its trailing P/E, which can make a stock look cheaper than the trailing number suggests. The catch is right there in the word estimated: forward P/E is only as good as the forecast, and forecasts are routinely too optimistic — especially for the exciting companies people most want to buy. A low forward P/E built on rosy assumptions is not the same as a low price.
Neither number is “the right one.” The honest move is to know which one you’re looking at, and to treat a forward P/E as a projection, not a fact.
The Number That Fools Beginners
Now the big one — the misconception the right-hand panel of the schematic is built to correct. A high P/E does not mean a stock is “expensive,” and a low P/E does not mean it’s “cheap.” The ratio is a fraction, and a fraction can move for reasons that have nothing to do with whether you’re getting a good deal.
Think about what makes a P/E high. It can be high because the price (the top of the fraction) is elevated — investors are willingly paying up because they expect earnings to grow quickly. That’s Story A in the schematic: optimism, priced in. A fast-growing company can carry a P/E of 40, 60, even higher, and still turn out to have been reasonably priced if the growth shows up. Amazon famously traded at eye-watering P/E ratios for years while it was reinvesting everything into growth.
But a P/E can also be high because earnings (the bottom of the fraction) collapsed. That’s Story B. If a company’s profit falls close to zero, the tiny denominator sends the ratio through the roof even though the price is ordinary or even depressed. The cleanest real-world example is the entire market: in the depths of the 2008–2009 financial crisis, the S&P 500’s trailing P/E briefly spiked above 100 — around 120 by mid-2009 — not because stocks were expensive (it was one of the great buying opportunities in a generation), but because corporate earnings had cratered [source: multpl.com S&P 500 P/E historical data; corroborated by macrotrends and Putnam analysis of P/E behavior during recessions]. A naive “sell, the P/E is insanely high” reading would have had you selling near the bottom.
The mirror image is just as dangerous. A low P/E can mean a genuine bargain — or it can mean the market expects the company’s earnings to fall, so the “E” is about to shrink and the low ratio is a warning, not a gift. Deeply cyclical companies (automakers, miners, homebuilders) often show their lowest P/E ratios right at the top of their cycle, just before earnings roll over. This is the “value trap” in a single number.
And sometimes there’s no ratio at all: a company with negative earnings has no meaningful P/E — you can’t divide a price by a loss and get anything useful, so data providers simply show “N/A.” Plenty of young, fast-growing companies fall in this bucket, which is exactly why growth investors lean on other measures.
The lesson isn’t that P/E is useless. It’s that the number by itself can’t tell you which story you’re looking at. That’s why it’s a question, not an answer.
What Does a “Normal” P/E Even Look Like?
People want a threshold — “buy under 15, avoid over 25” — and there simply isn’t an honest one. But some context helps you know when a number is unusual.
Over the long sweep of U.S. market history, the S&P 500’s trailing P/E has averaged somewhere in the mid-teens — figures around 15 to 16 are commonly cited, though the exact average depends heavily on the time period and the method [source: multpl.com S&P 500 P/E ratio historical series; Macrotrends 90-year P/E history]. As of mid-2026, the S&P 500’s trailing P/E sat noticeably above that — around 25 (roughly 24 to 26 depending on the data source and exactly how earnings are counted) [source: multpl.com and GuruFocus S&P 500 P/E, July 2026 readings — confirm current, this moves daily]. In other words, the market as a whole was priced well above its long-run norm as this was written; that’s context, not a verdict, and certainly not a prediction of what happens next.
A useful companion metric tries to strip out the earnings-collapse distortion that fooled everyone in 2009: the cyclically-adjusted P/E, or CAPE — also called the Shiller P/E after economist Robert Shiller. Instead of one year of earnings, it divides price by the average inflation-adjusted earnings of the past ten years, smoothing out booms and busts [source: Robert Shiller / Yale; multpl.com Shiller P/E]. In mid-2026 the CAPE stood around 39 to 40 — among the highest readings in more than 140 years of market history, exceeded only by the dot-com peak near 44 in late 1999 [source: multpl.com Shiller P/E; GuruFocus Shiller CAPE, July 2026 — confirm current; the reading changes with prices and with each new earnings year]. Historically, unusually high starting valuations have been associated with more modest long-run returns over the following decade — but, and this matters, that is a loose statistical tendency measured over many years, not a market-timing signal and not a forecast that a decline is near. Valuations this high have persisted for years before, and no one reliably calls the turn. Read CAPE as weather, not a clock.
The practical takeaway: a P/E only means something in comparison. Which is the whole game.
The One Refinement Worth Knowing: PEG
If a fast-growing company “deserves” a higher P/E, is there a way to put growth and price on the same scale? That’s the idea behind the PEG ratio — the P/E divided by the company’s expected earnings growth rate [source: Investopedia, “PEG Ratio”; Charles Schwab, “What Is the PEG Ratio?”]. It was devised by Mario Farina in 1969 and popularized by Peter Lynch, who ran Fidelity’s Magellan Fund from 1977 to 1990 [source: Wikipedia, “PEG ratio”; Investopedia].
The rough rule of thumb: a PEG around 1.0 suggests a stock’s P/E is roughly in line with its growth — reasonable; below 1.0 may mean you’re getting that growth relatively cheaply; above 1.0 means you’re paying a premium for it [source: Charles Schwab, “What Is the PEG Ratio?”]. So a P/E of 30 on a company growing earnings 30% a year (PEG = 1) can be more defensible than a P/E of 12 on a company growing 4% a year (PEG = 3).
Treat PEG as a sanity check, not a truth machine. Its entire back half — the growth rate — is an estimate of the future, and it inherits every bit of the optimism problem that plagues forward P/E. Garbage growth assumptions in, garbage PEG out. It’s a better lens than P/E alone, not a formula that spits out a correct answer.
Turn it upside down and it becomes a yield
The quickest way to stop a P/E fooling you is to invert it. One divided by the P/E is the earnings yield — the same fact expressed as a percentage, which puts it on the same footing as anything else that pays one:
| P/E | Earnings yield | Years of today’s earnings to repay the price |
|---|---|---|
| 8 | 12.5% | 8 years |
| 10 | 10.0% | 10 years |
| 15 | 6.7% | 15 years |
| 20 | 5.0% | 20 years |
| 25 | 4.0% | 25 years |
| 30 | 3.3% | 30 years |
| 40 | 2.5% | 40 years |
| 60 | 1.7% | 60 years |
| 100 | 1.0% | 100 years |
The third column is the second column restated: a P/E of 25 means you are paying 25 years of current earnings, and 25 is exactly 1 ÷ 0.04 — a 4% earnings yield. A P/E of 20 is exactly 5%. Doubling the P/E halves the yield, always.
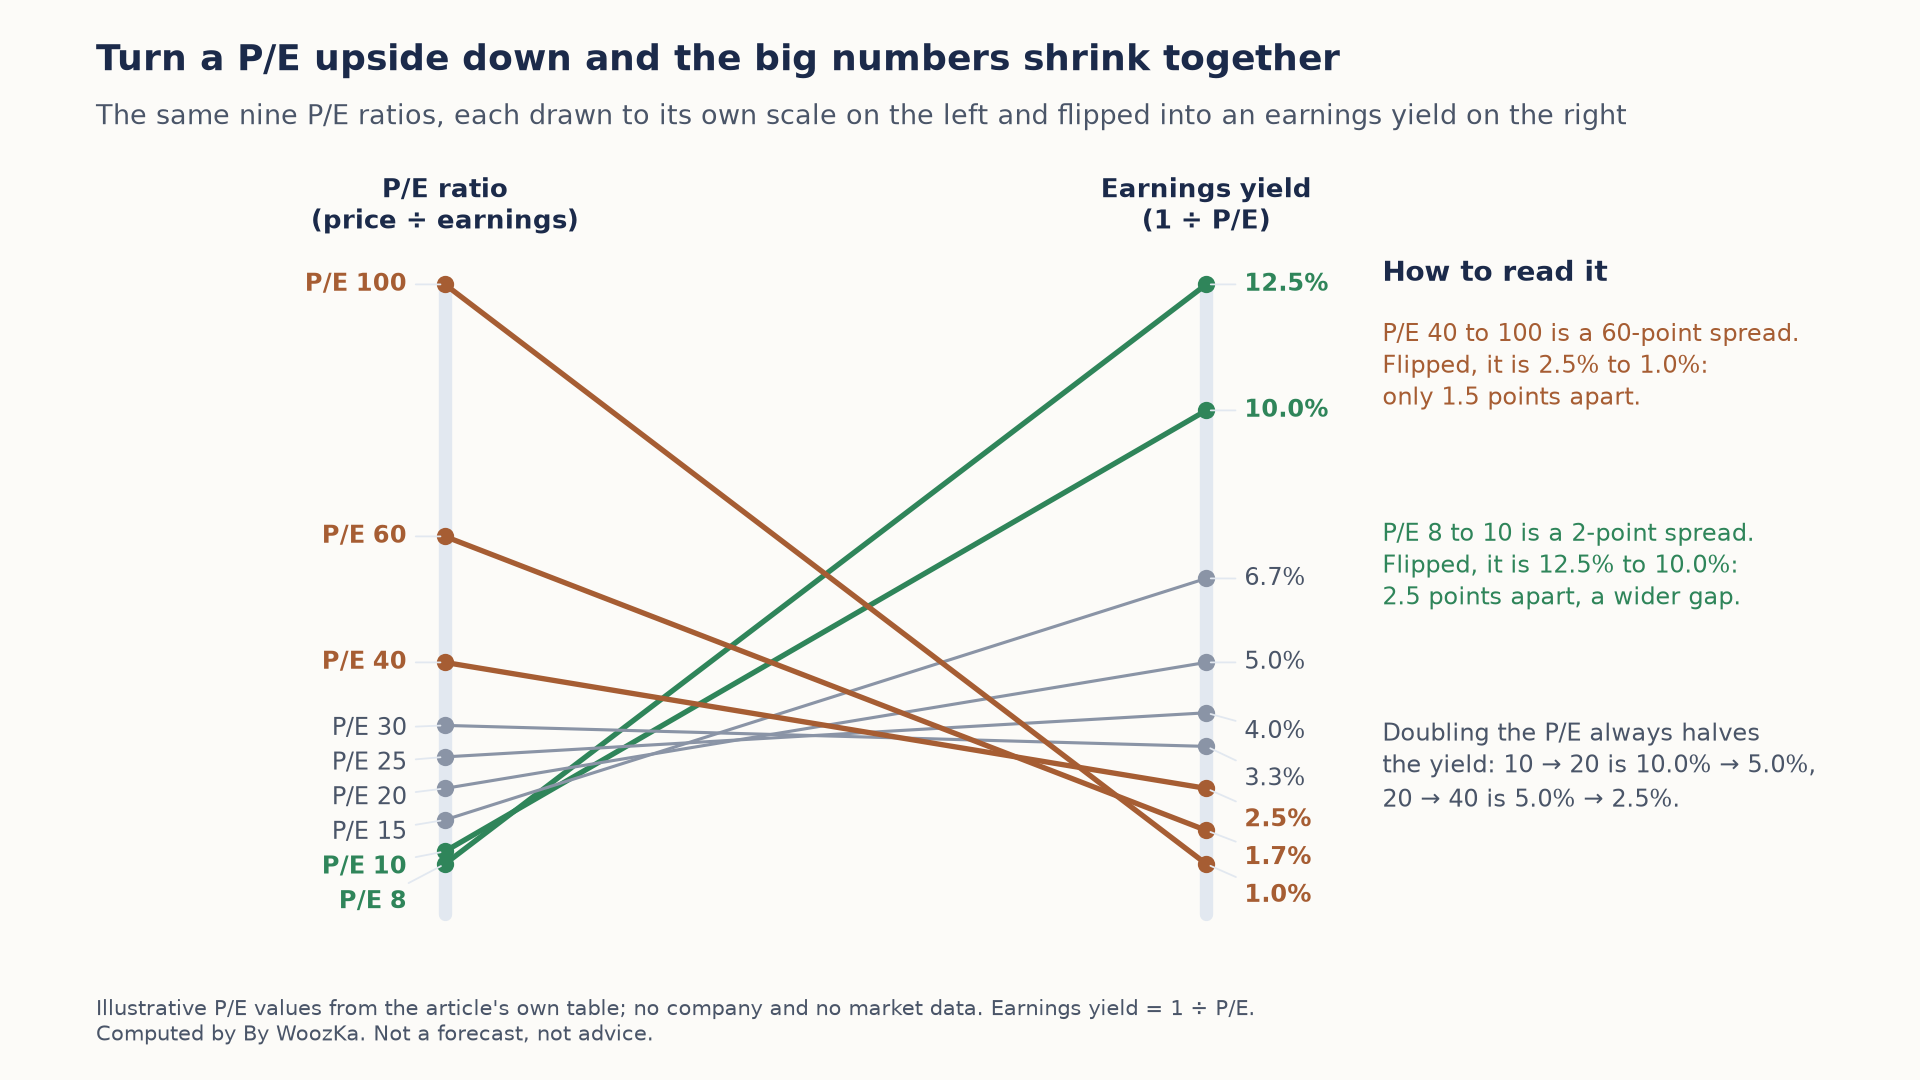
High P/E ratios that look far apart turn into yields that sit close together near zero, while low P/E ratios that look alike turn into yields that are far apart. Reading the ratio as a yield keeps the big numbers from fooling you.
That framing makes the comparison a beginner actually wants to make possible. A P/E of 100 is a 1% earnings yield, which invites an obvious question about what else that money could earn — a question the raw ratio hides behind a number that merely looks large.
This is not a forecast and names no company. No market data is used; the ratios are inputs spanning a plausible range. Note too that the payback column assumes earnings never change, which is the one thing nobody expects.
What PEG really rests on
PEG divides the P/E by the growth rate in percentage points, and the convention treats 1.0 as the reference mark. What the formula makes plain is how completely the answer is driven by a growth number that has to be estimated:
| P/E | Growth 5% | Growth 10% | Growth 15% | Growth 20% |
|---|---|---|---|---|
| 15 | 3.00 | 1.50 | 1.00 | 0.75 |
| 20 | 4.00 | 2.00 | 1.33 | 1.00 |
| 25 | 5.00 | 2.50 | 1.67 | 1.25 |
| 30 | 6.00 | 3.00 | 2.00 | 1.50 |
| 40 | 8.00 | 4.00 | 2.67 | 2.00 |
Read across any row: the same company, the same price, and a PEG that swings from expensive to cheap purely on the growth assumption. A P/E of 40 scores 8.00 on 5% growth and 2.00 on 20%. PEG is exactly 1.0 whenever the growth rate in points equals the P/E — which is a fact about arithmetic, not about value.
Method: earnings yield is 1 ÷ (P/E) and PEG is (P/E) ÷ growth in percentage points. The script asserts the yield is the exact reciprocal at every P/E, that 25 gives exactly 4% and 20 exactly 5%, that doubling the P/E halves the yield, and that PEG is exactly 1 when growth equals the P/E.
How to Actually Use It (as a Question, Not an Answer)
Everything above points to a handful of habits that keep the P/E ratio useful and keep it from misleading you:
Compare like with like. A P/E only has meaning next to a relevant yardstick — the same company’s own P/E over its history, or the typical P/E of its own industry. Software companies structurally carry higher multiples than banks, utilities, or automakers; comparing a tech stock’s P/E to a utility’s is apples to oranges and tells you almost nothing [source: general valuation practice; Charles Schwab valuation education]. This is a category observation about sectors, not a recommendation of any of them.
Know which P/E you’re holding. Trailing (real) or forward (estimated)? If it’s forward, whose estimate, and how optimistic?
Check whether the “E” is real. A jaw-dropping P/E might just be a temporarily crushed earnings number; a suspiciously low one might be a peak-cycle earnings number about to fall. Always ask why the ratio is where it is.
Never use it as a standalone buy or sell signal. The P/E is one input among many — alongside the balance sheet, the durability of the business, debt, cash flow, and the honest limits of your own knowledge. Anyone selling you a single-number rule (“just buy low-P/E stocks”) is selling false confidence, which the research on why investors underperform suggests is exactly what hurts people most.
Used this way, the P/E ratio does real work: it frames a price, flags when something is unusual, and sends you looking for the reason. That’s a genuinely valuable tool. It just isn’t a scoreboard.
The Sane Way to Think About It
Strip away the mystique and the P/E ratio is a price tag with a footnote. The price tag part is simple — dollars paid per dollar of annual earnings. The footnote part is everything that matters: a high number can mean a beloved growth company or a business whose earnings just fell off a cliff; a low number can mean a bargain or a warning; and the “market average” shifts with the mood of the entire economy. The number never grades the stock for you. It only tells you what you’re paying, and dares you to find out whether it’s worth it.
That’s not a disappointing answer — it’s a liberating one. It means you don’t have to memorize a magic threshold or trust anyone who claims to have one. You just have to know what the ratio is measuring, ask why it sits where it does, and compare it to something relevant. Do that, and you’re already reading it more honestly than most of the headlines that quote it.
The natural next steps in this section build directly on this one: learning to read an earnings report shows you where the “E” actually comes from, and understanding the difference between trading and investing frames how much any single valuation number should drive your decisions in the first place. The weekly plain-English newsletter below is where these ideas get connected over time.
Disclaimer: This article is educational content, not financial advice. I am not a licensed financial advisor, and nothing here is a recommendation to buy or sell any security or asset. Investing and trading involve risk, including the possible loss of the money you invest. Do your own research and consider consulting a licensed financial professional before making investment decisions. Read the full Disclaimer.
Historical and backtested results are hypothetical, carry inherent limitations, and do not guarantee future results. Figures were accurate to the best of my knowledge as of this article’s last-updated date and may have changed.
