What Is APR vs APY? The Difference That Costs You Thousands
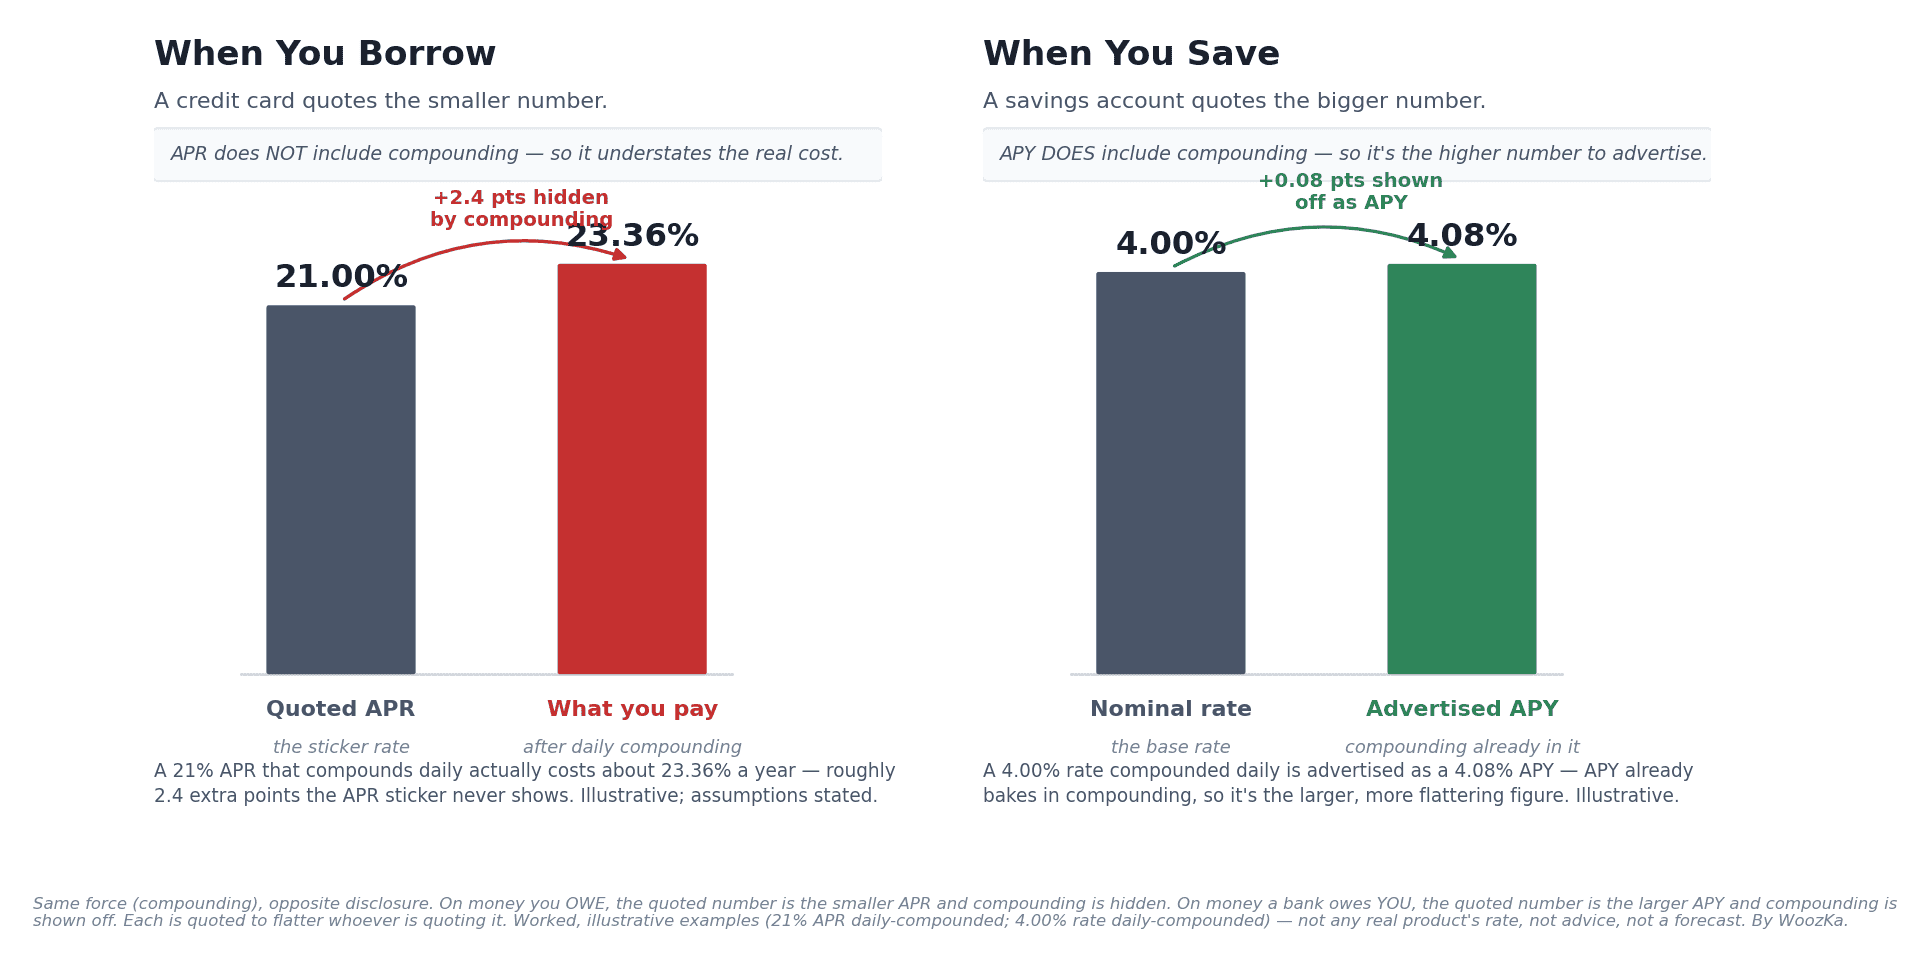 Left: a 21% credit-card APR quietly costs about 23.36% once it compounds daily — the “APR” is the smaller, more flattering number the lender puts on the sticker. Right: a 4.00% savings rate is advertised as a 4.08% APY, because APY already bakes in compounding and makes the bigger number honest to print. Same math, opposite disclosure. Both panels are illustrative examples built from the sourced figures below — not any real product’s rate, and not a recommendation.
Two of the most important numbers in your financial life differ by a single letter, and almost nobody is taught the difference. APR and APY look like typos of each other. They are not. They sit on opposite sides of the counter — one is the rate you pay to borrow, the other is the rate you earn to save — and, crucially, they are quoted using different rules on purpose. Understanding which is which, and why, is the closest thing personal finance has to a free upgrade: it costs you nothing and it stops a specific, common way that money leaks out of your accounts before you ever pick a single investment.
This is foundational money literacy, not investment advice. Nothing here tells you which card to get, which bank to use, or what to do with your money — it explains how these numbers are defined and calculated so you can run the math yourself. The tickers and institutions this cluster mentions elsewhere appear only as labeled examples, never endorsements. Let’s take the two terms one at a time, then look at the one formula that connects them.
The One-Sentence Version
APR is the rate you pay to borrow. APY is the rate you earn to save. The catch that matters is that APY includes the effect of compounding, while APR — on a credit card — generally does not.
That last clause is the whole game. Both numbers are annual percentages. But “annual percentage rate” (APR) and “annual percentage yield” (APY) are computed differently, and the difference is compounding — the effect of interest earning (or costing) you interest on top of itself. Because APY folds compounding in and a credit card’s APR does not, the same underlying interest rate can be quoted as a smaller-looking number when you’re borrowing and a bigger-looking number when you’re saving. Whoever is quoting the rate gets to pick the framing that flatters them — and, conveniently, the rules let them.
Everything below is just the detail behind that one sentence.
What APR Actually Is
APR — annual percentage rate — is a standardized, legally-required disclosure of the cost of borrowing, expressed as a nominal yearly rate.
In the United States, APR exists because of the Truth in Lending Act, implemented through the Federal Reserve’s Regulation Z [source: Truth in Lending Act / Regulation Z, via the Federal Reserve and the Consumer Financial Protection Bureau, 2026]. Any consumer lender — a credit-card issuer, a mortgage lender, an auto or personal-loan company — has to disclose an APR so that borrowers can compare the cost of credit on a common scale. On many loans, the APR is meant to be broader than just the interest rate: it can bundle in certain required costs of the loan, such as some origination fees or points on a mortgage, which is why a mortgage’s APR is often a touch higher than its quoted interest rate [source: Regulation Z; Investopedia, “APR,” 2026].
Here is the part that trips people up. For an open-end account like a credit card, the APR is calculated as a nominal annual rate — essentially the periodic rate multiplied out to a year. A card with a 21% APR applies a periodic rate to your balance each day or each month; the “21%” is that periodic rate scaled up to twelve months, without accounting for the fact that the interest itself compounds during the year [source: Regulation Z open-end credit provisions; Federal Reserve]. In other words, the APR on your card statement is the starting rate, not the effective cost once compounding is layered on. Hold that thought — it’s exactly what the featured chart’s left panel is showing.
APR is not evil, and it is not a trick in itself; it’s a genuinely useful, mandated, apples-to-apples disclosure. The problem is only that most people read it as the whole story when, for revolving credit, it’s the smaller half of it.
What APY Actually Is
APY — annual percentage yield — is the standardized disclosure for deposit accounts, and unlike a card’s APR, it is built to include compounding.
APY comes from a different law: the Truth in Savings Act, implemented through Regulation DD [source: Truth in Savings Act / Regulation DD, via the Federal Reserve and the CFPB, 2026]. When a bank advertises a savings account, money-market account, or certificate of deposit, it must quote an APY calculated by a standardized formula so that accounts which compound at different frequencies can be compared on equal footing. One account might compound interest daily and another monthly; APY is specifically designed so you don’t have to do that math yourself — it reflects “the total amount of interest paid on the account, based on the interest rate and the frequency of compounding” over a 365-day year [source: Regulation DD, Appendix A; Federal Reserve, Reg DD compliance guide].
That’s the elegant part of the system: APY is genuinely the honest, all-in number for savings. If a savings account says 4.08% APY, that figure already has compounding baked into it, and you can compare it directly against any other account’s APY.
The asymmetry is the whole point of this article. On the borrowing side, the mandated number (APR) excludes compounding, so it’s the smaller number. On the saving side, the mandated number (APY) includes compounding, so it’s the bigger number. Same mathematical force — compounding — disclosed in whichever direction makes the quoting institution look best.
The One Formula That Connects Them
The bridge between a nominal rate and its compounded, effective rate is a single formula, and it’s worth seeing once because it makes the whole APR-vs-APY relationship concrete.
APY = (1 + r ÷ n) ^ n − 1
where r is the nominal annual rate (as a decimal) and n is the number of compounding periods per year.
That’s it. Plug a nominal rate and a compounding frequency in, and out comes the effective annual rate — what the money actually costs or earns over a full year. Compound more often (bigger n) and the effective rate creeps up, because you’re earning or paying interest on interest more frequently.
Worked example — the borrowing side. Take that 21% credit-card APR and let it compound daily, which is how most credit cards actually work (n = 365):
APY = (1 + 0.21 ÷ 365) ^ 365 − 1 = 0.2336, or about 23.36%.
So a card advertised at a 21% APR has an effective annual cost of roughly 23.36% once daily compounding is included — about 2.4 percentage points higher than the sticker [author’s own calculation; illustrative, assumes the balance is carried a full year with no payments]. If you carried a $1,000 balance for a year at that rate and made no payments, you’d owe about $233.60 in interest, not the $210 the “21%” might suggest [author’s own calculation; illustrative]. The extra $23.60 is compounding doing its quiet work — and it’s the part the APR number never showed you.
Worked example — the saving side. Run the same formula on a 4.00% savings rate compounded daily:
APY = (1 + 0.04 ÷ 365) ^ 365 − 1 = 0.0408, or about 4.08%.
Here the bank shows you the 4.08% — because on the saving side, the bigger compounded number is the flattering one, so the rules and the marketing point the same way. These are illustrative figures using assumed rates, not a quote for any real card or account; the point is the mechanism, not the specific numbers.
Why the Same Math Gets Disclosed Two Opposite Ways
Put the two examples side by side and the design of the system becomes obvious: institutions quote whichever version of the rate looks best for them, and the disclosure rules happen to allow it.
When a lender is charging you, the smaller-looking number — the APR that leaves compounding out — is the one on the offer. When a bank is paying you, the bigger-looking number — the APY that folds compounding in — is the one in the ad. It’s not that anyone is lying; both APR and APY are honest, legally-defined figures. It’s that the choice of which standard applies consistently favors the institution. That is the single most useful thing to internalize from this whole topic, and it’s what the featured chart above is built to show at a glance.
Once you see it, you read every rate differently. A “low” APR on a card is lower than what you’ll actually pay. A “high” APY on savings is already the fully-loaded figure, so it won’t grow beyond itself the way a nominal rate would. Neither surprises you anymore.
The Credit-Card Side, in Real Dollars
Because a card’s APR understates the real cost, a carried balance is one of the most expensive things a household can own — and it’s expensive in a very specific, checkable way.
As of the first quarter of 2026, the average interest rate across all US credit-card accounts was about 21%, according to the Federal Reserve’s G.19 Consumer Credit release; for accounts actually being charged interest, the average was a bit higher, around 21.5% [source: Federal Reserve Statistical Release G.19, Q1 2026 — confirm current, this figure moves with the Fed’s rate decisions]. Those are averages used here to make the math concrete, not a quote for any particular card, and your own rate could be well above or below them. Whatever your rate, the lesson from the formula holds: the effective annual cost of carrying a balance is meaningfully higher than the APR on the statement, because it compounds.
This is where APR literacy stops being trivia and starts being money. Paying down a high-rate balance has an unusual property: the interest you avoid is certain. If a balance is costing you an effective ~23% a year, then every dollar you put toward it locks in a guaranteed saving of that ~23% — a certain outcome, unlike any market return, which is uncertain. That’s simply the arithmetic of the trade-off between paying down high-rate debt and doing other things with the money; it is not an instruction to do one or the other, and your situation, your other goals, and your peace of mind all belong in that decision. For the fuller framework on which debts are worth carrying and which aren’t, see Good Debt vs Bad Debt, and for why a carried balance sits on the wrong side of your personal ledger, see Assets vs Liabilities. The dedicated deep-dive on the minimum-payment trap — with a full worked payoff schedule — is its own article in this cluster.
The Savings Side — Reading an APY Honestly
On the saving side the APY is the honest, all-in number — but three practical caveats keep you from reading too much into it.
First, an advertised APY usually assumes the rate stays put and that you keep the money in the account for the full year. Many savings and money-market rates are variable and can change the day after you open the account, so today’s APY is a snapshot, not a promise about next year.
Second, watch for promotional or introductory APYs — a headline rate that applies only for a few months, or only up to a balance cap, before dropping to something ordinary. The APY is real; the duration is the fine print.
Third, and most importantly for a long-term saver, a savings APY is competing against inflation. If an account pays 4% APY while prices rise 3%, your money’s real growth is closer to 1% — and if inflation runs above your APY, idle cash quietly loses purchasing power even as the balance ticks up. That’s the honest counterweight to holding cash, and it’s exactly why an emergency fund is sized as enough, not maximized, and why long-term money generally isn’t left sitting in savings. For the mechanics of that erosion, see What Is Inflation, Really?; for why both card rates and savings rates move together when the Fed acts, see Why Interest Rates Move Markets.
None of this makes a high APY bad — a competitive APY on cash you need to keep liquid is genuinely useful. It just means the number is a starting point for a decision, not the decision itself.
The Arithmetic Behind “Costs You Thousands”
This article’s title makes a dollar claim, and so far the page has shown you $23.60 — the one-year gap on a $1,000 balance. That is the honest number for one year at one balance, and it is nowhere near “thousands.” The gap is worth following, because it does reach thousands, and where it does is more specific and more useful than the headline suggests. Everything below runs this article’s own illustrative figures — the 21% average card APR, the 4.00% savings rate, daily compounding, the single formula above — through computeCompound, the function behind the Compound Growth Calculator this article already links, so every row is reproducible in your browser.
Where the Thousands Actually Are
Extending past one year needs a definition of what “the APR suggests,” and the fair one is not simple interest — it is compounding at the quoted rate, once a year. That credits you with understanding compounding and isolates the only thing in dispute: the frequency the disclosure leaves out. The test that this is the article’s model and not a new one is the first row, which has to reproduce the $233.60, the $210 and the $23.60 already published above. It does.
| Years carried | True cost | As quoted | Hidden gap |
|---|---|---|---|
| 1 | $233.60 | $210.00 | $23.60 |
| 2 | $521.78 | $464.10 | $57.68 |
| 3 | $877.27 | $771.56 | $105.71 |
| 5 | $1,856.79 | $1,593.74 | $263.05 |
| 10 | $7,161.24 | $5,727.50 | $1,433.74 |
A $1,000 balance carried for a decade with no payments hides $1,433.74 — the title’s “thousands,” reached in year nine. That is an arithmetic horizon, not a description of any real account: it assumes no payments, no fees, no rate change and no penalty rate, exactly the caveat this article’s own one-year example already carries. Raise the balance and the same threshold arrives much sooner. At $5,000 the hidden gap alone passes $1,000 in year five; at $10,000 it passes in year three, by which point the true cost is $8,772.70 against the $7,715.61 the quoted rate implies. The word in the title is doing real work — it just needs a balance or a horizon the article never named.
Where the Compounding Actually Comes From
This article says more frequent compounding always favors whoever collects the interest, which is true, and leaves it there. It is worth seeing how the gain is distributed, because the answer undercuts the villain of the piece. “Compounds daily” sounds like the mechanism. It is mostly not.
| Compounds | 21% APR | Added | 4.00% | Added |
|---|---|---|---|---|
| Annual | 21.000% | — | 4.000% | — |
| Semi-annual | 22.102% | +1.10 | 4.040% | +0.04 |
| Quarterly | 22.712% | +0.61 | 4.060% | +0.02 |
| Monthly | 23.144% | +0.43 | 4.074% | +0.01 |
| Weekly | 23.316% | +0.17 | 4.079% | +0.01 |
| Daily | 23.360% | +0.04 | 4.081% | +0.00 |
The whole distance from annual to daily compounding at 21% is 2.36 percentage points, and 90.8% of it is already collected by the time you reach monthly. Going the rest of the way — monthly to weekly to daily — adds 0.22 points, under a tenth of the total. The thing that costs you is compounding at all, not the frequency; a card that compounded monthly instead of daily would cost you almost the same. That is a more useful way to read a statement than watching for the word “daily.”
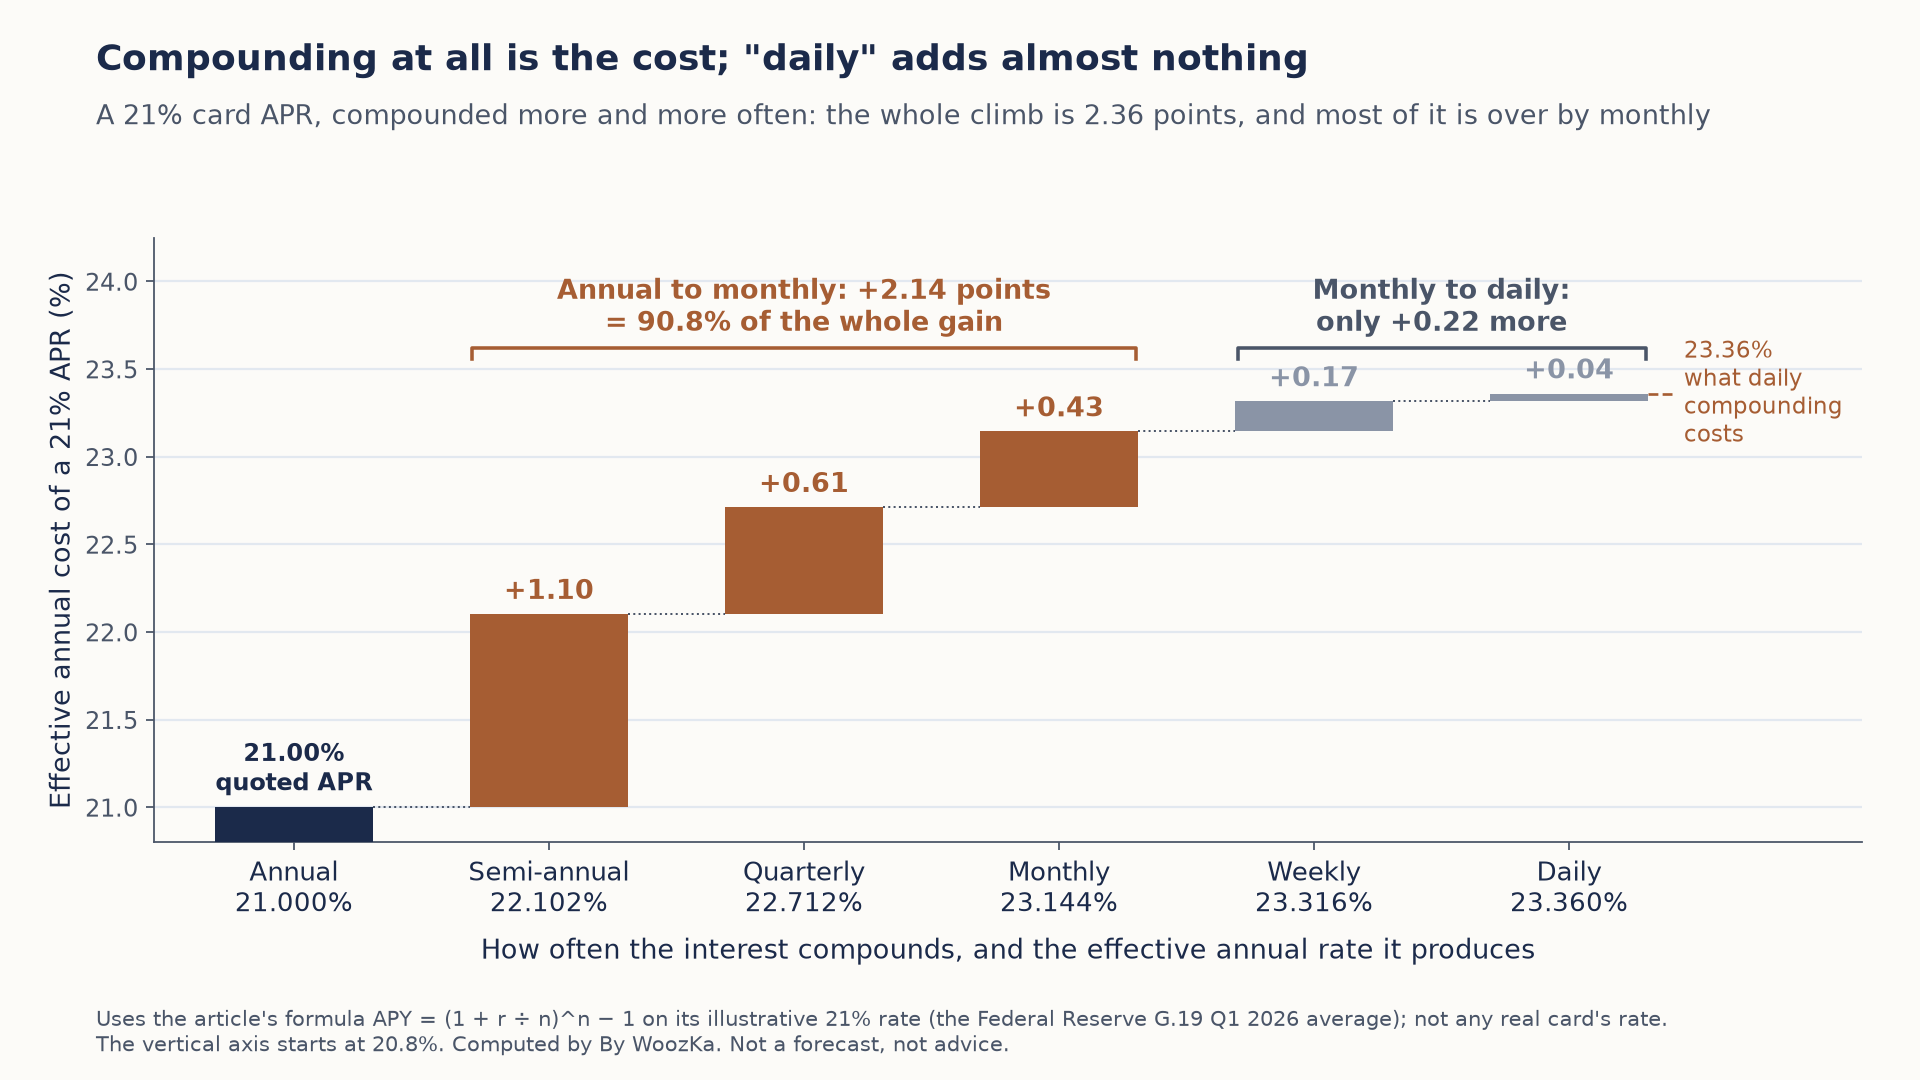 Most of the extra cost of a 21% APR is already there once interest compounds monthly; moving from monthly to daily adds only about a fifth of a point.
The right-hand columns show why this asymmetry has a second engine. Run the identical annual-to-daily move on the 4.00% savings rate and it is worth 0.081 points — about twenty-nine times smaller than the same move at 21%. Compounding frequency is close to irrelevant to a saver at ordinary deposit rates and materially expensive to a borrower at card rates, because the effect grows with the rate. The side with more to gain from frequent compounding is, once again, not you.
The Asymmetry, in One Number
The claim this article rests on is that the mandated number leaves compounding out when you borrow and folds it in when you save. That claim has never been priced on this page. Here it is, at the two rates already used above.
| Side | Number quoted | True annual rate | Hidden |
|---|---|---|---|
| Borrowing | 21.00% | 23.360% | 2.360 pts |
| Saving | 4.081% | 4.081% | 0.000 pts |
Compare the two rates as they are handed to you and the spread looks like 16.919 points. The spread you actually face is 19.280. The disclosure convention hides 2.360 points, and every one of them sits on the borrowing side — the saving row hides nothing, because APY is already the all-in figure. That is the article’s thesis as a number: the asymmetry is not that both sides are shaded, it is that exactly one side is, and it is the side where you pay. On the G.19 average for accounts actually assessed interest, 21.5%, the same arithmetic gives a true cost of 23.978% and a real spread of 19.897 points.
No rate here is a quote for a real product; here is where each one came from. Every input is this article’s own illustrative figure — the 21% and 21.5% G.19 averages, the 4.00% savings rate, daily compounding, the $1,000 balance — and none of them is a quote for any real product or a recommendation. Effective rates use this article’s own formula, APY = (1 + r ÷ n) ^ n − 1, and every dollar figure comes from computeCompound, the function behind the linked Compound Growth Calculator, so each row can be reproduced in your browser. One modeling choice is made explicit: “as quoted” means the quoted rate compounded annually, not simple interest, which is why row one matches the $210 already published above. No payments, fees, penalty rates or rate changes are modeled, and no investment return is assumed anywhere. The calculation behind these tables reports every figure above and confirms that this article’s own published numbers — 23.36%, 4.08%, $233.60, $210, $23.60, $11,268.25, $1,268.25, 12.683% and the 0.683-point gap — re-derive exactly before it reports anything.
A 30-Second Checklist for Reading Any Rate
Whenever you see a percentage attached to money — borrowed or saved — four quick questions tell you what you’re really looking at:
- Is it an APR or an APY? APR = you’re borrowing (the number probably understates the cost). APY = you’re saving (the number is already all-in).
- How often does it compound? Daily compounding on a card pushes the effective rate meaningfully above the APR. More frequent compounding always favors the side collecting the interest.
- Does it include fees? A loan’s APR may bundle certain required fees; a headline “interest rate” may not. Compare APR to APR, not APR to a bare rate.
- Is it promotional? A teaser APR (0% for 12 months) or a teaser APY (high for 3 months) tells you nothing about the rate you’ll live with afterward. Find the go-to rate.
Run those four questions and you’ve done more due diligence than most people ever do on the numbers that quietly move the most money.
The Bottom Line
APR is the rate you pay to borrow; APY is the rate you earn to save. The difference that matters isn’t the vocabulary — it’s that APY includes compounding and a credit card’s APR does not, so the same interest rate is quoted as a smaller number when you owe and a bigger number when you’re owed. One formula, APY = (1 + r ÷ n) ^ n − 1, connects them: a 21% card APR compounding daily really costs about 23.36% a year, while a 4.00% savings rate is advertised as the 4.08% it compounds to. Learn to ask which number you’re looking at, how often it compounds, whether it includes fees, and whether it’s just a teaser — and you’ve closed one of the most common, least-discussed leaks in personal finance, before you’ve invested a dollar. That’s the “secure the base” step the rest of this site builds on: understand the economic machine at the macro level, but win the small, certain battles on your own statement first.
The gap, in one line: $10,000 at 12% APR compounded monthly is $11,268.25 after a year — $1,268.25 of interest, an effective 12.683% APY. Those 0.683 points between the quoted rate and the earned rate are the compounding, and they are the whole distinction this article is about. The Compound Growth Calculator lets you change the compounding frequency and watch the APY move.
Disclaimer: This article is educational content, not financial advice. I am not a licensed financial advisor, and nothing here is a recommendation to buy or sell any security or asset. Investing and trading involve risk, including the possible loss of the money you invest. Do your own research and consider consulting a licensed financial professional before making investment decisions. Read the full Disclaimer. Historical and backtested results are hypothetical, carry inherent limitations, and do not guarantee future results. Figures were accurate to the best of my knowledge as of this article’s last-updated date and may have changed.
This is the foundation piece for the money-terminology cluster: once you can read a rate, the next questions are how big an emergency fund actually needs to be, how credit scores really work, and what a carried card balance costs in full — each its own article here. For the weekly market read this blog uses to apply the fear-and-greed rules from the Autopilot Plan, subscribe to the newsletter below and grab the money-foundations checklist.
