VTI vs VOO: Which Benchmark ETF Should You Hold for Life?
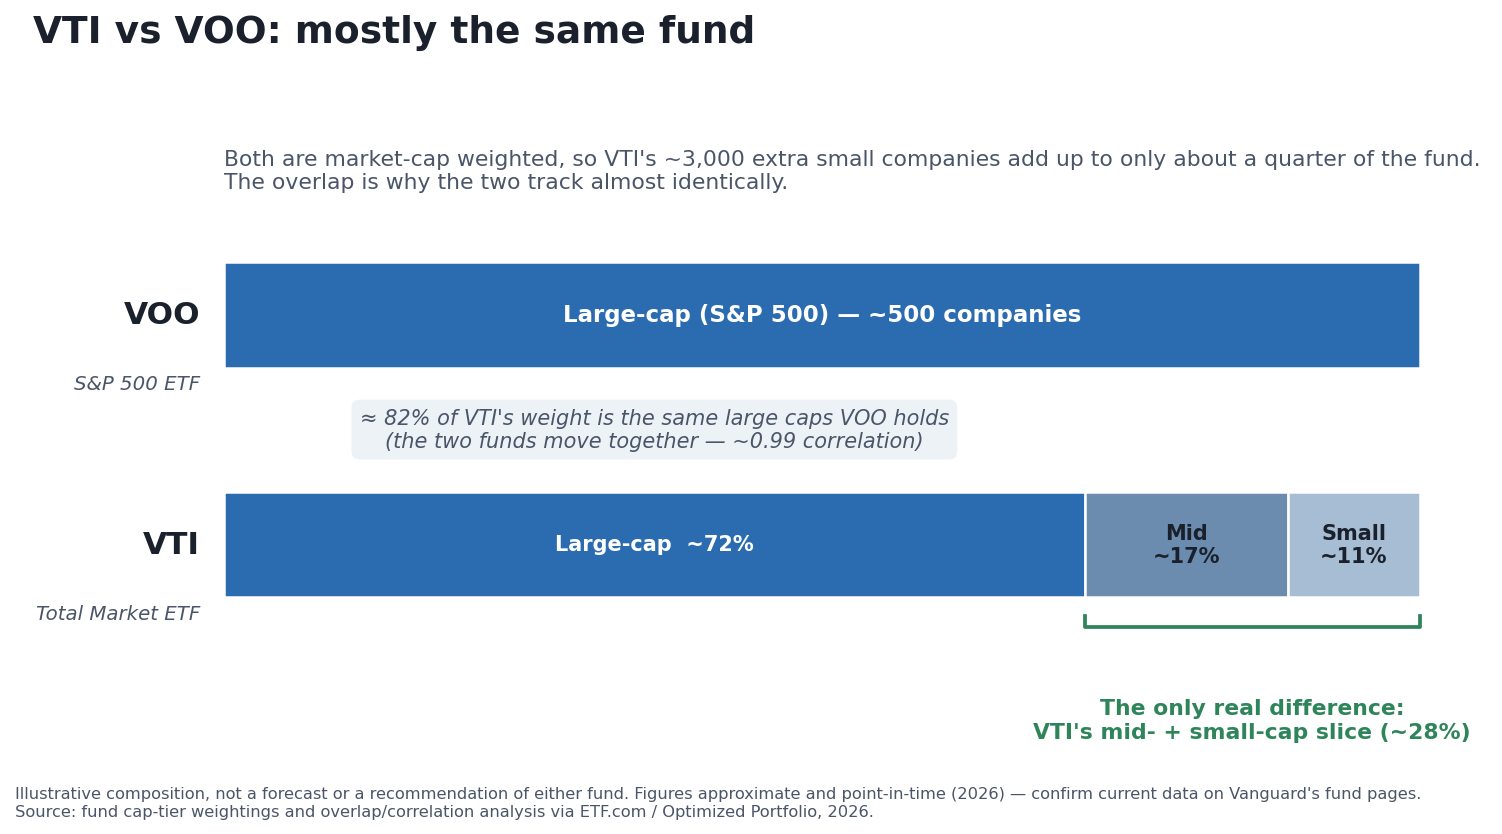
The entire VTI-versus-VOO decision comes down to one slice: VTI adds the mid- and small-cap portion (roughly the right ~28% of the bar) that VOO leaves out. The other ~72% is the same large-cap universe. Source: fund cap-tier weightings via ETF.com, 2026 — confirm current figures before you buy.
If you’ve picked a low-cost index fund as the base of a long-term plan — the approach at the center of The Autopilot Plan — you’ll quickly run into the same fork in the road almost every new index investor hits: VTI or VOO? Both are Vanguard funds, both are among the cheapest products in the entire industry, and both show up constantly as the default “just buy the market” recommendation. So which one should you hold for the next thirty years?
The honest answer is that this is one of the smallest decisions you’ll make as an investor, and the two funds are far more alike than they are different. Neither of the two is a recommendation here — they’re used throughout this article as the clearest available examples of the “broad, cheap, diversified U.S. equity” category, not as an endorsement of either ticker. The point of this piece is to show you exactly where the two differ, exactly where they don’t, and how to stop agonizing over a choice that matters far less than simply starting and staying consistent.
The Two Funds, Side by Side
VTI and VOO are both index ETFs from Vanguard that give you diversified exposure to U.S. stocks for a rock-bottom fee — the difference is how much of the market each one covers.
VOO — the Vanguard S&P 500 ETF — tracks the S&P 500, the index of about 500 of the largest U.S. companies. As of early 2026 it held roughly 500–520 constituent stocks, carried a 0.03% expense ratio, and had grown to just under $1 trillion in total net assets [source: Vanguard fund profile, VOO, 2026]. When people say “just buy the S&P 500,” VOO is one of the most common ways they mean to do it.
VTI — the Vanguard Total Stock Market ETF — tracks the CRSP US Total Market Index, which aims to capture essentially the entire investable U.S. stock market: large-, mid-, small-, and micro-cap companies. As of March 31, 2026 it held roughly 3,500 stocks, also carried a 0.03% expense ratio, and had grown to several hundred billion in total net assets [source: Vanguard fund profile, VTI, 2026]. Where VOO gives you the biggest ~500 companies, VTI gives you those same companies plus about three thousand smaller ones.
Both figures above are point-in-time snapshots. Fund holdings counts, asset levels, and even fee schedules change over time, so treat these as illustrative of the two funds’ relative shape rather than as fixed constants, and confirm the current numbers on Vanguard’s own fund pages before you act on them.
The One Real Difference: Breadth
The single structural difference between VTI and VOO is that VTI adds mid-cap, small-cap, and micro-cap companies that VOO — being a large-cap-only index — doesn’t hold at all.
Here’s the part that surprises people: adding roughly three thousand extra stocks changes the fund far less than the raw count suggests. That’s because both funds are market-cap weighted — each company’s share of the fund is proportional to its total market value — and the U.S. stock market is enormously top-heavy. The S&P 500’s large companies make up somewhere on the order of 80% or more of the total U.S. market’s value [source: fund-overlap analysis via ETF.com / Optimized Portfolio, 2026]. By cap tier, VTI’s own weighting runs roughly 72% large-cap, 17% mid-cap, and 11% small-cap [source: fund cap-tier weightings via ETF.com, 2026].
Put those two facts together and the picture is clear: about 82% of VTI’s weight is invested in the very same large-cap companies that VOO holds, with only the remaining slice spread across the thousands of smaller names [source: fund-overlap analysis via Optimized Portfolio, 2026]. Those three thousand extra holdings are real, but because each one is tiny by market value, they collectively move the needle only modestly. That’s why, on any given day, the two funds move almost in lockstep — their historical price correlation sits at approximately 0.99, about as close to perfectly-together as two different funds get [source: fund correlation analysis via ETF.com / Optimized Portfolio, 2026].
So the entire VTI-vs-VOO debate really comes down to a single question: do you want to own that extra ~18–28% slice of smaller U.S. companies, or not? Everything else about the two funds is effectively the same. That question has a bigger version. Asked about the underlying indexes rather than these two tickers — what the size bet has actually paid across different eras, and where the choice genuinely shows up in a portfolio — it is the subject of total market vs S&P 500 index funds, which is the same decision one level up.
What the Return Difference Has Actually Been
Historically, the long-run performance gap between VTI and VOO has been small and — importantly — has not consistently favored either fund.
Over the ten years ending in early 2026, VOO produced an annualized total return of roughly 15.5%, versus roughly 15.1% for VTI — a gap of about 0.4 percentage points a year in VOO’s favor [source: fund performance comparison via StockAnalysis / PortfoliosLab, 2026]. Over other multi-year windows the gap has typically stayed under half a percentage point in either direction, and has often been closer to a rounding-error 0.1–0.2 points.
The reason the gap flips direction is worth understanding, because it’s the whole story: VOO edges ahead in stretches when large-cap stocks lead the market, and VTI edges ahead in stretches when small- and mid-cap stocks lead. The past decade happened to be dominated by a handful of enormous large-cap technology companies, which is why VOO came out marginally ahead over that specific window [source: fund performance comparison via ETF.com, 2026]. In earlier eras when smaller companies outperformed, VTI’s extra breadth pulled it ahead instead. There is no reliable way to know in advance which regime the next decade will bring — and that uncertainty is precisely why the historical edge in the last ten years is not a forecast for the next ten.
Because VTI carries more exposure to smaller companies — which tend to swing harder than mega-caps — it has also historically shown marginally higher volatility than VOO [source: fund risk comparison via Forbes, 2026]. “Marginally” is the operative word: the difference in bumpiness, like the difference in return, is small enough that it shouldn’t be the thing that decides your choice.
None of these figures is a prediction. They describe what has already happened over specific historical windows, they were accurate to the best of my knowledge as of this article’s last-updated date, and they will drift as markets move. Past performance — including the last decade’s large-cap leadership — does not predict future results.
Cost: Effectively a Tie
On the single factor that most reliably predicts long-term fund outcomes — cost — VTI and VOO are essentially tied.
Both funds carry a headline expense ratio of 0.03%, which works out to about $3 a year on every $10,000 invested [source: Vanguard fund profiles, VTI and VOO, 2026]. That is among the lowest in the entire industry. For context on just how low: the older, larger SPDR S&P 500 ETF (SPY) charges 0.0945% for essentially the same S&P 500 exposure VOO offers at 0.03% [source: fund fee comparison via ETF.com, 2026]. There are a small number of S&P 500 funds priced even lower than VOO — but the gap between them is measured in fractions of a basis point, amounts that are immaterial for a normal investor’s portfolio.
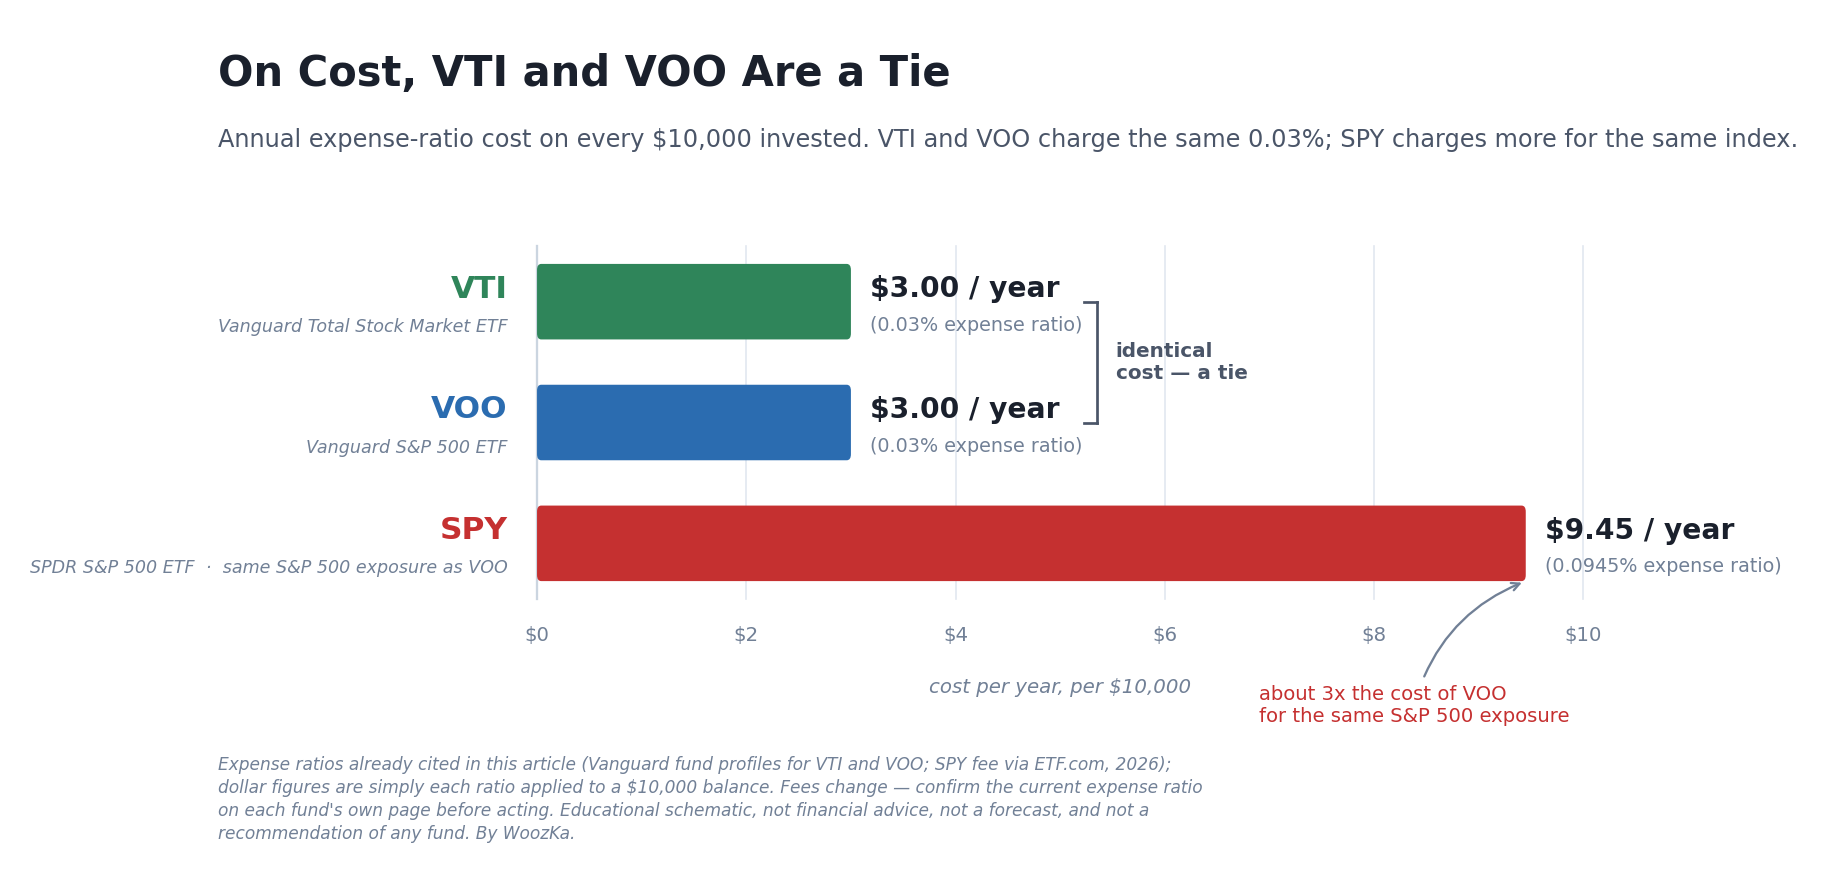
Both figures on the VTI and VOO bars are the exact same 0.03% expense ratio cited above — the dollar amounts are just that ratio applied to a $10,000 balance ($3.00/year each). SPY is shown only for scale: at 0.0945% it costs about three times as much per year for essentially the same S&P 500 exposure. Confirm current expense ratios on each fund’s own page before you act. Source: Vanguard fund profiles (VTI, VOO) and ETF.com (SPY), 2026.
One small technical nuance sometimes comes up: broad total-market funds like VTI can earn a little extra income by lending out their securities, which can nudge the fund’s effective net cost slightly below its headline ratio. This is a real but minor effect and it doesn’t change the bottom line: on cost, these two funds are a tie, and cost is not the factor that should decide between them.
A Trap to Avoid: Owning Both
Buying both VTI and VOO does not give you meaningfully more diversification — it mostly gives you overlap.
Because roughly 82% of VTI’s weight is the large-cap universe VOO holds, owning both funds means you’re holding those same top companies twice, wrapped in two different tickers. You don’t get “extra” diversification from the duplication; the only unique exposure the pairing adds is VTI’s mid- and small-cap slice, which you could get more simply by just holding VTI alone. Holding both isn’t harmful, exactly — it’s redundant, and redundancy adds complexity (two positions to track, two cost bases) without a corresponding benefit. For most people, the cleaner choice is to pick one of the two and let it be the core.
The Tie, Measured
The section above calls cost “the single factor that most reliably predicts long-term fund outcomes” and then reports that both funds charge 0.03%. Those two sentences sit next to each other without ever being multiplied together, and the result is a small contradiction with expense ratios explained, which tells readers that for two nearly-identical broad funds — naming VTI and VOO as the classic case — cost is often the sensible tiebreaker. Both cannot be acted on at once. The arithmetic settles it, and it also puts a number on three other claims this article makes and leaves unquantified.
Four Measures of Similarity, on One Axis
This article publishes four independent ways of asking how different the two funds are, in four different sections, and never lines them up.
| Measure | VTI vs VOO | Difference |
|---|---|---|
| Expense ratio | 0.03% vs 0.03% | 0.0000 points |
| Price correlation | 0.99 | 1.99% independent |
| Weight overlap | 82% shared | 18% unique |
| 10-year return | 15.5% vs 15.1% | 0.4 points |
Three of the four are effectively zero. The one that is not is the return gap — and it is the single measure this article itself says flips direction by era and must not be read as a forecast. So every stable measure says these funds are the same, and the only measure showing a difference is the one that will not stay put. That is the article’s own thesis, arrived at from its own numbers rather than asserted. As a check on the inputs, the cap-tier weights above reconcile exactly: 72% large plus 17% mid plus 11% small is 100%.
What a 0.99 Correlation Actually Leaves
The correlation figure is quoted once and never used. It is worth decoding, because squaring it converts a number that sounds vague into a share of movement.
| Correlation | Shared | Independent |
|---|---|---|
| 0.90 | 81.00% | 19.00% |
| 0.95 | 90.25% | 9.75% |
| 0.97 | 94.09% | 5.91% |
| 0.99 | 98.01% | 1.99% |
| 0.995 | 99.00% | 1.00% |
| 1.00 | 100.00% | 0.00% |
At 0.99, 98.01% of the movement is shared and only 1.99% is independent. The scale is also far more punishing than it looks: going from 0.95 to 0.99 is a rise of only 0.04 in the correlation itself, and it cuts the independent movement by 4.899×. That is the quantitative version of “they move almost in lockstep” — the pair is much closer to identical than the decimal suggests, which is a useful thing to know before spending an evening choosing between them.
When Cost Is a Tiebreaker — and Why It Cannot Be One Here
A fee gap only decides something if it exists. Setting the gaps this article names beside the smallest one the expense-ratio article tabulates shows where the rule bites and where it has nothing to grip.
| Fee gap | Points | Per $10,000/yr | Balance for $100/yr |
|---|---|---|---|
| VTI vs VOO | 0.0000 | $0.00 | never |
| Half a basis point | 0.0050 | $0.50 | $2,000,000 |
| VOO vs SPY | 0.0645 | $6.45 | $155,038.76 |
| Smallest gap in the fee article | 0.1700 | $17.00 | $58,823.53 |
Two of this article’s own claims come out confirmed. SPY at “about three times as much” is exactly 3.15× VOO’s ratio. And “fractions of a basis point … immaterial for a normal investor’s portfolio” now has a threshold attached: at half a basis point you would need a $2,000,000 portfolio before the difference cost you $100 in a year.
The contradiction resolves cleanly, and neither article was wrong. Cost is a sensible tiebreaker between similar funds in general — that is what the fee article is describing, and its own smallest tabulated gap starts costing $100 a year on a $58,823.53 balance. It simply has nothing to act on in this particular case, because the VTI-to-VOO fee gap is identically 0.0000 points, which makes every dollar figure derived from it exactly $0.00 at every balance and over every horizon. Cost cannot break this tie — not because the effect is small, but because it is zero. For scale, the ten-year return gap this article reports is 6.202× the entire VOO-to-SPY fee difference, and infinitely larger than the VTI-to-VOO one. What separates these two funds is the size exposure, not the fee.
Comparison inputs, and the limits on what they show. Every input above is a figure this article already publishes and sources — the two expense ratios, SPY’s, the 0.99 correlation, the 82% weight overlap, the cap-tier split and the ten-year returns — and the code behind the tables checks each published value first. None of the site’s calculators computes a correlation or a fee threshold, so nothing here comes from a shipped tool and none is linked; the arithmetic is division and squaring, deliberately kept to one step so it can be checked by hand. No compounding is done anywhere and there is no ten-, twenty- or thirty-year projection, because fee drag across those horizons is the subject of the expense-ratio article linked above and is not repeated here. Breadth, the size bet and the cost of owning both funds are likewise left to the total-market article this piece already points to. The expense ratios, holdings counts and correlation are point-in-time figures that change; the article says so, and these tables inherit that limit. Nothing above recommends either fund, and nothing above predicts which will lead — the return gap is used only as a measure of scale, never as a forecast.
How to Actually Decide
Since the funds are so similar, the decision comes down to a single, low-stakes preference — and either answer is defensible.
Choose VTI if you want the simplest possible “own the entire U.S. market” position in one ticker and you’d like some built-in exposure to smaller companies, on the reasoning that you don’t want to have to guess which size of company will lead next. Choose VOO if you specifically want to track the S&P 500 — the most-quoted benchmark in the world, the one referenced every time you hear “the market was up today” — and you’re comfortable that the biggest ~500 companies already represent the lion’s share of the U.S. market’s value.
That’s the entire framework. Both are broad, both are cheap, both are diversified, and both have delivered nearly identical long-run results. What actually determines how your investment turns out over thirty years is not which of these two you pick — it’s whether you keep your costs low (tied), whether you stay diversified (tied), and above all whether you keep investing consistently through good markets and bad. That last factor dwarfs the VTI-vs-VOO question entirely.
If you’ve never opened a brokerage account or set up an automatic investment before, the mechanics of starting — not the ticker choice — are the real hurdle, and The Autopilot Plan walks through that setup step by step.
Beginners often spend more time agonizing over the VTI-versus-VOO choice than the difference could ever justify — it can feel like a high-stakes fork precisely because it’s the first concrete decision a new investor faces, even though, as the data above shows, it’s one of the least consequential ones. If that describes where you are right now, the most useful thing to internalize is that picking either and starting beats picking neither while you deliberate.
The Bottom Line
VTI and VOO are two slightly different windows onto the same view. They share an issuer, share a 0.03% fee, share about 82% of their holdings by weight, move together with roughly 0.99 correlation, and have posted long-run returns within a fraction of a percentage point of each other — with the lead trading back and forth depending on whether large or small companies happen to be leading. VTI gives you the whole U.S. market including smaller companies; VOO gives you the large-cap heart of it. Either is a perfectly sound core holding. The decision deserves about five minutes of your attention — and then the far more important work of actually funding the account and investing on a schedule.
Disclaimer: This article is educational content, not financial advice. I am not a licensed financial advisor, and nothing here is a recommendation to buy or sell any security or asset. Investing and trading involve risk, including the possible loss of the money you invest. Do your own research and consider consulting a licensed financial professional before making investment decisions. Read the full Disclaimer. Historical and backtested results are hypothetical, carry inherent limitations, and do not guarantee future results. Figures were accurate to the best of my knowledge as of this article’s last-updated date and may have changed.
Once your core holding is picked, the next question is usually how to buy it when you can’t afford a full share — that’s covered in What Are Fractional Shares? — and how often, which is the subject of Dollar-Cost Averaging: The Evidence, the Math, and the Limits. For the weekly market read this blog uses to apply the fear and greed rules from the Autopilot Plan, subscribe to the newsletter below.
