Total Market vs S&P 500 Index Funds: Does the Difference Matter?
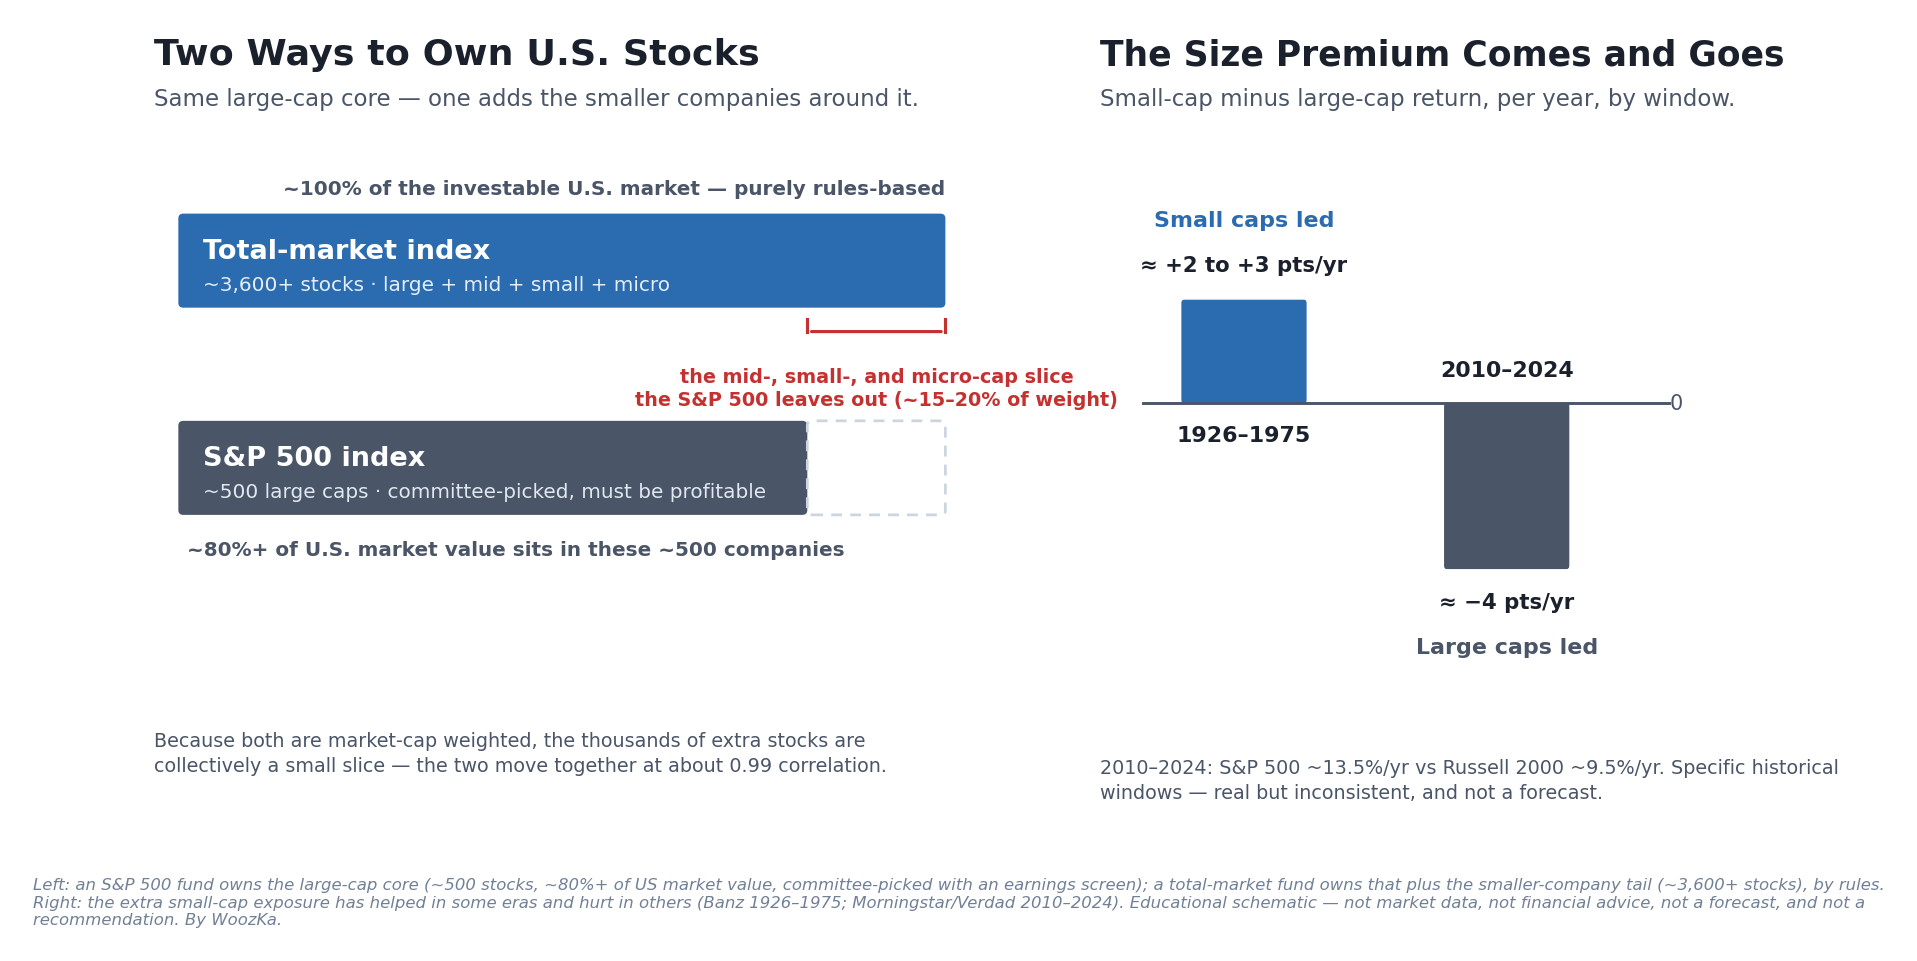
Left: the structural difference in one picture — a total-market fund adds the mid-, small-, and micro-cap tail that the large-cap-only S&P 500 leaves out, and it does so by pure rules rather than a committee’s judgment. Right: whether that extra breadth helps depends entirely on the era, and no one can tell in advance which era comes next. Both panels are illustrative, built from the sourced figures below — not real fund returns, not a forecast, and not a recommendation.
If you’ve settled on low-cost index funds as the base of a long-term plan — the approach at the center of The Autopilot Plan and How to Build a 3-Fund Portfolio — one of the first real forks you hit is which US stock index to build around: a total stock market fund, or an S&P 500 fund. It’s the question underneath the familiar “VTI or VOO?” debate, except one level up: not which two specific tickers, but which index — which definition of “the US stock market” — you want to own.
The honest answer, up front, is that this is one of the smaller decisions you’ll make, and the two approaches are far more alike than different. But there is a real structural difference between them, and it’s worth understanding — both so you can choose without second-guessing, and so you don’t fall for the common myth that owning both gives you meaningful diversification. No specific fund is recommended here; the tickers below appear only as clearly-labeled examples of each category, never as an endorsement. If you want the two most popular Vanguard tickers compared head-to-head, that’s the separate, ticker-level companion piece: VTI vs VOO. This article is about the choice one level above that — the index itself.
What Each Index Actually Is
The core difference is coverage: an S&P 500 index holds about 500 large US companies, while a total-market index aims to hold essentially every investable US stock.
The S&P 500 is an index of roughly 500 of the largest US companies, and it is not a simple “top 500 by size” list. To be eligible, a company must clear a set of objective screens — as of the July 1, 2025 methodology update, an unadjusted market capitalization of at least $22.7 billion, a US domicile, a listing on a major US exchange, adequate trading liquidity, and — critically — positive earnings in its most recent quarter and over its four most recent quarters combined [source: S&P Dow Jones Indices, S&P U.S. Indices Methodology and market-cap-guideline update, July 1, 2025 — confirm current, as S&P revises the threshold periodically]. Meeting those screens only makes a company eligible; the final decision is made by the S&P Index Committee, which also weighs things like sector balance. So the S&P 500 is best understood as a committee-curated index of large, established, profitable US companies — not a purely mechanical one.
A total stock market index — such as the CRSP US Total Market Index (tracked by Vanguard’s total-market fund), the S&P Total Market Index, or the Dow Jones US Total Stock Market Index — takes the opposite approach: it aims to capture the entire investable US equity market by rules alone. The CRSP index, for example, holds on the order of 3,600 to 3,800 stocks and is designed to represent close to 100% of the investable US market — large-, mid-, small-, and micro-cap companies alike [source: CRSP US Total Market Index profile / Vanguard fund documentation, 2026 — confirm current holdings count, which moves as the index reconstitutes]. There’s no committee deciding which companies deserve to be in; if a stock is investable, the rules sweep it in.
Both types of fund are available cheaply from several major providers, and both are market-capitalization weighted — each company’s share of the fund is proportional to its total market value. Hold that fact; it’s the reason the two indexes behave far more alike than their holding counts suggest.
The One Structural Difference — and Two Ways to Describe It
The real, permanent difference between the two is that the total-market index adds the mid-, small-, and micro-cap companies the S&P 500 leaves out — and it selects by rules, where the S&P 500 selects by committee.
There are two distinct things going on here, and it’s worth separating them:
1. Breadth. The S&P 500 is large-cap-only. A total-market fund holds those same large caps plus thousands of smaller companies the S&P 500 never includes. That’s the difference most people mean when they compare the two.
2. Curation. This one gets missed. Because the S&P 500 has a profitability screen and a committee, it quietly filters for quality — it won’t add a giant, widely-held, but unprofitable company until that company has cleared the earnings bar and the committee has acted. A total-market index has no such filter; it owns the unprofitable and the speculative right alongside everything else, in proportion to size.
The cleanest illustration of that curation gap is Tesla. By July 2020, Tesla had posted its fourth consecutive profitable quarter, clearing the S&P 500’s objective earnings requirement — and it was already one of the most valuable companies in the country. Yet at the September 2020 rebalance, the committee passed it over anyway, exercising its discretion. Tesla wasn’t added until December 21, 2020 [source: S&P Dow Jones Indices; CFA Institute, “Tesla and the S&P 500,” Dec 2020; CNBC, Nov 30, 2020]. Throughout that entire stretch, a total-market index fund already owned Tesla — because a total-market index doesn’t wait for a committee. Neither approach was “right”; the episode simply makes the structural difference concrete. The S&P 500 is a curated club with an earnings bar and a human gate; a total-market index is the whole room.
How Much That Difference Actually Changes
In practice, the extra breadth changes the two funds far less than the raw holding counts suggest — because market-cap weighting makes the giant companies dominate both.
Here’s the arithmetic of why. The S&P 500’s large companies already make up roughly 80% or more of the total US market’s value — some measures put it higher, in the mid-80s percent [source: S&P Dow Jones Indices / Vanguard market-coverage analyses, 2026 — confirm current, as the concentration figure drifts with the market]. Because both indexes are cap-weighted, that means the several thousand extra stocks a total-market fund adds are, collectively, only about a 15–20% sliver of its weight. Each of those smaller companies is tiny by market value, so even three thousand of them together move the needle only modestly.
The result is that a total-market fund and an S&P 500 fund move almost in lockstep. Their historical price correlation runs around 0.99 — about as close to moving-together as two different funds get — and their long-run total returns have landed within a fraction of a percentage point of each other [source: fund-overlap and correlation analysis via ETF.com / Optimized Portfolio, 2026; see the ticker-level breakdown in VTI vs VOO]. When the gap does open up, it’s usually small, and — importantly — it does not consistently favor either side. Which one edges ahead depends on whether large or small companies happen to be leading at the time.
That last point is the whole ballgame, so it deserves its own section.
The Real Question Underneath: The Size Bet
Choosing total market over the S&P 500 is, at bottom, a small bet that smaller companies will add something over time — and the historical evidence for that bet is real but far messier than it’s often sold as.
The idea has a serious academic pedigree. In 1981, economist Rolf Banz documented that small-cap US stocks had outperformed large caps by roughly 2 to 3 percentage points a year from 1926 to 1975 — the original “small-firm effect” [source: Banz (1981), summarized via Verdad Capital / academic literature reviews, 2026]. Eugene Fama and Kenneth French later folded a size factor into their influential three-factor model in 1992, cementing “size” as one of the classic drivers of returns.
But the premium has been inconsistent and period-dependent, and a lot of its historical size came from a few concentrated windows (the 1930s recovery, the mid-1970s). Since it was published and became widely known, it has shrunk considerably. Most tellingly, over the roughly decade-and-a-half from 2010 through 2024, large caps dominated: the S&P 500 returned on the order of 13.5% a year while the small-cap Russell 2000 returned around 9.5% — a gap of about four points a year, in favor of large caps, sustained long enough to seriously challenge the small-cap thesis [source: Morningstar, “What Happened to the Size Premium?” / Verdad Capital, 2026]. Even Dimensional Fund Advisors, the firm most associated with factor investing, has acknowledged that the raw size premium has been statistically weak in recent decades.
So the case for total market is not “small caps reliably win.” It’s more modest and more honest: owning the whole market means you never have to guess which size will lead next, and you automatically own tomorrow’s giants while they’re still small. The case for the S&P 500 is equally reasonable: the large-cap core has been where the bulk of the returns and the lower volatility have lived, and you get a light, committee-applied quality screen for free. There is no reliable way to know in advance which regime the next decade brings — the last decade’s large-cap dominance is a fact about the past, not a forecast for the future. That uncertainty is precisely why the choice is smaller than it feels.
None of the figures above is a prediction. They describe specific historical windows, were accurate to the best of my knowledge as of this article’s last-updated date, and will drift as markets move. Past performance does not predict future results.
Where the Choice Does Show Up in Practice
If the returns are nearly identical, a few practical, non-performance factors are actually more useful for deciding — and these are where the difference earns its keep.
Availability in your accounts. In many employer 401(k) plans, an S&P 500 index fund is offered but a total-market fund isn’t. If that’s your situation, the S&P 500 fund captures ~80%+ of the same exposure at the same rock-bottom cost, and it’s a fine core — you’re not missing much by taking what’s on the menu.
Simplicity and completeness. In a taxable or IRA account where both are available, a single total-market fund is the most literal way to “own the US market” in one holding — no separate small-cap fund needed, nothing to rebalance between size tiers. Some investors value that completeness; others find the S&P 500’s simpler, more-quoted definition easier to reason about.
Tax-loss harvesting. This is one place the difference between the indexes is genuinely handy. Because a total-market index and an S&P 500 index track different indexes with different holdings, investors commonly treat them as a pair for tax-loss harvesting — sell one at a loss, immediately buy the other, and stay invested without triggering the wash-sale rule, which disallows a loss if you rebuy something “substantially identical” within 30 days. Two different indexes are generally viewed as a conservative, defensible pairing (whereas two S&P 500 funds from different providers sit in a genuine gray area). Important caveat: the IRS has never precisely defined “substantially identical,” this is a tax question rather than an investing one, and none of it is tax advice — if you’re harvesting losses, confirm the specifics with a tax professional [source: wash-sale-rule guidance via Charles Schwab / Fidelity / Vanguard investor education, 2026].
The committee, if you have a view on it. If the S&P 500’s earnings screen and human oversight appeal to you as a mild quality filter, that’s a point for the S&P 500. If you’d rather own the market by rules with no committee deciding what’s “worthy,” that’s a point for total market. It’s a genuine philosophical difference — it just hasn’t translated into a large or reliable performance difference.
One thing worth adding about the committee, since I’ve watched it play out more than once — Amazon going into the Dow in early 2024, Nvidia taking Intel’s place in it later that year, and a run of S&P 500 additions before both. What stuck with me each time was the order of events. The move doesn’t start when the announcement lands. It starts earlier, with whoever sits far enough up the information chain to be positioned before the rest of us read anything. By the time there’s a headline, the funds that are obliged to hold the name are buying because a mandate says so rather than because they think it’s cheap, and everybody else is buying the headline. Being last in that queue isn’t an edge. It’s a reason to treat inclusion news as something that happens to your index fund rather than something to act on.
What Neither One Covers
Whichever you pick, remember that both are US-only — neither an S&P 500 fund nor a US total-market fund holds a single international stock.
This is the most consequential gap in the whole comparison, and it’s easy to lose sight of while agonizing over large-versus-total. “Total market,” in the name of a US total-market fund, means the total US market — not the world. The United States is a large share of global stock value but not all of it, and the classic three-fund portfolio exists precisely because a complete equity position usually pairs a US fund with an international one. So if you’re weighing total market against the S&P 500, keep the decision in proportion: the international question is a bigger fork than the one you’re currently standing at.
A Trap to Avoid: Owning Both
Buying both a total-market fund and an S&P 500 fund does not give you meaningfully more diversification — it mostly gives you overlap.
Because the S&P 500’s large caps are roughly 80%+ of the total market’s value, a total-market fund already contains essentially all of the S&P 500 inside it. Holding both means owning those same large-cap leaders twice, in two wrappers. The only unique exposure the pairing adds is the small- and mid-cap tail — which you’d get more simply by holding the total-market fund alone. It isn’t harmful, just redundant: two positions to track and two cost bases, with no diversification payoff. (The one exception is the deliberate tax-loss-harvesting swap above, where you hold one or the other at a time, not both permanently.) For most people, the clean answer is to pick one and let it be the core.
The Arithmetic Behind the Choice
Three of the sections above make quantitative claims and then leave them unquantified. The tail is “about a 15-20% sliver” of a total-market fund; the size gap over 2010-2024 was “about four points a year.” Those two numbers appear pages apart and are never multiplied, even though multiplying them answers the question in this article’s own heading. The same is true of the overlap trap: it is asserted, never computed. Everything below runs only the figures already stated above, with the compounding done by computeCompound, the function behind the Compound Growth Calculator, so every row is reproducible in your browser.
What the Extra 3,200 Companies Are Worth
Take the midpoints of the article’s own ranges — 3,700 holdings, and a large-cap core worth 82.5% of the market’s value — and the breadth argument becomes concrete. The extra companies are numerous and, individually, very small.
| Bucket | Companies | Share of fund | Avg weight each | Per $10,000 |
|---|---|---|---|---|
| S&P 500 core | 500 | 82.5% | 0.1650% | $16.50 |
| The extra tail | 3,200 | 17.5% | 0.0055% | $0.55 |
The average S&P 500 constituent carries about 30 times the weight of the average tail company. Put $10,000 into a total-market fund and roughly 55 cents of it lands in each of the 3,200 companies the S&P 500 leaves out — 45 cents at the most concentrated end of the article’s ranges, 65 cents at the least. That is not an argument against owning them; the point of a cap-weighted fund is that positions are sized by market value, and the tail collectively still carries 17.5%. It is an argument for reading “3,600 stocks” as a statement about completeness rather than about how much of your money is doing something different.
Owning Both, Computed
The section above calls the pairing redundant. The arithmetic says something sharper than redundant. A total-market fund is core plus tail; an S&P 500 fund is core only. So every dollar moved into the second fund buys more of what you already own and dilutes the one exposure that distinguishes them.
| Split (TM / S&P) | Effective core | Effective tail | Tail kept |
|---|---|---|---|
| 100 / 0 | 82.5% | 17.5% | 100% |
| 75 / 25 | 86.9% | 13.1% | 75% |
| 50 / 50 | 91.2% | 8.8% | 50% |
| 25 / 75 | 95.6% | 4.4% | 25% |
| 0 / 100 | 100.0% | 0.0% | 0% |
The relationship is exactly linear: your effective tail is simply the share held in the total-market fund, times 17.5%. A 50/50 pairing keeps half the tail. That is the trap stated precisely — the second fund is not merely redundant, it is subtractive with respect to the only thing that made total market different in the first place. Someone who buys both because they want “more diversification” ends up with measurably less of the small- and mid-cap exposure than if they had bought the total-market fund alone and stopped. To hold the full 17.5% you have to hold 100% total market.
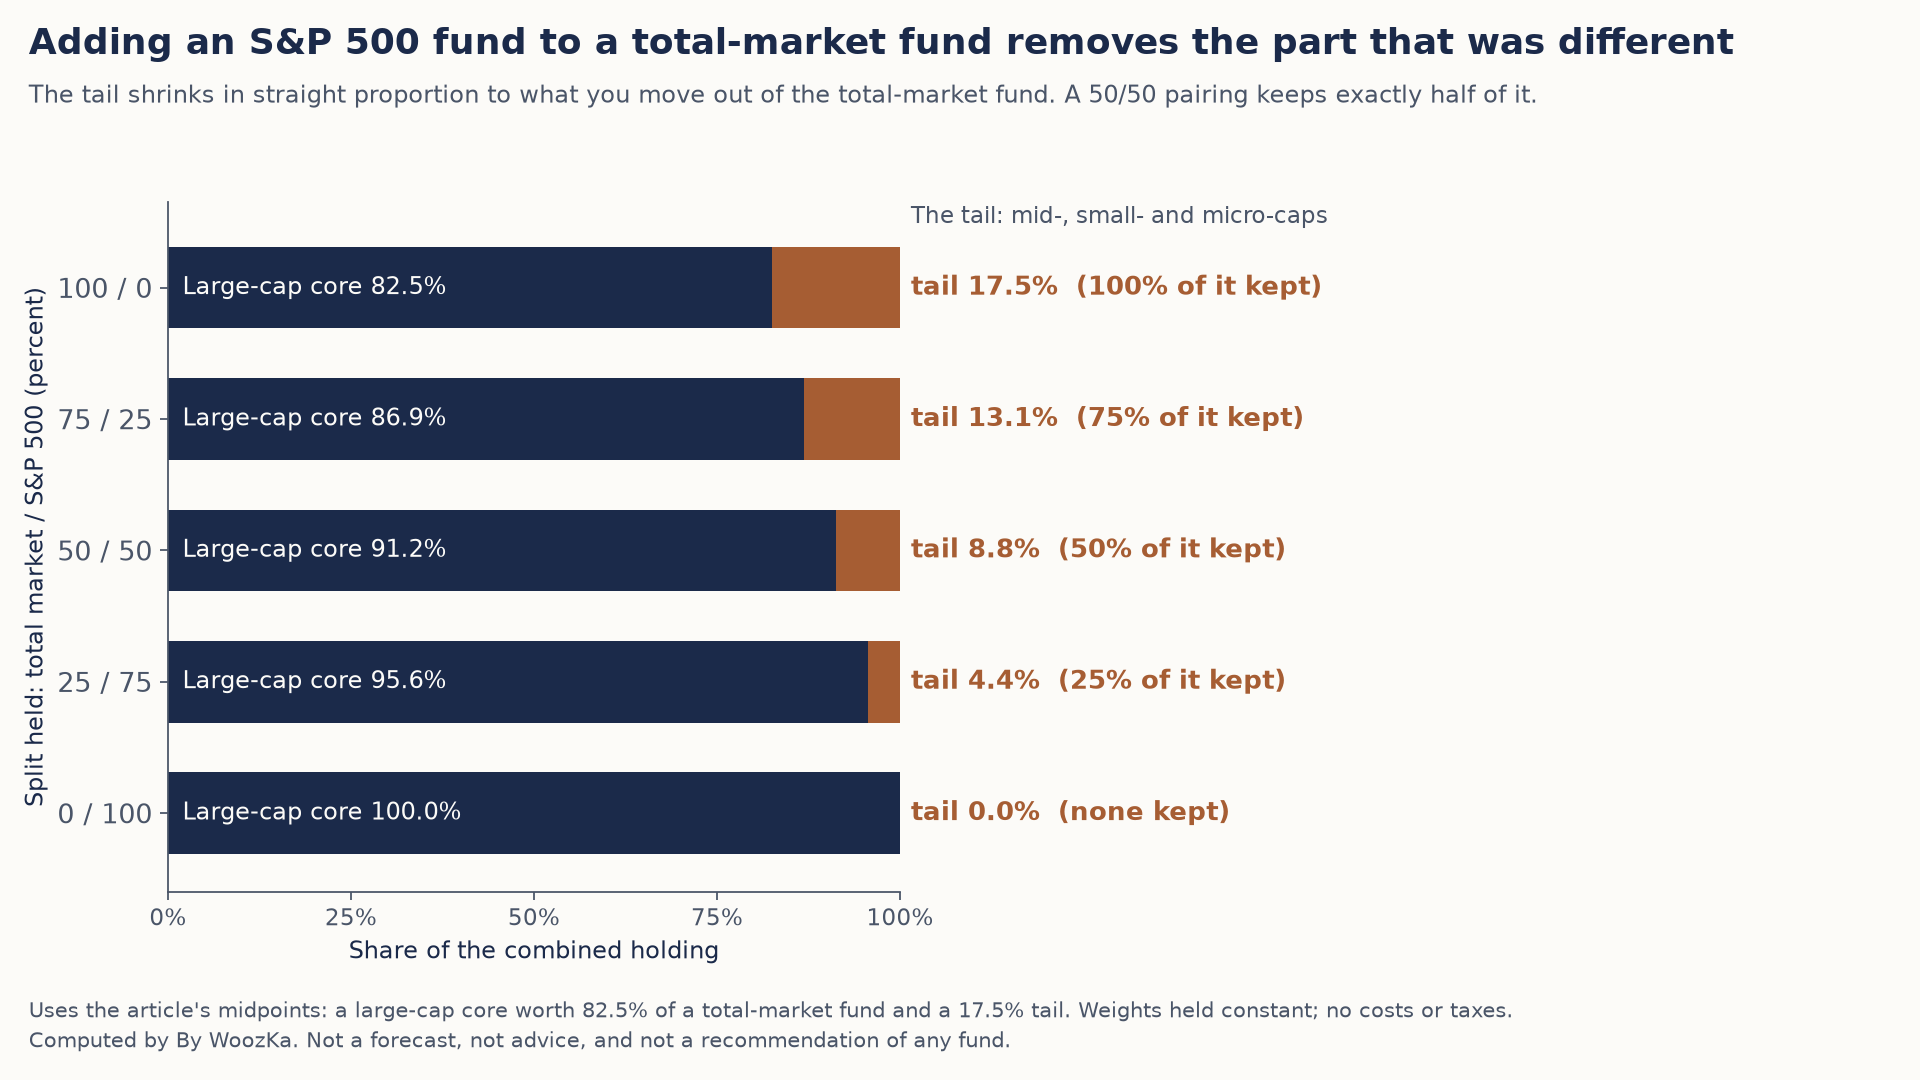
Every dollar moved into the S&P 500 fund shrinks the mid-, small- and micro-cap slice in straight proportion. A 50/50 pairing keeps exactly half of it.
The Size Bet in the Era This Article Names
Now join the two numbers. If the tail is 15-20% of a total-market fund, and the tail trailed the large-cap core by about four points a year from 2010 through 2024, the drag on the whole fund is that gap scaled down by the tail’s weight. Because the article supplies only a small-cap index as its tail proxy, and the real tail includes mid-caps that generally did better, these figures are an upper bound on the size effect rather than an estimate of it. The S&P 500 line is the same in every row: 13.5% a year, turning $10,000 into $66,824.84 over the fifteen years.
| Tail share | Blended return | Gap a year | After 15 years | Shortfall |
|---|---|---|---|---|
| 15% | 12.900% | 0.600 | $61,717.61 | $5,107.23 |
| 17.5% | 12.800% | 0.700 | $60,902.69 | $5,922.15 |
| 20% | 12.700% | 0.800 | $60,097.82 | $6,727.02 |
Every gap lands under a point a year, which is exactly what this article already claims qualitatively when it says the two have returned “within a fraction of a percentage point of each other.” That agreement is the check that the reconstruction is sound: the article’s own scattered numbers, multiplied, reproduce its own summary. What the multiplication adds is the honest other half. Under a point a year is small, and over fifteen years in the most lopsided stretch this article names it still compounds to roughly $5,100 to $6,700 on a $10,000 stake — real money, arrived at without either fund ever doing anything wrong.
Both readings are true at once, and holding them together is the useful thing. The annual difference is genuinely small, which is why the choice does not deserve weeks of deliberation. The compounded difference is not nothing, which is why “it makes no difference” overstates the case. And the direction is not knowable in advance — 2010-2024 ran one way, the decades Banz studied ran the other, and nothing in the arithmetic above says which regime comes next.
What this comparison covers, and why its 15-year figures are an upper bound. Every input is this article’s own figure — “about 500” S&P constituents, “3,600 to 3,800” total-market holdings, a core worth “roughly 80%” to “the mid-80s percent,” and the 13.5% and 9.5% annual returns for 2010-2024 — and none is a fund return, a recommendation, or a forecast. Where the article gives a range, the tables use its midpoint and show the endpoints in prose. Three simplifications are deliberate and material: the Russell 2000 stands in for a tail the article describes as mid-, small- and micro-cap, which is why the drag is labeled an upper bound; the weights are held constant across the window although the article itself notes they drift; and the blend assumes no costs, taxes or rebalancing. Compounding is done by computeCompound, the function behind the linked Compound Growth Calculator, at annual compounding. The calculation behind these tables reports every figure above and confirms that the article’s own stated relationships — the four-point gap, the 15-20% tail implied by an 80-85% core, and a resulting difference of under one point a year — all hold before it reports anything.
How to Actually Decide
Since the two are so close, the decision comes down to a few low-stakes preferences — and either answer is entirely defensible.
Lean total market if you want the single most complete “own the whole US market” holding, you’d rather not guess which company size leads next, and you like the idea of owning future winners while they’re still small. Lean S&P 500 if it’s what your 401(k) offers, if you prefer tracking the world’s most-quoted benchmark, or if a light committee-applied earnings screen sits well with you. Both are broad, both can be owned for a few basis points a year, both are dominated by the same large companies, and both have delivered nearly identical long-run results.
What actually determines how your investment turns out over thirty years is not which of these two indexes you pick. It’s whether you keep costs low (a wash here), stay diversified — including internationally, the gap neither one fills — and, above all, keep investing consistently through good markets and bad. That last factor dwarfs the total-market-versus-S&P-500 question entirely.
Beginners routinely spend more energy on this choice than the difference could ever justify — it feels high-stakes because it’s an early, concrete decision, even though, as the data shows, it’s one of the least consequential ones. If that’s where you are, the most useful thing to internalize is that picking either and starting beats picking neither while you deliberate.
The Bottom Line
A total-market index fund and an S&P 500 index fund are two slightly different definitions of “the US stock market.” The S&P 500 is the large-cap core — about 500 committee-selected, profitable companies, roughly 80%+ of the market’s value. A total-market fund is that same core plus the thousands of smaller companies around it, swept in by rules with no committee. Because both are cap-weighted, they share most of their weight, move together at roughly 0.99 correlation, and have posted long-run returns within a fraction of a point of each other — with the tiny lead trading back and forth depending on whether large or small companies happen to be leading. Either is a perfectly sound core US holding. Give the choice about five minutes — then spend your real attention on the international slice neither one covers, on keeping costs low, and on actually funding the account on a schedule.
Disclaimer: This article is educational content, not financial advice. I am not a licensed financial advisor, and nothing here is a recommendation to buy or sell any security or asset. Investing and trading involve risk, including the possible loss of the money you invest. Do your own research and consider consulting a licensed financial professional before making investment decisions. Read the full Disclaimer. Historical and backtested results are hypothetical, carry inherent limitations, and do not guarantee future results. Figures were accurate to the best of my knowledge as of this article’s last-updated date and may have changed.
Once your core US holding is settled, the natural next questions are what the whole portfolio should look like — covered in How to Build a 3-Fund Portfolio — and what fund costs actually do to you over a lifetime, covered in Expense Ratios Explained. For the two-ticker version of this exact debate, see VTI vs VOO. For the weekly market read this blog uses to apply the fear-and-greed rules from the Autopilot Plan, subscribe to the newsletter below.
