Short-Term vs Long-Term Debt Cycles: Why This Distinction Matters for Your Money
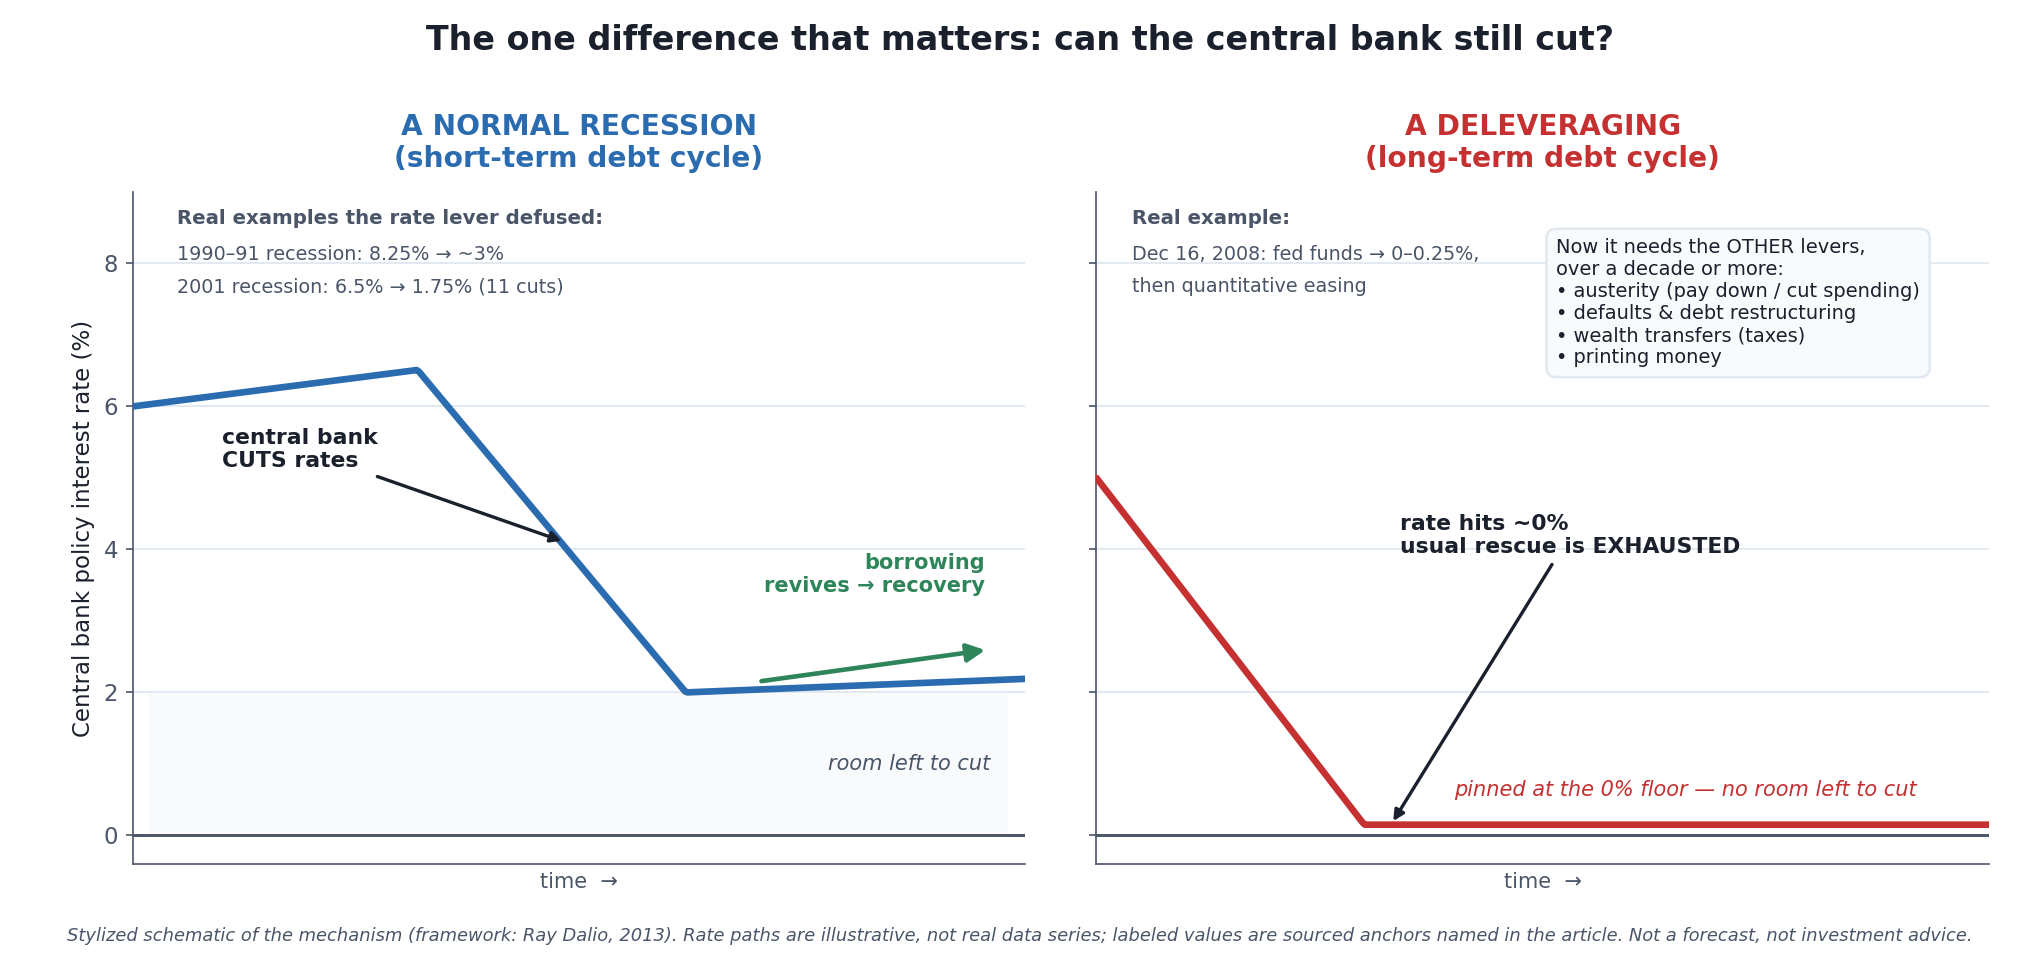 Same tool, two very different situations. On the left, a normal recession the central bank can lean against by cutting rates. On the right, a deleveraging where rates are already near zero and cutting has run out of room. This is an illustrative schematic of the mechanism, not real data and not a forecast.
Most people talk about “the economic cycle” as if there were only one. There are really two, running at completely different speeds — and confusing them is one of the most expensive mistakes a long-term saver can make. One cycle turns over every handful of years and you’ll live through many of them. The other unwinds roughly once in a lifetime and behaves by different rules. This article explains what separates the two, why that difference decides whether the usual economic rescue even works, and what all of it means for the ordinary decisions you make with your own money — without pretending anyone can tell you where in either cycle we sit right now.
The one-sentence version: a short-term debt cycle is the normal boom-and-recession rhythm a central bank can steer by moving interest rates, while a long-term debt cycle is the slow, decades-long buildup of debt that eventually gets so heavy the usual rate-cut rescue stops working. If you want the larger system these two cycles live inside, this is a companion to the section’s foundation, The Economic Machine Explained, which credits the framework here to Ray Dalio’s “How the Economic Machine Works” (Bridgewater Associates, 2013) [source: Ray Dalio, 2013; economicprinciples.org].
Two Cycles, Not One
Start with the mechanism, briefly, because the distinction only makes sense once you see why debt drives cycles at all. When you borrow, you pull spending forward — you buy today with money you’ll earn later. Because one person’s spending is another person’s income, a wave of borrowing lifts incomes, asset prices, and confidence together, which encourages still more borrowing. That self-reinforcing loop is what makes economies cycle rather than grow in a straight line. Eventually the borrowing has to be serviced, spending pulls back, and the loop runs in reverse [source: Dalio, 2013]. The pillar walks through this engine in full; here we only need the one fact that the whole cycle rides on credit.
Now the part that trips people up. Dalio’s framework, drawn from his study of hundreds of cycles across centuries, separates that credit-driven motion into two cycles of very different length [source: Dalio, 2013; The Investor’s Podcast Network summary of Dalio’s long-term debt cycle]:
- The short-term debt cycle — on the order of 5 to 8 years, repeating over and over for decades. In his data the average runs about six years, give or take three [source: The Investor’s Podcast Network, summarizing Dalio].
- The long-term debt cycle — on the order of 75 to 100 years, with the average around 75 years, give or take 25 [source: The Investor’s Podcast Network, summarizing Dalio].
The reason both exist at once is subtle and worth slowing down for. Each short-term cycle doesn’t return to exactly where the last one started — it tends to finish with a little more debt than the cycle before it, because given the choice, people generally lean toward borrowing and spending a bit more rather than paying down [source: Dalio, 2013]. Stack dozens of those small upward steps on top of each other across decades and you get the long, slow rise of the long-term cycle. The short cycle is the ripple; the long cycle is the tide the ripples ride on. You are almost always inside a short-term cycle. You are only rarely near a turning point of the long one.
The Short-Term Debt Cycle: The One You’ll Live Through Often
The short-term cycle is the ordinary economic weather of your financial life. It typically runs 5 to 8 years and is closely tied to the central bank’s interest-rate lever [source: Dalio, 2013]. The rough script: the economy expands, borrowing and spending pick up, and eventually demand pushes against the economy’s capacity to supply, so prices start rising faster. To cool things off, the central bank raises interest rates, which makes borrowing costlier, slows spending, and can tip the economy into a recession. Then, to revive it, the central bank cuts rates, borrowing becomes cheap again, and a new expansion begins. Rinse and repeat.
You don’t have to imagine this — recent decades are full of clean examples. The 2020s handed us a textbook run: as prices surged, the Federal Reserve raised its benchmark rate eleven times between March 2022 and July 2023, lifting the target range from near zero to 5.25–5.50% [source: Federal Reserve; CBS News, July 2023]. Go back further and you find the down-leg of the same lever. In the recession the NBER dates from July 1990 to March 1991 — eight months — the Fed responded by cutting its policy rate repeatedly, from 8.25% down toward 3% over the following couple of years, and the expansion resumed [source: NBER business-cycle dating; Federal Funds Rate history, Forbes Advisor]. In the 2001 recession (NBER: March to November 2001), the Fed cut rates eleven times, taking the federal funds rate from 6.5% all the way down to 1.75% [source: NBER; Federal Reserve Bank of San Francisco; Forbes Advisor]. Each was painful in the moment. Each was also, in hindsight, a normal turn of the short-term cycle that the central bank was able to lean against — because it had room to cut.
That last clause is the whole point, and it’s where the long cycle changes everything.
The Long-Term Debt Cycle: The Rare, Slow One
Zoom out from the ripples to the tide. Across many short-term cycles, debt burdens slowly climb faster than incomes. During the long boom, that feels fine, even great: rising incomes and rising asset prices keep borrowers looking creditworthy even as their debts balloon [source: Dalio, 2013]. But debt can’t outgrow income forever. Eventually debt-service payments claim so much of people’s cash flow that they’re forced to cut spending — and because one person’s spending is another’s income, the whole self-reinforcing loop that powered the boom now runs in reverse. That turning point is the long-term debt peak, and what follows is a deleveraging: a drawn-out period of reducing debt burdens relative to incomes [source: Dalio, 2013].
These peaks are rare and historic. Dalio points to the United States in 1929, Japan in 1989, and the United States and much of the world in 2008 [source: Dalio, 2013]. The 2008 case is the one most readers lived through, and the data shows the deleveraging plainly rather than as a metaphor. U.S. household debt had climbed to roughly 124% of disposable income by the end of 2007; over the following years households pulled it back down to about 100% by the end of 2012, with household debt falling by a cumulative figure on the order of $940 billion in the years after the third quarter of 2008 [source: Federal Reserve Board, FEDS Notes, “Deleveraging and Recent Trends in Household Debt,” 2015]. That is what a deleveraging is, in numbers: not one bad quarter, but years of an entire economy paying down, defaulting on, and writing off debt it had spent a generation accumulating.
The One Difference That Matters Most
If you remember nothing else, remember this: a normal recession and a deleveraging feel similar on the ground, but they differ on one decisive question — can the central bank still fix it by cutting interest rates?
In a normal short-term-cycle recession, the answer is yes. Rates are somewhere above zero, so the central bank has room to cut, cheaper borrowing revives spending, and the economy turns back up — usually within months to a couple of years. That’s exactly what the 1990–91 and 2001 examples above show: rates came down from 8.25% and from 6.5%, and the machine restarted.
In a long-term deleveraging, the answer is no — and that’s the definition. As one plain summary of Dalio’s work puts it, the difference between a recession and a deleveraging is that the debt burden is simply too big to be relieved by lowering interest rates [source: Mauldin Economics / Bridgewater, “Big Debt Cycles”]. The reason is mechanical: by the time a long-term peak arrives, the central bank has usually already cut rates all the way to the floor. That is precisely what happened in 2008. On December 16, 2008, the Federal Reserve cut the federal funds rate to a range of 0 to 0.25% — the “zero lower bound,” the point where conventional rate policy runs out of road [source: Federal Reserve Board, December 16, 2008 FOMC action; CNBC, December 16, 2008]. With its main tool exhausted, the Fed turned to unconventional measures, buying trillions of dollars of bonds over the following years in successive rounds of “quantitative easing” [source: Federal Reserve History, “The Great Recession of 2007–09”]. Dalio notes the same signature in the 1930s: rates hit 0% and the normal stimulus ran out of room [source: Dalio, 2013].
When the interest-rate lever is maxed out, working through the debt requires other, blunter tools. Dalio describes four levers a society pulls in some combination during a deleveraging: cutting spending and paying debt down (austerity), reducing debts through defaults and restructuring, transferring wealth from those who have it to those who don’t (typically via taxes), and having the central bank print money to ease the burden [source: Dalio, 2013; Bridgewater, “Principles for Navigating Big Debt Crises”]. The first two are deflationary and painful; the last is inflationary. Balance them well and Dalio calls the result a “beautiful deleveraging” — debt burdens fall while growth stays positive and inflation stays contained. But he’s explicit that a beautiful deleveraging is the best-case outcome, not a guaranteed one, and that even at its best it helps some households while it hurts others, since almost no one is a perfectly balanced net saver or net borrower [source: Dalio, 2013; Mauldin Economics summary]. Working through a long-term peak this way typically takes a decade or more — which is where the phrase “lost decade” comes from.
How Much Room to Cut the Fed Actually Had, Three Times
The section above rests the whole distinction on one phrase, “room to cut,” and gives the start of two easings but only the end of the third. Here are all three from the Federal Reserve’s own record, each measured as an unbroken run of cuts, from the level before the first cut to the level after the last.
| Easing | From | To | Points cut |
|---|---|---|---|
| 1990–92 | 8.25% | 3.00% | 5.25 |
| 2001–03 | 6.50% | 1.00% | 5.50 |
| 2007–08 | 5.25% | 0–0.25% | 5.00–5.25 |
The 2007–08 easing was not unusually large. It cut about as much as the other two, in fewer moves (10, against 18 and 13) and less time (15 months from first cut to last, against 26 and 29). What set it apart was where it began. Starting from 5.25%, the lowest of the three, a cut of ordinary size used 95.2% to 100% of the starting rate, against 63.6% in 1990–92 and 84.6% in 2001–03. The earlier two stopped with 3.00 and 1.00 points still unused.
The 2001 row runs past the figure given above, and both are right. The eleven cuts of 2001 ended at 1.75% on December 11, 2001. The easing did not stop there: a cut in November 2002 and another in June 2003 took the target to 1.00%, and the next increase came in June 2004. Counted to its end, the 2001 easing was the largest of the three.
One more measurement, on this article’s own dates: household debt at roughly 124% of disposable income at the end of 2007, and falling from the third quarter of 2008. The target was 4.25% at the end of 2007 and 2.00% through the whole third quarter of 2008. The floor came on December 16, 2008, after both dates, and three of the ten cuts came after that quarter ended. On these dates, then, the rate reached the floor during the unwinding, not before the peak. That is a measurement of timing, not a claim about what caused what, and it leaves the article’s definition untouched: a deleveraging is a debt burden too big for rate cuts to relieve.
Method and limits, so this can be checked rather than taken on trust. Every rate and date comes from the Fed’s tables of changes in its target federal funds rate, retrieved September 24, 2026 [source: Federal Reserve, “Open Market Operations” and “Open Market Operations Archive,” federalreserve.gov]. Every level was checked against the one before it and the printed size of the change. The archive begins with the cut of July 13, 1990, to 8.00%, so the 8.25% starting level is implied by that row rather than printed in it; it matches this article’s figure, and any earlier easing is outside this record. The FOMC first announced the outcome of a meeting in February 1994 [source: Federal Reserve, “Transcripts and other historical materials,” federalreserve.gov], so the 1990–92 dates are the Fed’s later record, not announcements. The December 2008 target is a range, so figures that depend on it are ranges. Start and end points depend on the definition of an easing used here. Every figure was computed in code that re-derives and confirms it before reporting. Nothing above says where rates or the cycle are headed, or recommends any action.
The Two Layers a Central Bank Can Reach
This article names two of the tools without measuring either: the bond buying the Fed turned to once its rate lever was exhausted, and “printing money” as one of Dalio’s four levers in a deleveraging. Both are usually described as adding money to the economy. It is worth being precise about which money, because the levers do not all reach the same layer — and the gap between the layers is exactly the credit this article says the whole cycle rides on.
Start with the layer a central bank sets directly. The monetary base is currency in circulation plus the reserve balances that banks hold in their accounts at the Fed, and when a central bank buys a bond it pays for it by crediting the seller’s bank’s reserve account [source: Federal Reserve H.6, Money Stock Measures, released August 25, 2026, definitions of the monetary base and reserve balances].
| Component | July 2026 | Share of base |
|---|---|---|
| Currency in circulation | $2,472.3B | 44.8% |
| Reserve balances | $3,051.5B | 55.2% |
| Monetary base | $5,523.9B | 100.0% |
Reserve balances — the account entries that asset purchases create — are the majority of the base, at 55.2%. That is the layer the bond buying in this article’s 2008 section acts on directly. It is also the smaller of the two layers by a wide margin, which is the part that usually goes unsaid.
Broad Money Is Four Times the Base
Set the base next to the measures of money that households and businesses actually hold and spend.
| Measure | July 2026 | Multiple of base |
|---|---|---|
| Monetary base | $5,523.9B | 1.00x |
| M1 | $19,886.4B | 3.60x |
| M2 | $23,218.0B | 4.20x |
M2 is 4.20 times the monetary base. Put the other way, $17,694.1 billion of broad money — roughly three-quarters of M2 — sits above the layer a central bank credits directly. That upper layer is not created by the central bank at all. It is created by commercial banks making loans, which is the mechanism the companion piece How Banks Create Money walks through in full, and it is the same credit whose expansion and contraction defines both of the cycles in this article.
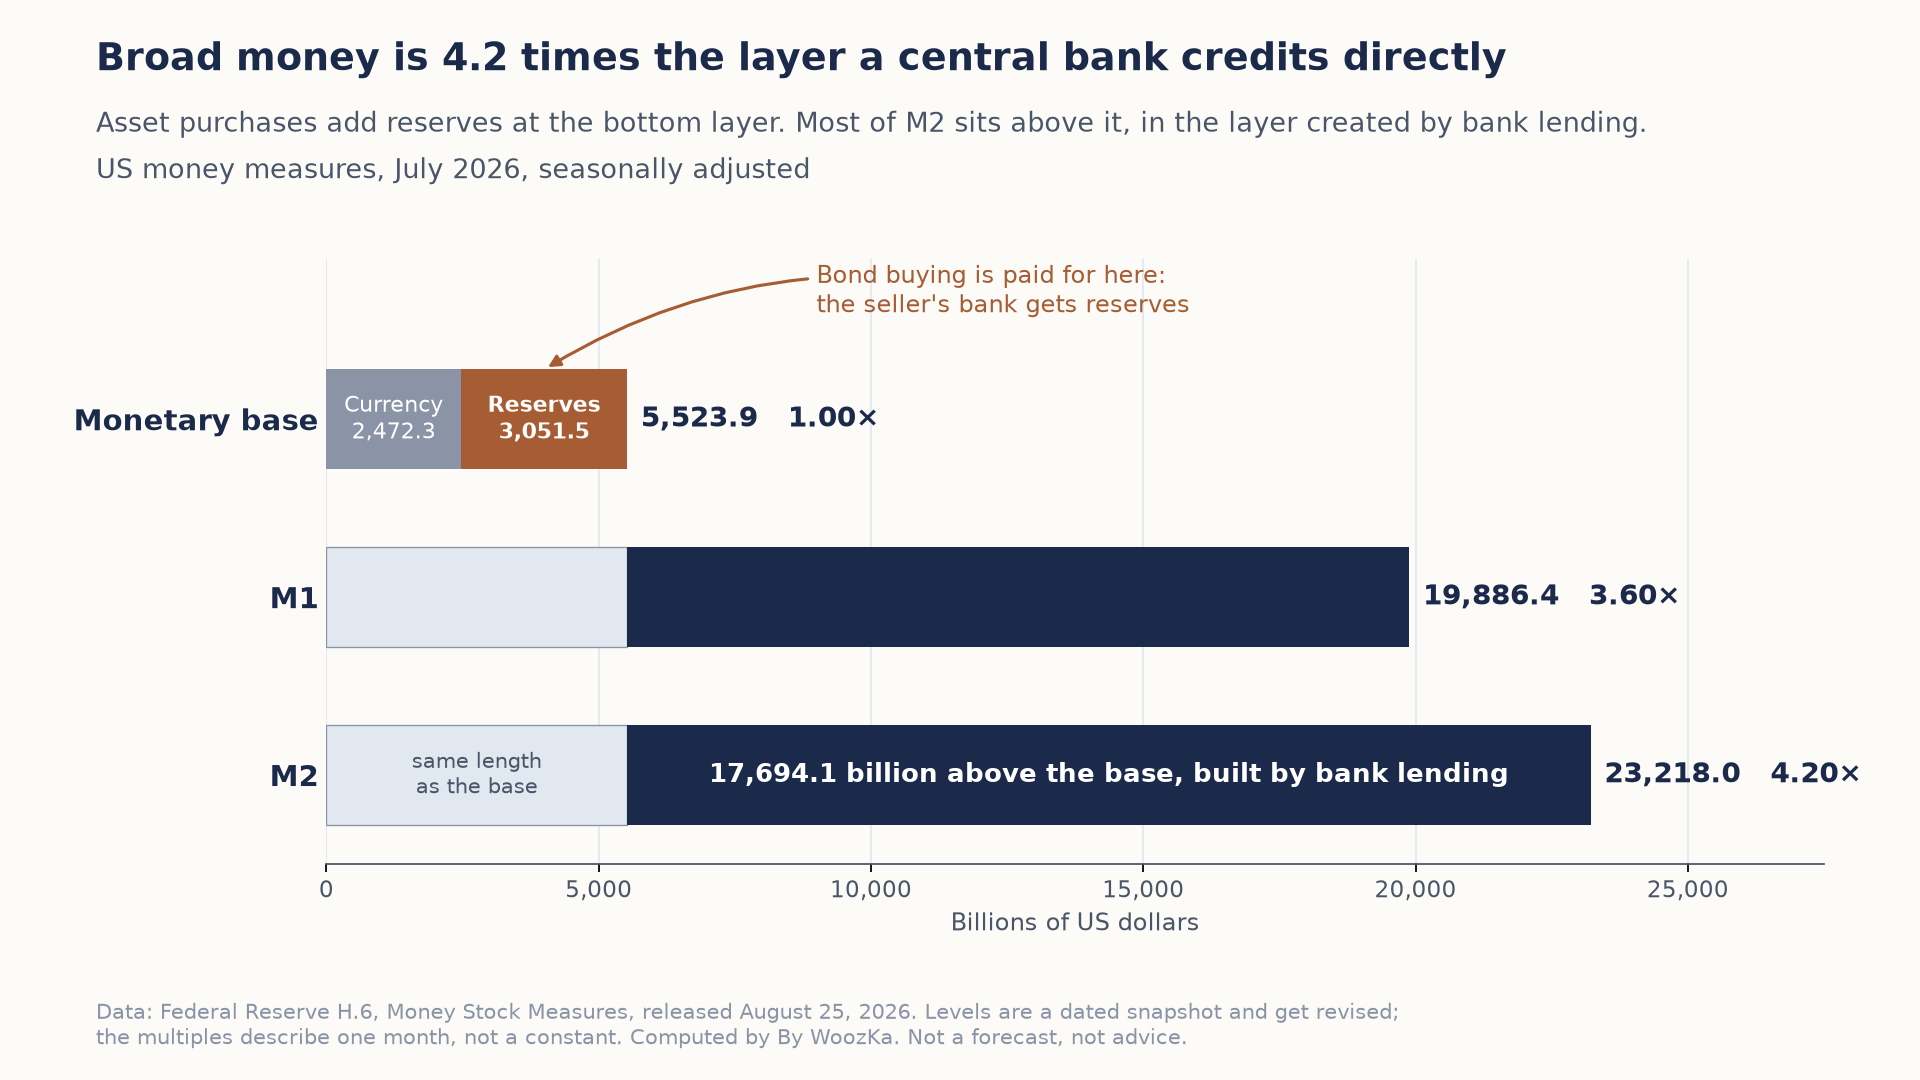 A central bank’s bond buying lands in reserves, the orange slice at the top. Broad money is more than four times that whole layer, and most of it sits above the base, in the money this article says banks create by lending.
That is the useful reframing of the “print money” lever. It does not reach broad money by itself; it enlarges the layer underneath and leaves the transmission to lending. Which is precisely why the distinction this article is built on matters so much: in a normal short-term cycle, cheaper credit revives borrowing and the upper layer responds. In a deleveraging, borrowers are trying to shrink debt rather than take more on, and the same lever pushes on a layer that may not pass the impulse upward. Whether it does, and by how much, is the contested part — this article’s own “Where the Honest Explanation Stops” section governs, and nothing in these two tables predicts an outcome.
One correction worth carrying, since these terms travel badly. The Federal Reserve does not publish an aggregate called “M0.” The H.6 release publishes M1 and M2; “M0” is a Bank of England term for narrow money that the Bank of England itself retired, and an American chart labeled “M0” almost always means the monetary base above, reconstructed by whoever drew it. M3 was published once and discontinued on March 23, 2006 [source: Federal Reserve H.6, Money Stock Measures, released August 25, 2026; Federal Reserve M3 discontinuance notice, 2006].
A note on the aggregates above: their vintage, and how they were checked. The levels are the July 2026 figures, seasonally adjusted and in billions of dollars, from the H.6 release dated August 25, 2026; the only computed figures here are ratios and shares of them. Each level was reconciled against an identity inside the release before use: currency in circulation plus reserve balances reproduces the monetary base, and M1 plus small time deposits plus retail money funds less IRA and Keogh balances reproduces M2 exactly. These are a dated snapshot and the Fed revises them, so read the levels as of that release; the ratios are the durable part, and they move as the balance sheet and bank lending move. The 4.20x multiple is an observation about one month, not a constant and not a forecast — no claim is made here about what any lever will do next, or about inflation. Every figure above comes from code that refuses to report anything if an identity check fails.
Why This Distinction Matters for Your Money
Here’s the payoff, and it’s not a trading strategy — it’s perspective and proportion.
First: most downturns you’ll ever face are the ordinary kind. Over a 40- or 50-year investing life you will live through many short-term-cycle recessions and, if history is any guide, likely brush past a long-term turning point only once or twice — if at all. That matters because the emotional experience of a normal recession and a rare deleveraging is nearly identical: both feel like the sky is falling. If you treat every downturn as if it were 1929 or 2008, you’ll be tempted to sell in a panic during what turns out to be an ordinary, self-correcting turn of the short cycle — the exact moment that historically punishes long-term investors the most. Understanding that the machine has a normal reset button most of the time is a genuine antidote to that panic.
Second: respect the rare one without pretending you can time it. A true deleveraging really is different in kind — the usual rescue doesn’t work, and the adjustment grinds on for years. It’s reasonable to let that possibility shape durable habits: not borrowing so aggressively that a long, hard stretch would force your hand; keeping an emergency cash buffer so a recession doesn’t make you a forced seller of your investments; and not concentrating everything in a single asset that a deleveraging could hit hardest. Those are lens-informed habits, not predictions.
Third — and this is the honest core — the distinction is a tool for understanding, not for timing. Knowing that two cycles exist does not tell you which one you’re in right now, and turning points are only ever confirmed in hindsight. So the practical response to both cycles turns out to be the same steady one: a long-horizon plan you don’t have to forecast cycles to stick with. That’s why an unglamorous, rules-based habit like dollar-cost averaging — investing on a schedule through good weather and bad — is designed precisely so you don’t need to know where in the cycle you are to keep making sensible decisions. And it’s why the distinction between what builds your wealth and what quietly drains it, covered in Assets vs Liabilities, matters more to your long-run outcome than any attempt to call the next turn. The nearer-term machinery of how the central bank’s rate lever ripples into markets is the subject of a companion piece, Why Interest Rates Move Markets; the slow erosion that the “print money” lever can produce is covered in What Is Inflation, Really?.
If you lived through 2008 as an adult, you got a firsthand education in what a deleveraging feels like — the sense that the normal rules had stopped working, that the usual reassurances rang hollow, that this downturn was somehow categorically different from the recessions before it. That instinct was correct, and it’s exactly the distinction this article is about: your gut was registering the difference between a short-term-cycle recession the central bank could lean against and a long-term deleveraging where the usual lever had run out of room.
Where the Honest Explanation Stops
Understanding the two cycles is genuinely useful. Believing that understanding lets you predict the turns is where people get hurt, so here are the limits, stated plainly.
You cannot reliably tell in real time which cycle you’re in. Every recession attracts confident voices declaring it “the big one,” and most of the time they’re wrong; occasionally, as in 2008, one of them happens to be right, but not because they had a working crystal ball. The signature that separates a deleveraging from a normal recession — the rate lever running out of room — is often only obvious well after the fact. This article makes no claim about where the economy sits today; per the guardrail for this whole section, the job is to explain the machine, not to forecast it.
“Roughly 75 to 100 years” is not a countdown. Cycle lengths are historical averages with wide ranges — about six years give or take three for the short cycle, about 75 give or take 25 for the long one [source: The Investor’s Podcast Network, summarizing Dalio]. Averages describe a messy past; they do not schedule the future. Anyone using “we’re due” arithmetic to time a crash has stepped outside what the framework can honestly deliver.
The framework is a lens, not a machine that outputs trades. It’s a widely taught, well-documented way of organizing economic history — not a proprietary signal, and not something that converts into a buy or sell instruction. Treat it as education about how the system behaves, and make any actual financial decisions with a licensed professional and your own full research.
The Beginner’s Takeaway
There are two debt cycles, not one. The short one — a handful of years long — is the ordinary rhythm of expansions and recessions the central bank steers by moving interest rates, and you’ll live through many of them. The long one — the better part of a century — is the slow accumulation of debt across dozens of short cycles, and it ends in a rare, grinding deleveraging where the usual rate-cut rescue stops working because rates are already near zero. The single question that separates them is whether the central bank still has room to cut.
You don’t need to predict either cycle to use this. The distinction earns its keep by giving you proportion: the calm to sit through the many normal recessions without panic-selling, the humility to build durable habits against the rare deleveraging you can’t time, and the clarity to see that the sensible response to both is the same steady, long-horizon plan. To see how these cycles fit into the whole system of credit, debt, and money, the pillar for this section — The Economic Machine Explained — is the natural next read. For the weekly plain-English read on what the economy is actually doing — explained, never predicted — the newsletter is below.
Both cycles are laid out together in the Economic Cycles Explorer, with a table of the expansions that ran between every U.S. recession since 1929. The asymmetry between the two is easier to see than to describe.
Disclaimer: This article is educational content, not financial advice. I am not a licensed financial advisor, and nothing here is a recommendation to buy or sell any security or asset. Investing and trading involve risk, including the possible loss of the money you invest. Do your own research and consider consulting a licensed financial professional before making investment decisions. Read the full Disclaimer.
Historical and backtested results are hypothetical, carry inherent limitations, and do not guarantee future results. Figures were accurate to the best of my knowledge as of this article’s last-updated date and may have changed.
