RSI Explained: How to Use It Without the False Signals
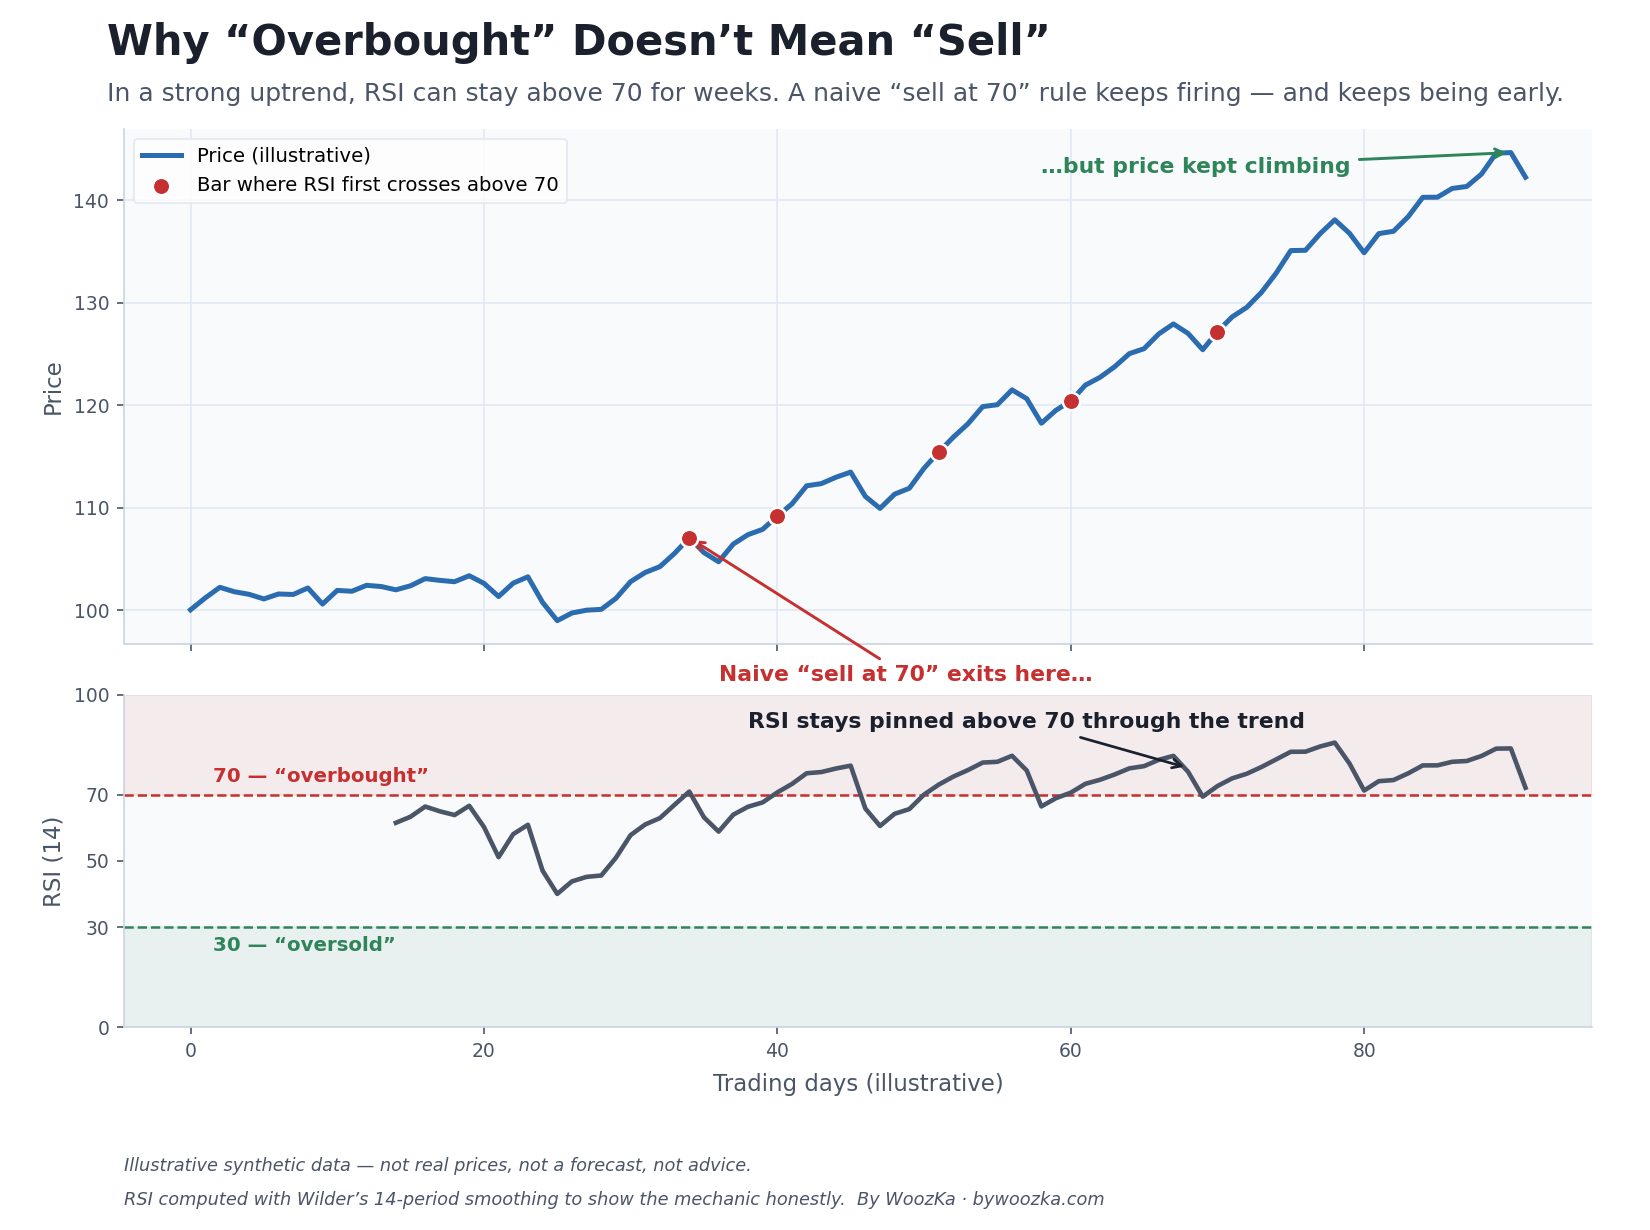 The whole false-signal problem in one picture: “overbought” is a description of momentum, not an instruction to sell. A trader who sold every time RSI crossed 70 (red dots) would have exited this trend again and again while price kept rising. Everything below is about not making that mistake.
The Relative Strength Index (RSI) is one of the most popular technical indicators in the world, and also one of the most misunderstood. The typical explanation — “RSI over 70 means overbought, so sell; under 30 means oversold, so buy” — is not just oversimplified. Followed literally, it is one of the fastest ways to hand back money in a trending market, because it tells you to bet against strength exactly when strength is most persistent.
Here is the honest framing this article is built on: RSI measures momentum; it does not issue buy or sell orders. It is a gauge of how fast and how far price has moved recently, not a signal that a reversal is about to happen. Used as a mechanical trigger, it produces a steady stream of false signals. Used as one piece of context among several — and tested honestly before you risk anything on it — it can earn a place in your process. This guide covers what RSI actually measures, the correct formula, why the standard levels fool people, and how practitioners try to read it without getting faked out.
A word on where this article’s caution comes from. After five or six years of losing and more than a thousand indicators of my own, the pattern I would name first is not a technical one: traders lose when they are full of their own conviction. Risk and reward have to be held together, but we are human, so we fixate on the reward — that is the trap most traders fall into. An oscillator with a line at 70 and a line at 30 is very good at supplying conviction, because it turns a feeling into a number and a number looks like information. The mechanics below are worth knowing. The certainty they can manufacture is the part to be careful with.
Momentum, Expressed as a Number From 0 to 100
RSI is a momentum oscillator: it measures the speed and change of recent price movements, and it moves within a fixed range of 0 to 100 [source: StockCharts ChartSchool, “Relative Strength Index (RSI)”]. It was developed by J. Welles Wilder Jr. and introduced in his 1978 book New Concepts in Technical Trading Systems (and in Commodities magazine that June) — the same book that gave traders the Average True Range and the Parabolic SAR [source: Wikipedia, “Relative strength index”; StockCharts ChartSchool].
The key word is momentum. A high RSI does not mean a stock is “too expensive” or that a fall is due. It means recent gains have been large relative to recent losses. A low RSI does not mean a stock is “cheap” or that a bounce is coming. It means recent losses have dominated recent gains. RSI is a measure of how price has been moving, expressed as a single number so you can compare momentum across time and across instruments. What it does next is a separate question that the indicator cannot answer on its own.
How RSI Is Calculated (Plainly)
You do not need to compute RSI by hand — every charting platform does it for you — but understanding the formula is the difference between using the indicator and being used by it. The brief for this silo is explicit that formulas here must be correct, so here it is, plainly.
RSI is built from average gains and average losses over a lookback period. For each bar, the change from the prior close is either an “up” amount (if the close rose) or a “down” amount (if it fell). You then compute the average gain and average loss, and combine them:
- Relative Strength (RS) = average gain / average loss
- RSI = 100 − (100 / (1 + RS))
That formula is what forces RSI between 0 and 100: if there were no losses over the window, RS is enormous and RSI approaches 100; if there were no gains, RS is zero and RSI approaches 0 [source: Wikipedia, “Relative strength index”; StockCharts ChartSchool; QuantInsti, “RSI Indicator: Formula and Calculation”].
The standard lookback is 14 periods, the default Wilder recommended [source: Wikipedia; StockCharts]. The averaging is not a plain moving average, either — Wilder used a smoothing method where the first value is a simple 14-period average of gains and losses, and every value after that is calculated from the previous one: Average Gain = (previous average gain × 13 + current gain) / 14, and the same for losses [source: StockCharts ChartSchool, “Relative Strength Index (RSI)”; QuantInsti]. This “Wilder smoothing” is why an RSI value carries some memory of prior bars rather than snapping around on every tick.
You can change the period — a shorter setting (say 7) makes RSI more sensitive and noisier; a longer setting (say 21) makes it smoother and slower. That flexibility is useful, but it is also the first place false signals sneak in, because it is tempting to keep adjusting the period until the indicator lines up nicely with the past. That is exactly the curve-fitting trap the backtesting pillar is about — more on that below.
The 70/30 Levels — and Why They Fool People
The famous levels come straight from Wilder: he considered readings above 70 to mark a possible top (“overbought”) and readings below 30 to mark a possible bottom (“oversold”) [source: Wikipedia, “Relative strength index”; Fidelity, “What is RSI? – Relative Strength Index”]. Some traders use a stricter 80/20 to filter for more extreme readings [source: Wikipedia; StockCharts ChartSchool]. So far, so standard.
Here is where beginners lose money. “Overbought” is not a synonym for “sell,” and “oversold” is not a synonym for “buy.” In a strong trend, RSI can stay above 70 (or below 30) for a long time while price keeps going — this is the single most important limitation of the indicator, and it is well documented: in trending conditions RSI can remain in overbought or oversold territory for extended periods without any reversal, so treating a 70 or 30 reading as a mechanical trigger produces repeated false signals [source: Fidelity, “What is RSI?”; LuxAlgo, “RSI Overbought and Oversold Signals Explained”; OANDA, “A Complete Understanding of the RSI”]. That is precisely what the chart at the top of this page illustrates: a naive “sell at 70” rule would have exited the trend over and over while it kept climbing.
The practical takeaway: an overbought reading tells you momentum is strong, which in a trend is a sign of continuation as often as reversal. RSI works best as a mean-reversion tool in range-bound markets, where price oscillates between support and resistance, and works worst as a reversal trigger in strongly trending markets, where it stays extreme [source: LuxAlgo; Admiral Markets, “RSI Indicator Explained”]. Knowing which regime you are in matters more than the RSI number itself.
What the 70 line is actually asserting
The levels look arbitrary until you invert the formula. RSI is one ratio wearing a disguise: it is 100 × RS ÷ (1 + RS), where RS is simply average gain divided by average loss. So every level on the scale translates back into a plain statement about how much gains have outrun losses:
| RSI reading | Average gain vs average loss | Conventional label |
|---|---|---|
| 30 | 0.429 to 1 | oversold |
| 50 | 1.000 to 1 | neither |
| 60 | 1.500 to 1 | neither |
| 70 | 2.333 to 1 | overbought |
| 80 | 4.000 to 1 | overbought |
| 90 | 9.000 to 1 | overbought |
So “overbought at 70” means gains have outweighed losses by 2.333 to 1 over the smoothing horizon — and nothing else. It is not a probability, not a valuation, and not a statement that a move is exhausted. A market can sustain a 7-to-3 balance of gains over losses for a very long time, which is exactly why the reading persists through trends.
This is not a backtest. No market data is used and no profitability is implied; the closes below are equal-sized by construction so the arithmetic stays inspectable.
How long the indicator takes to say it — and how quickly it takes it back
Starting from balance (RSI 50), an unbroken run of equal up closes drives the reading along a closed form, because Wilder’s smoothing leaves the average gain where it was while the average loss decays by a fixed fraction each bar:
| Period | Up closes to clear 70 | RSI after a 20-close run | Down closes back under 70 | Down closes back under 50 |
|---|---|---|---|---|
| RSI(7) | 6 closes | 95.6 | 3 closes | 5 closes |
| RSI(14) | 12 closes | 81.5 | 3 closes | 8 closes |
| RSI(21) | 18 closes | 72.6 | 2 closes | 10 closes |
The standard RSI(14) needs 12 consecutive up closes to get above 70 from a standing start. That is the first thing worth absorbing: an overbought reading is not a spike, it is the summary of a sustained run. It takes a genuine trend to produce one.
The second is the asymmetry. After a 20-close run the reading sits at 81.5 — and just 3 down closes pull it back under 70, against the 12 it took to get there. A rule that sells when RSI drops back through 70 will therefore fire on a pause that undoes a small fraction of the move that triggered it. The exit condition is far cheaper to satisfy than the entry condition, which is one concrete reason the mechanical version of this trade misbehaves in exactly the trending markets that generate the signal.
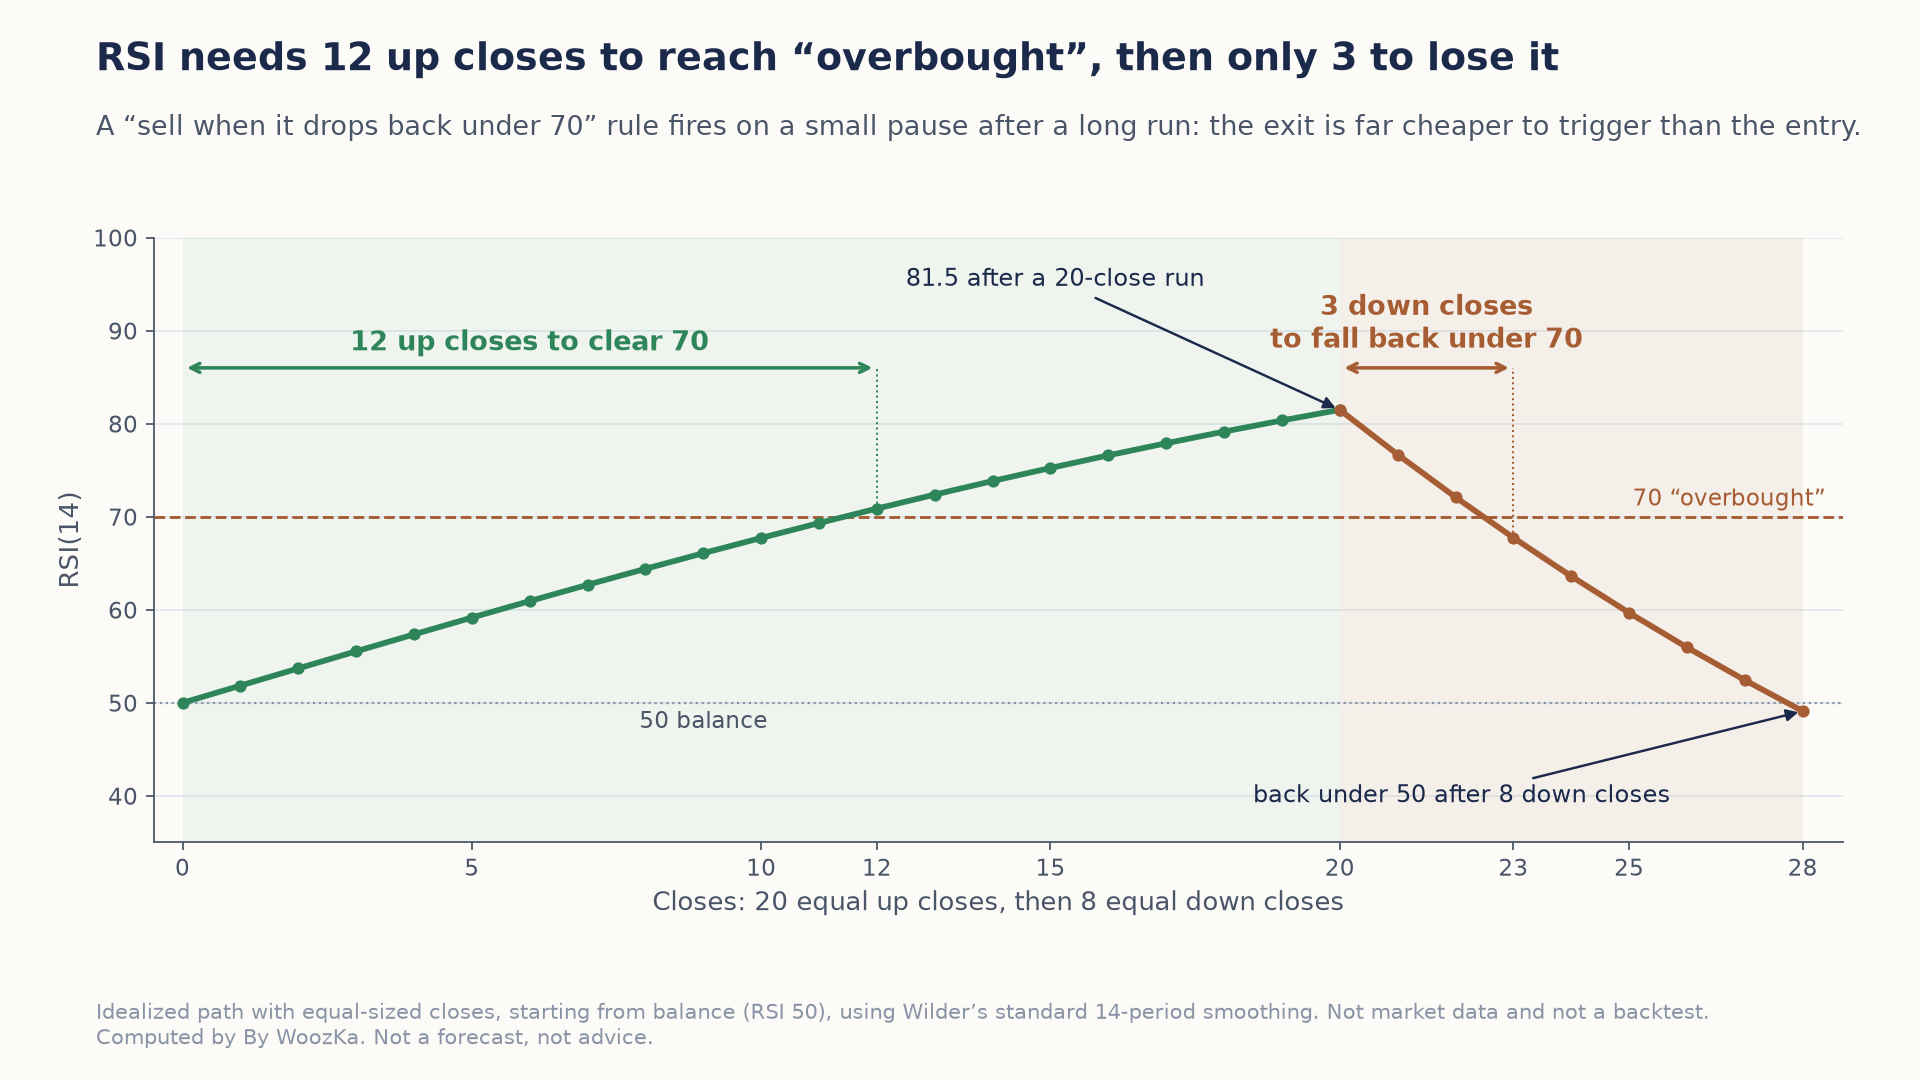 Getting above 70 takes a sustained run of 12 up closes, but after a 20-close run only 3 down closes pull RSI back under it. A rule that sells on that drop is triggered by a small pause, not by a reversal of the move.
And the reading has no ceiling to bump against on the way up. Along an unbroken run RSI(14) passes 59.2 at five closes, 67.7 at ten, 70.9 at twelve and 81.5 at twenty, climbing toward 100 without ever arriving. There is no level at which the indicator refuses to go higher, so “it cannot stay up here” has no arithmetic behind it.
Method, so it can be checked rather than taken on trust: RSI uses Wilder’s smoothing, in which each average is carried forward as (previous × (n − 1) + current) ÷ n, and RSI = 100 − 100 ÷ (1 + RS). Every figure here is generated by stepping that recursion one close at a time, and the script checks each value against the closed form 100 ÷ (1 + (1 − 1÷n)^k) as well as verifying the level-to-ratio decoding in both directions. The RSI values above are the code’s output, not hand-entered.
The Signals Wilder Himself Cared About
It is worth knowing that Wilder himself did not treat the 70/30 crossover as his main signal. He put more weight on two subtler patterns.
Divergence is a mismatch between price and momentum. A bearish divergence is when price makes a higher high but RSI makes a lower high — price is still rising, but the momentum behind it is fading. A bullish divergence is the reverse: price makes a lower low while RSI makes a higher low, hinting that selling pressure is easing. Wilder regarded divergence as one of RSI’s most significant features, and many traders still treat it as a more informative pattern than a bare overbought/oversold reading [source: StockCharts ChartSchool, “Relative Strength Index (RSI)”; Admiral Markets, “RSI Indicator Explained”].
Failure swings were Wilder’s own preferred reversal signal. A failure swing happens entirely within the RSI itself, without reference to price: for a top, RSI moves above 70, pulls back, bounces but fails to exceed its prior peak, then breaks below the low of that pullback. Because it is defined only on the indicator, Wilder considered it a strong sign of a potential reversal [source: StockCharts ChartSchool; eLearnMarkets, “RSI Failure Swings”].
Both patterns are more nuanced than “70 = sell,” and that nuance is the point. But note the honest caveat that applies to every one of these: a divergence or failure swing can appear and then keep appearing while the trend grinds on. Momentum fading is not the same as a reversal arriving. These are ways to add context, not mechanical guarantees.
How to Read RSI Without the False Signals
None of the following is a formula for a winning strategy — no indicator delivers that, and this silo’s rule is that no setup is presented as “working” without confronting the overfitting risk in the same breath. These are simply ways experienced traders reduce the false-signal rate.
Read RSI with the trend, not against it. In an uptrend, treat overbought readings as evidence of strength, and look to oversold-ish pullbacks (which in an uptrend often bottom well above 30) as the more interesting events — and vice versa in a downtrend. Fighting a strong trend because “RSI is high” is the classic error the top chart shows.
Match the levels to the regime — carefully. Some traders shift their bands in trends (for example, using 80/40 in a strong uptrend and 60/20 in a downtrend) so that ordinary trend strength does not constantly trip the “overbought” line [source: LuxAlgo, “RSI Overbought and Oversold Signals Explained”]. This can help, but it is also where curve-fitting begins: if you keep nudging the thresholds until they fit the chart in front of you, you have optimized to the past, not learned about the future.
Use divergence and failure swings as context, not triggers. They are most useful when they line up with something else — a broken trendline, a support/resistance level, a shift in volume — rather than acted on in isolation.
Confirm with price itself. RSI is derived from price, so it can never tell you more than price already contains. The most consistent advice across sources is the same: RSI should not be used as a standalone tool; pair it with the trend, price structure, or other confirmation [source: Fidelity, “What is RSI?”; Admiral Markets, “RSI Indicator Explained”].
Then test it honestly. This is the part most people skip. If you are going to use RSI in a rules-based way, run it through a proper backtest — with out-of-sample data, realistic costs, and a hard limit on how many parameter combinations you try. An RSI rule that only “works” at one precise period-and-threshold setting is almost certainly fitted to noise. That is the entire subject of the trading-systems pillar, and it is the non-negotiable disclaimer for everything in this silo: past performance, backtested or live, does not predict future results.
Picture the trader this whole article is written for: they add RSI to a chart, see it cross 70, sell, and watch the stock run another 20%. They conclude “RSI doesn’t work.” The truth is gentler and more useful — RSI worked exactly as designed; it reported strong momentum. What failed was the interpretation that strong momentum means “sell now.”
Where RSI Users Go Wrong
- Treating “overbought” as “sell.” It describes momentum, not a top. In a trend, extreme readings can persist for a long time.
- Trading RSI in isolation. It is derived from price and adds no information price doesn’t already hold; it needs confirmation.
- Using RSI as a reversal trigger in a strong trend. This is where it fails most reliably. It is far better suited to range-bound conditions.
- Optimizing the period and thresholds until the chart looks perfect. That is curve-fitting the past, and it is the most common way an “amazing” RSI rule turns into a live loser.
- Mistaking a divergence for a reversal. Momentum can fade for a long time before — or without — price turning. Divergence is context, not a countdown.
- Assuming everyone uses 14/70/30. They are defaults, not laws; different settings suit different instruments and timeframes, but changing them is a decision to test, not to guess.
Testing Any of This Before You Trade It
RSI is one instrument in a much larger kit, and the reading it gives you is only ever as good as the testing behind the rule you attach to it:
- How to Backtest a Trading Strategy the Right Way — the pillar every indicator rule should pass through before you risk money on it, including why an over-tuned RSI setting is a textbook overfit.
- What Is Overfitting in Backtesting (And How to Avoid It) — the deeper dive on the single trap that turns a great-looking RSI rule into a live loser.
- Moving Averages Explained: SMA vs EMA, MACD Explained, and Bollinger Bands Explained — what these other indicators actually measure and their own known false-signal patterns, so you build rules on honest components.
If you want the plain-English, rigor-first read on indicators and systems — explained honestly, never hyped — that is what the newsletter is for. Subscribe below.
Disclaimer: This article is educational content, not financial advice. I am not a licensed financial advisor, and nothing here is a recommendation to buy or sell any security or asset. Investing and trading involve risk, including the possible loss of the money you invest. Do your own research and consider consulting a licensed financial professional before making investment decisions. Read the full Disclaimer.
Historical and backtested results are hypothetical, carry inherent limitations, and do not guarantee future results. Figures were accurate to the best of my knowledge as of this article’s last-updated date and may have changed.
