Mean Reversion vs Trend Following: Which Strategy Style Fits You?
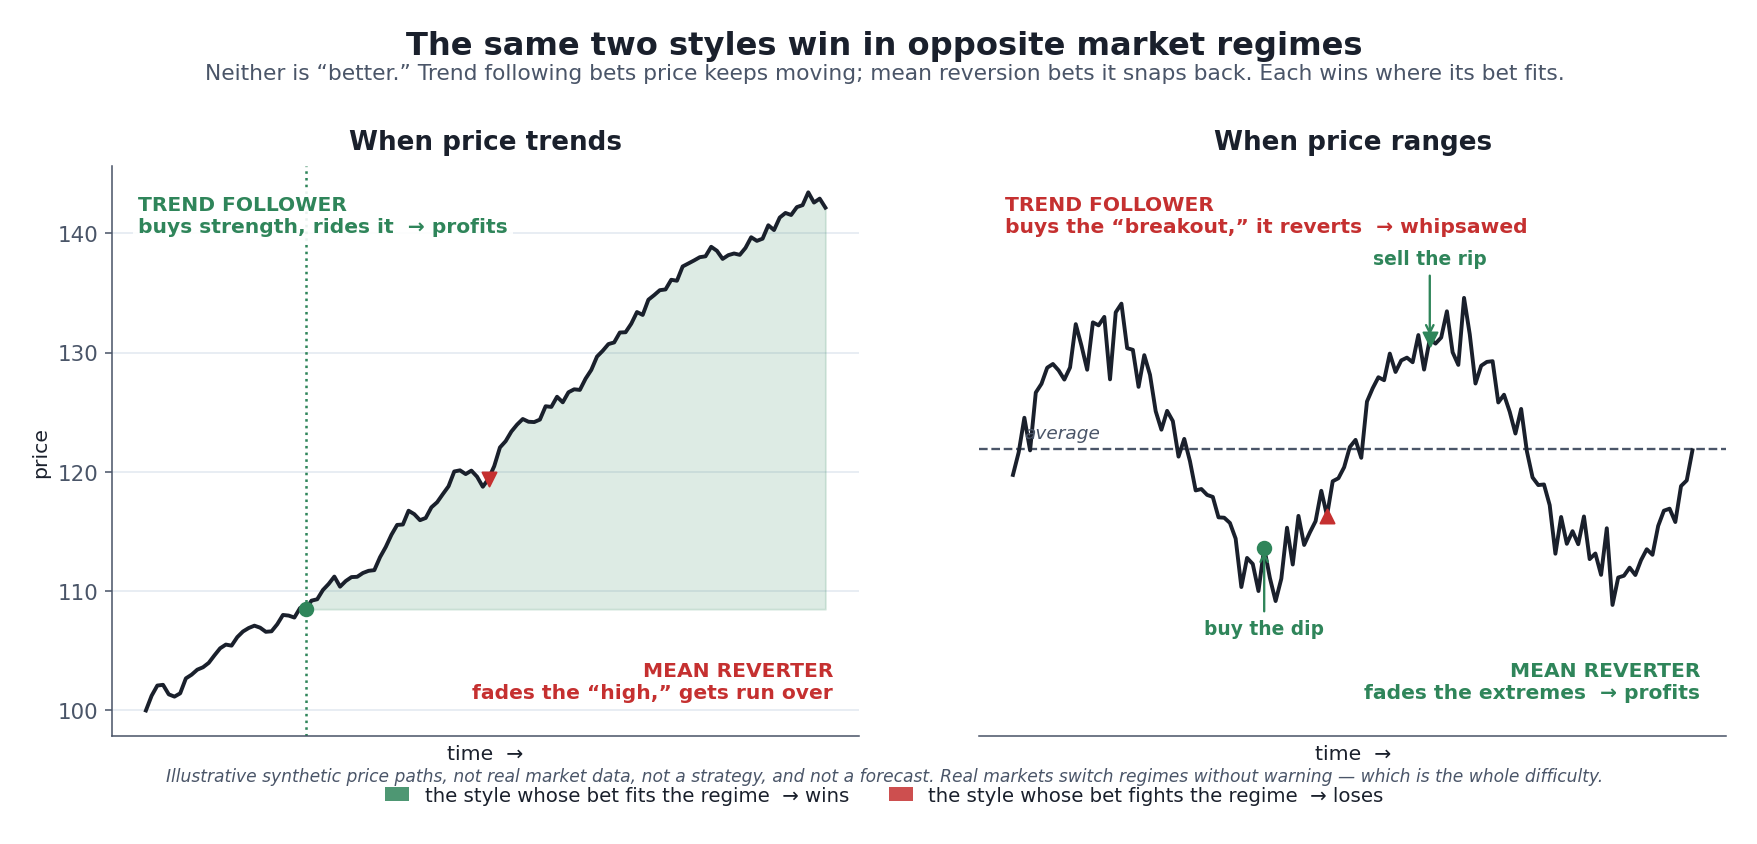 The whole debate in one picture. On the left, price trends — and the style that bets on continuation (trend following) wins while the style that bets on snap-back (mean reversion) gets run over. On the right, price ranges — and the two outcomes flip. The same two strategies, opposite results, decided entirely by which regime the market happened to be in. That is why “which is better” is the wrong question.
Ask a room of traders whether mean reversion or trend following is the better approach and you will start an argument that never ends — because it is the wrong question. These are not two answers to the same problem. They are two opposite bets on what price does next, and each one wins in the exact market conditions where the other one loses. Trend following bets that a move already underway will keep going. Mean reversion bets that a price stretched away from its average will snap back. Pick a market and a time period and one of them looks like genius while the other looks like a fool — then the market changes character and the labels swap. Neither is “the better one.” The useful question is which bet you can actually live with.
This is a trading-systems article, so the silo’s non-negotiable rule governs every line of it: past backtest performance does not predict future results. Everything below describes what these two styles have done — in academic studies, across decades of data — never what they will do for you. Both have long, documented track records. Both also have long, documented stretches where they bled money. If you take one paragraph from this piece, take that one: any edge either style has ever shown comes bundled with a failure mode you have to be able to survive, and the honest work is deciding which failure mode you can stomach.
Two Bets on What Price Does Next
Strip away the indicators and both styles reduce to a single sentence about price behavior.
Trend following (also called momentum) bets on continuation. If a market has been going up, the trend follower buys it because it has been going up, expecting the move to persist, and holds until the trend clearly breaks. The signal is strength itself. The trader is deliberately buying near highs and selling near lows — the opposite of “buy low, sell high” — on the theory that strength begets strength until it doesn’t.
Mean reversion bets on the snap-back. It assumes prices oscillate around some “fair” or average level, and that when price stretches unusually far from that average, it tends to return. So the mean reverter does the intuitive thing: buys when price has fallen well below its recent average (“the dip”) and sells when it has risen well above it (“the rip”). The signal is distance from normal, and the bet is that the rubber band pulls back.
You can already feel the tension. One style buys strength; the other sells it. One assumes moves continue; the other assumes they exhaust. Put a trend follower and a mean reverter in front of the same chart at the same moment and they will often want to do exactly opposite things. That is not a bug in either method — it is the whole point. They are designed to harvest different behaviors of the same market.
The tools each style reaches for follow directly from the bet. Trend followers lean on moving averages and MACD — indicators built to measure and confirm the direction and persistence of a move. Mean reverters lean on oscillators like RSI and Bollinger Bands — indicators built to flag when price has stretched to an extreme relative to its own recent range. The indicator is downstream of the philosophy; choosing RSI over a moving-average crossover is really choosing to bet on reversion over continuation.
The Reconciliation: They Live at Different Time Horizons
Here is the part that resolves the “which is right” argument, and it is worth slowing down for, because it is the single most useful idea in this whole topic. Momentum and mean reversion are not contradictory claims about markets. They are true at different time horizons. A market can trend over months and revert over years — both at once — and the academic evidence says roughly that.
On the momentum side, the foundational study is Jegadeesh and Titman’s 1993 paper “Returns to Buying Winners and Selling Losers,” which found that U.S. stocks that had outperformed over the prior 3–12 months continued to outperform over the next 3–12 months, earning on the order of 1% per month across sixteen different formation-and-holding combinations — the result that put momentum on the academic map [source: Narasimhan Jegadeesh & Sheridan Titman, “Returns to Buying Winners and Selling Losers: Implications for Stock Market Efficiency,” Journal of Finance 48(1), 1993, pp. 65–91]. The same continuation shows up directly in prices, not just relative rankings: Moskowitz, Ooi, and Pedersen’s 2012 “Time Series Momentum” found that a simple 12-month trend signal positively predicted the next month’s return across 58 liquid futures markets spanning equities, currencies, commodities, and bonds — and, crucially, that this persistence lasts about a year and then partially reverses over longer horizons [source: Tobias Moskowitz, Yao Hua Ooi & Lasse Heje Pedersen, “Time Series Momentum,” Journal of Financial Economics 104(2), 2012, pp. 228–250].
That word — reverses — is the bridge. Push the horizon out to three-to-five years and the sign flips. De Bondt and Thaler’s 1985 “Does the Stock Market Overreact?” found that portfolios of long-term losers went on to outperform long-term winners over the following years, consistent with markets overreacting and then correcting [source: Werner De Bondt & Richard Thaler, “Does the Stock Market Overreact?,” Journal of Finance 40(3), 1985, pp. 793–805]. So the medium term drifts (momentum) and the long term snaps back (reversion). There is also short-term, even intraday, mean reversion in many markets — noise around a level that fades within hours or days.
Read together, the picture is coherent: the same market can reward a trend follower on a 3-to-12-month horizon and a mean reverter on a multi-year (or a same-day) horizon. They are not fighting over one truth; they are fishing at different depths. This is why “which style is right” dissolves into “which horizon am I trading, and does my temperament fit it.” You are not choosing the correct theory of markets. You are choosing where in time to place your bet.
Each Wins in the Opposite Regime — and Each Has Its Drought
Horizon explains why both can be true. Regime explains why, over any given stretch, one looks brilliant and the other looks broken. A market is either trending (moving persistently in one direction) or ranging (chopping sideways around a level), and — as the chart at the top lays out — each style is built to profit from one of those regimes and to lose in the other.
Trend following pays off in sustained trends and, notably, in crises. When a market moves far in one direction, the trend follower is positioned for exactly that and lets the winner run. The strongest evidence here is Hurst, Ooi, and Pedersen’s 2017 “A Century of Evidence on Trend-Following Investing,” which reconstructed a simple time-series-momentum strategy across 67 markets back to 1880 and found it delivered positive average returns in every decade from 1880 to 2016, and performed well in 8 of the 10 largest crisis periods for a traditional stock/bond portfolio — the property practitioners call “crisis alpha” [source: Brian Hurst, Yao Hua Ooi & Lasse Heje Pedersen, “A Century of Evidence on Trend-Following Investing,” Journal of Portfolio Management 44(1), 2017, pp. 15–29]. Trends often run longest precisely when markets are panicking.
But that same style bleeds in choppy, directionless markets — the range on the right side of the chart — where every “breakout” it buys reverses and stops it out, over and over. This is not hypothetical. Trend-following strategies endured a well-documented multi-year drought through much of the 2010s; AQR’s research paper “You Can’t Always Trend When You Want” attributed the weak stretch not to the strategy losing its ability to capture trends, but simply to markets making fewer large moves over that period — the fuel trend following runs on had dried up [source: AQR Capital Management, “You Can’t Always Trend When You Want”]. A trend follower has to survive long flat stretches of small losses to be there for the occasional big move, and there is no rule that says the big move arrives this year.
Mean reversion pays off in ranges and gets run over by strong trends. In a market oscillating around a level, fading the extremes — buying dips, selling rips — captures the swings the trend follower gets whipsawed by. But when a genuine trend takes hold, the mean reverter is doing the most dangerous thing in trading: repeatedly betting against a move that keeps going, “catching a falling knife” on the way down or shorting strength on the way up. A fade strategy can look wonderful for months of quiet markets and then hand back a year of gains in a single trend it kept fighting.
And trend following has a sharper, faster failure mode of its own. Daniel and Moskowitz’s 2016 “Momentum Crashes” documented that momentum suffers infrequent but severe crashes in “panic” states — typically after large market declines, when volatility is high, during sharp rebounds — when the beaten-down losers the strategy is short suddenly rocket higher [source: Kent Daniel & Tobias Moskowitz, “Momentum Crashes,” Journal of Financial Economics 122(2), 2016, pp. 221–247]. So the honest scorecard is symmetric: both styles have a century of evidence that they have worked, and both have long, ugly, well-documented periods where they didn’t. Anyone who shows you one side of that ledger is selling something.
The Win-Rate Trap: Why Expectancy Is the Real Question
Before you can even compare these styles fairly, you have to disarm the single most misleading number in trading: the win rate. It is the number every “90% winning strategy” ad leads with, and on its own it tells you almost nothing about whether a system makes money.
The reason is that the two styles have opposite win-rate signatures, and both can be excellent or terrible:
- Trend following typically has a low win rate — often only 30–40% of trades are winners. It takes many small losses (every failed breakout, every whipsaw in a range) in exchange for a few very large winners when a real trend runs. Its profit lives entirely in the size of those rare winners, not in how often it is right.
- Mean reversion typically has a high win rate — often 60–80% of trades win, because in a range price usually does snap back, and each win is small and quick. Its danger lives in the rare loss: the time it faded a move that turned into a trend and the small, reliable wins were erased by one large loss it refused to cut.
Put those side by side and the trap is obvious. A high win rate can hide a strategy that is one bad trend away from disaster; a low win rate can belong to one of the most robust approaches ever studied. Win rate alone is noise. The number that actually matters is expectancy — the average profit or loss you can expect per trade, which combines how often you win with how much you win and lose:
Expectancy = (Win % × Average Win) − (Loss % × Average Loss)
A trend system that wins just 35% of the time but whose average winner is four times its average loser has a strongly positive expectancy: (0.35 × 4) − (0.65 × 1) = +0.75 units of risk per trade. A mean-reversion system that wins 80% of the time but whose rare losers are six times its typical small winner has a negative expectancy: (0.80 × 1) − (0.20 × 6) = −0.40 — a strategy that wins four out of five trades and still bleeds you dry [source: standard expectancy definition; the paired win-rate/payoff examples are illustrative arithmetic, not the results of any specific strategy]. This is why the whole silo insists on it: win rate is one input to expectancy, never a measure of quality on its own. Whichever style you lean toward, judge it by expectancy — and remember that even a positive expectancy is a historical, backtested description, not a promise of the next hundred trades.
(Expectancy tells you whether an edge exists; it does not tell you how much to bet on it. That second question — the one that decides whether a positive-expectancy system survives its own losing streaks — is position sizing, and it deserves its own treatment.)
Running the Expectancy Formula on This Article’s Own Numbers
The section above publishes everything the formula needs and never multiplies it out. It gives two win-rate bands — 30–40% for trend following, 60–80% for mean reversion — and it gives payoff signatures for both styles. Crossing them is one multiplication per cell, and the answers are sharper than the argument they were meant to support. Every figure below came off the shipped code behind the Trade Expectancy Calculator, transcribed rather than worked out by hand, so each row is reproducible in your own browser.
Same Expectancy, Thirty Points of Win Rate Apart
Start with the two price examples this article uses: a trend trade entering at $100 with a $95 stop and a $115 target, which is 3:1, and a mean-reversion trade entering at $100 with a $97 stop and a $103 target, which is 1:1. Give each style the payoff it was assigned and the win-rate band it was assigned, and read across.
| Trend, 3:1 | Expectancy | Mean reversion, 1:1 | Expectancy |
|---|---|---|---|
| 30% | +0.20 R | 60% | +0.20 R |
| 35% | +0.40 R | 70% | +0.40 R |
| 40% | +0.60 R | 80% | +0.60 R |
The two columns are not close. They are identical, exactly, at every row — and that is not a coincidence of the three rows chosen. With the average loss as the unit, trend following at 3:1 earns 4W − 1 and mean reversion at 1:1 earns 2V − 1, so the two are equal precisely when V = 2W. The band this article reports for mean reversion, 60–80%, is the band it reports for trend following, 30–40%, doubled. The match therefore holds across the whole of both bands, not just where it was sampled. Two styles whose win rates differ by thirty percentage points, on this article’s own figures, are worth the same per unit risked — which is the piece’s central claim that neither is better, arriving from arithmetic it had already published rather than from argument.
One caution about which number you read. Profit factor, the other statistic these systems get judged on, is not equal down those rows: it runs 1.286, 1.615 and 2.000 for the trend column against 1.500, 2.333 and 4.000 for the mean-reversion column. Same expectancy, and one style looks twice as good. The win rate is not the only metric that can mislead you about a system — it is only the most popular one.
The Comparison That Moves Two Things at Once
The section’s headline contrast sets a trend system winning 35% with a 4:1 payoff against a mean-reversion system winning 80% whose rare losers are six times its winners, and reads the reversal as the win-rate trap. But the payoff changed in the same step. Move one variable at a time and it becomes clear which one did the work. All four rows are stated per unit risked, so they compare.
| Configuration | Win rate | Payoff | Expectancy |
|---|---|---|---|
| Trend example | 35% | 4:1 | +0.750 R |
| Win rate only | 80% | 4:1 | +3.000 R |
| Payoff only | 35% | 1:6 | −0.592 R |
| Both | 80% | 1:6 | −0.067 R |
Raising the win rate from 35% to 80% and touching nothing else multiplied expectancy by exactly four, from +0.750 R to +3.000 R. It made the system dramatically better. Changing the payoff alone is what turns the number negative. So in the article’s own illustration the high win rate was not the culprit at all — it was worth +2.250 R of help, pushing in the opposite direction from the conclusion drawn beside it. The case against win rate is stronger than the example makes it look: the number is not merely uninformative here, it points the wrong way. (The two single moves do not add up to the total move, and should not be expected to. Expectancy multiplies win rate by payoff, so the two interact rather than stacking.)
A note on units, since it affects how the published pair reads. The article’s +0.75 is measured per unit of risk, while its −0.40 is measured per unit of winner — that system’s average win is 1 and its average loss is 6. Put both on the same footing and −0.40 becomes −0.067 R, as in the last row. The sign is what the article claims, and the sign does not change.
Where Each Signature Breaks Even
Every payoff ratio implies a win rate below which the system loses money regardless of how good it feels. This article supplies four payoff signatures and two win-rate bands, so each signature can be set against the band reported for its own style.
| Signature | Breakeven | Reported band | Clears it? |
|---|---|---|---|
| Trend, 4:1 | 20.000% | 30–40% | Entirely |
| Trend, 3:1 | 25.000% | 30–40% | Entirely |
| Mean reversion, 1:1 | 50.000% | 60–80% | Entirely |
| Mean reversion, 1:6 | 85.714% | 60–80% | Nowhere |
Three of the four clear their band with room — the 3:1 trend trade by 5 to 15 points, the 1:1 mean-reversion trade by 10 to 30. The fourth clears it nowhere. A system whose rare losses are six times its typical win needs to be right six times out of seven, 85.714%, and the band this article reports for mean reversion stops at 80%. That puts the requirement 5.714 points above the best case the same section describes, which is the exact version of the warning that such a strategy “wins four out of five trades and still bleeds you dry.” Four out of five is not close to enough; six out of seven is the line.
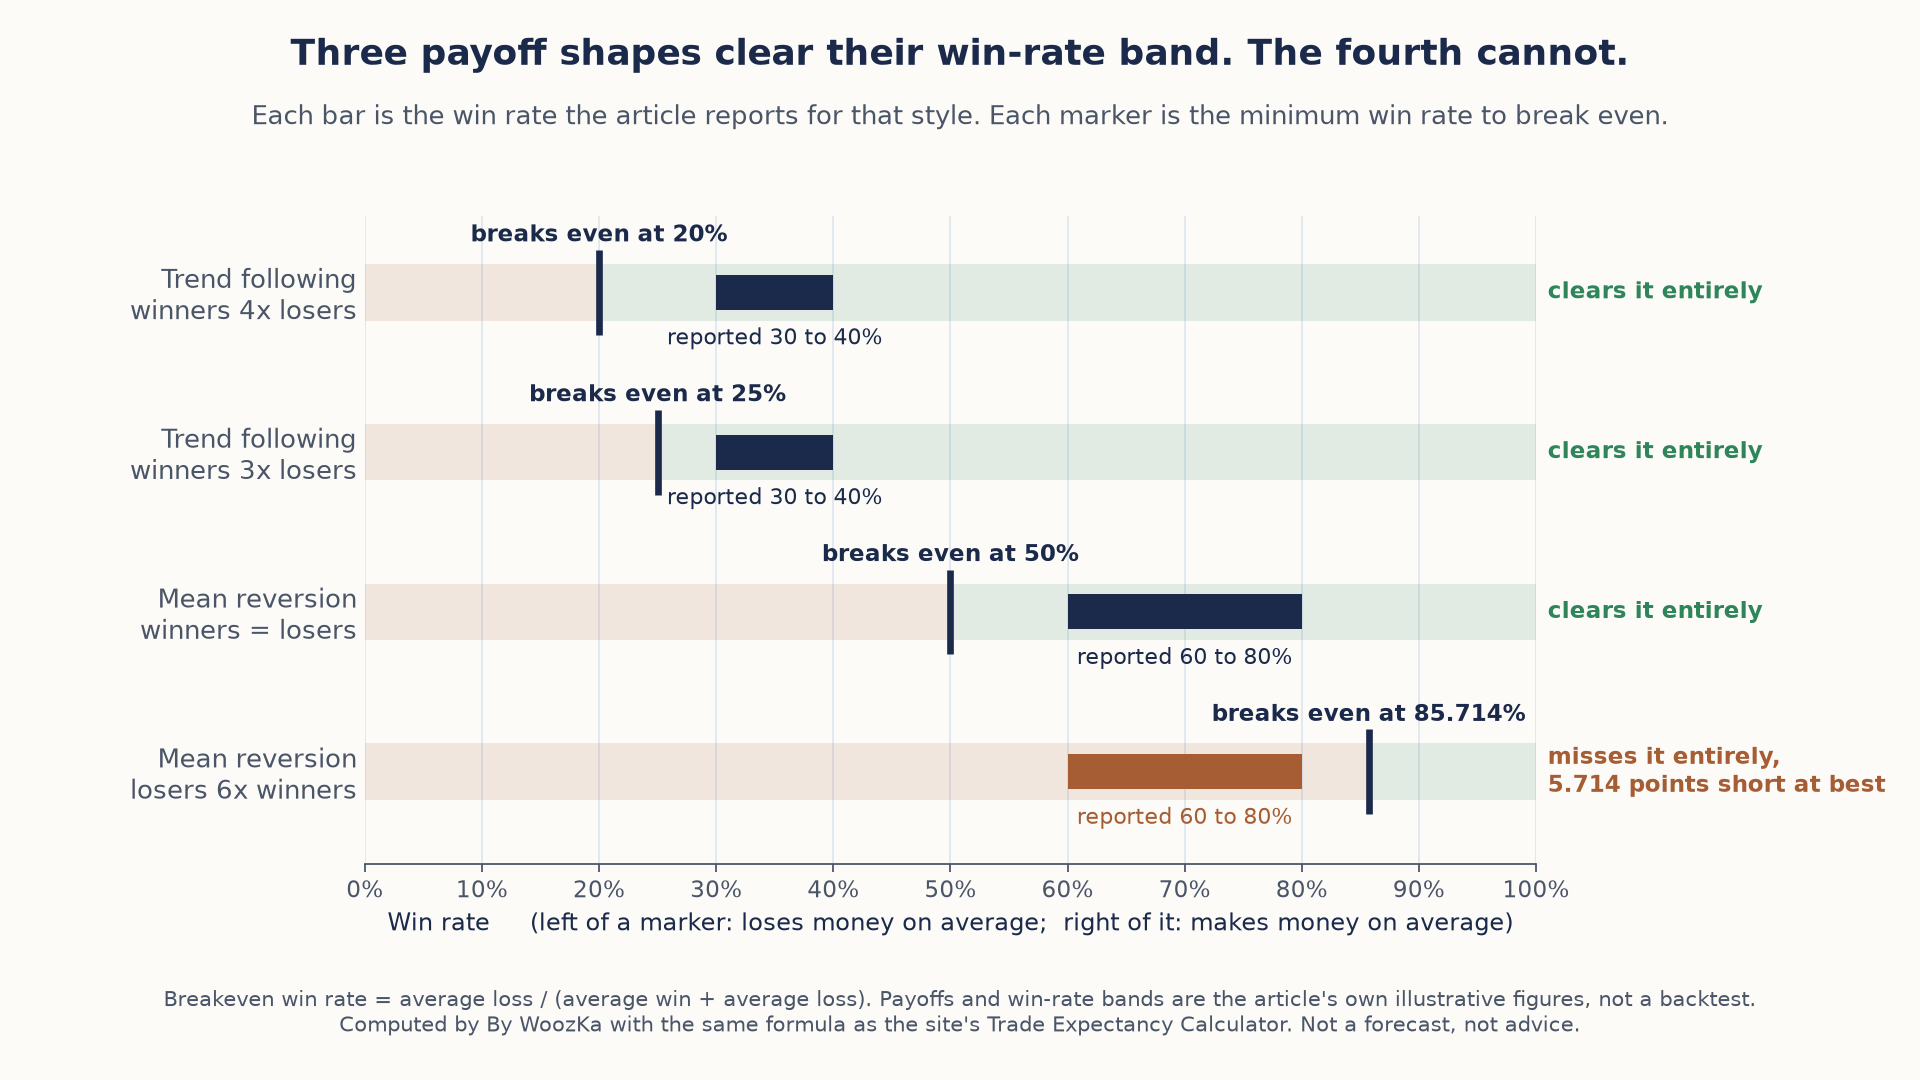 The same mean-reversion style and the same win-rate band clear breakeven easily with even payoffs and miss it entirely when the rare loss is six times the typical win, so the assumed loss size, not the style, decides the result.
The comparison worth ending on is the two mean-reversion rows, because they are both this article’s own. One of them clears its win-rate band by up to thirty points and the other misses it entirely, and the style, the horizon and the win rate are the same in both. The only thing that changed is what you assume about the size of the rare loss. That is the same lesson the regime sections reach by a different route: the label on the strategy is not what decides the outcome. It also explains why nothing above says which style is better, and why nothing above could.
What this section settles, what it does not, and how it was worked out. Every cell came from computeExpectancy and computeRiskReward, the shipped functions behind this site’s Trade Expectancy and Risk / Reward calculators, called directly and transcribed; separate code re-derives all of them and checks each against the calculator’s own output to twelve decimal places before it reports anything. The win-rate bands, the payoff ratios and the two price examples are this article’s own, and its four published figures — +0.75, −0.40, the 25% breakeven and the 50% breakeven — were recomputed and confirmed correct. Nothing here is a backtest: no market data was used, no strategy was tested, and these illustrative payoffs are assumed for teaching exactly as the article assumes them. R means one unit of the average loss. As the article says of every figure in it, arithmetic on assumed inputs describes those inputs and predicts nothing about the next hundred trades.
So Which One Fits You?
Because neither style is superior, the real decision is about you — your temperament, your time, and the kind of pain you can tolerate without abandoning the plan. A strategy you can’t emotionally hold through its bad stretch is worse than no strategy, because you will quit it at the worst moment. So match the failure mode to your wiring, not the backtest to your hopes.
Trend following asks you to tolerate being wrong most of the time and flat for long stretches. You will take a steady drip of small losses, watch choppy markets nickel-and-dime you, and sit through months — sometimes years — where nothing trends and the account grinds sideways. The payoff comes in occasional bursts, and you have to still be in the seat, sized the same, when the big move finally shows up. It tends to suit people who are patient, unbothered by a low win rate, comfortable letting winners run past the point where it feels greedy, and able to ignore an account that isn’t making new highs. Longer-horizon trend approaches can also be relatively lower-touch — a good fit if you cannot watch screens all day.
Mean reversion asks you to tolerate rare, sharp gut-punches in exchange for frequent small wins. Most days it feels great: you buy dips, they bounce, you bank a quick profit, you are right far more often than not. The discipline it demands is brutal in a different way — you must cut the fade the moment it turns into a trend, rather than “averaging down” into a position that is proving you wrong. One refusal to cut can undo months of small wins. It tends to suit people who are decisive, can take a stop without ego, are energized rather than drained by more frequent activity, and won’t be seduced by the high win rate into thinking the strategy is safe. Many mean-reversion approaches are also more active and shorter-horizon, which means more screen time and more decisions.
Three honest questions do most of the sorting:
- What horizon can you actually hold? If you can leave a position alone for months, trend following is available to you; if you want your answer in hours or days, you are likely in mean-reversion (or short-term) territory. Your available time and attention are a real constraint, not a footnote.
- Which pain will make you quit? Everyone says they can handle drawdowns until they meet theirs. Would you more likely abandon a system during a long, boring, grinding flat stretch (trend following’s signature), or during one sudden, violent loss after a long winning streak (mean reversion’s)? Choose the pain you’re built to endure.
- Will a high win rate fool you? If seeing “80% winners” would tempt you to oversize and stop respecting your stops, mean reversion’s psychology may be a trap for you specifically — regardless of its math.
Notice there is no recommendation hiding in any of that. The answer that fits you might be neither in its pure form — many systematic traders deliberately run both, precisely because they profit in opposite regimes and their drawdowns don’t line up, so the combination is steadier than either alone. That diversification-across-styles idea is a legitimate reason not to choose at all. What you should not do is pick a style because a backtest or an influencer told you it “works.” It worked, past tense, in the regimes it was tested on — and the next regime gets a vote.
Both Styles Are Easy to Fool Yourself With
One last caution that applies with equal force to both bets, because it is where sincere beginners lose the most money: both mean reversion and trend following are extraordinarily easy to overfit. Any illustrative rule set in this article — “buy when price is 2 standard deviations below its 20-day average,” “go long when the 50-day crosses above the 200-day” — is exactly that, illustrative, with its edge assumed for teaching, not demonstrated and certainly not recommended. The moment you start tuning those thresholds to make a backtest look prettier, you have stopped discovering an edge and started curve-fitting one into existence.
This trap is symmetric. It is trivial to find some moving-average pair that would have caught the last big trend beautifully, and equally trivial to find some oscillator threshold that would have nailed every dip in a range you already know happened. Both will look spectacular in-sample and fall apart the moment the regime changes — which is the entire reason this silo hammers on out-of-sample testing, walk-forward analysis, and the fact that most systems that dazzle in a backtest fail live. Choosing a style is the beginning of the work. Proving that the style has a real, regime-robust edge — rather than a curve-fit ghost of one — is the hard part, and it is the same rigorous, skeptical process no matter which of the two bets you prefer.
If you have ever watched one style flatter you for a season — mean reversion feeling infallible through a quiet, range-bound market, or a trend system printing money in a strong run — and quietly concluded you’d found “the one that works,” you already know how this ends. The market shifts regime without asking, the flattery stops, and the style you were sure about starts doing the thing the studies warned it would. The lesson isn’t that the style was bad. It’s that the regime was doing the work, and the regime always changes.
Testing Whichever Style You Pick
Choosing a style is step one. The rest of the Trading Systems cluster is about judging whether the style you chose actually has an edge — and keeping it alive once you’re trading it:
- How to Backtest a Trading Strategy the Right Way — the pillar. Whichever style you lean toward, this is how you test it without fooling yourself.
- What Is Overfitting in Backtesting (And How to Avoid It) — why both a tuned oscillator and a tuned moving-average crossover can look perfect in-sample and mean nothing out-of-sample.
- Position Sizing Rules for Systematic Traders — expectancy says whether an edge exists; position sizing decides whether it survives its drawdowns. Both styles need it, and their drawdowns look very different.
- Why Most Trading Systems Fail Out-of-Sample and Walk-Forward Analysis: Testing a Strategy Like a Quant — how to check that a style’s edge is regime-robust, not a ghost of the period you tested on.
- Moving Averages Explained and MACD Explained — the core trend-following tools; remember they measure continuation, not truth.
- RSI Explained and Bollinger Bands Explained — the core mean-reversion tools; they flag stretched prices, which is a warning, not a guarantee of a snap-back.
If you want the plain-English, rigor-first read on building and judging trading systems — the honest version, where every edge comes with its failure mode attached — that is what the newsletter is for. Subscribe below to get the system-builder’s checklist.
The two signatures, quantified: a trend-following trade entering at $100 with a $95 stop and a $115 target is 3:1, and only has to be right 25% of the time to break even. A mean-reversion trade entering at $100 with a $97 stop and a $103 target is 1:1 and needs 50%. That single number is why the two styles carry opposite win rates and why comparing them on win rate alone is meaningless. The Risk / Reward Ratio Calculator returns the breakeven win rate for any entry, stop and target.
Disclaimer: This article is educational content, not financial advice. I am not a licensed financial advisor, and nothing here is a recommendation to buy or sell any security or asset. Investing and trading involve risk, including the possible loss of the money you invest. Do your own research and consider consulting a licensed financial professional before making investment decisions. Read the full Disclaimer.
Historical and backtested results are hypothetical, carry inherent limitations, and do not guarantee future results. Figures were accurate to the best of my knowledge as of this article’s last-updated date and may have changed.
