Leverage in Forex: Why It Cuts Both Ways
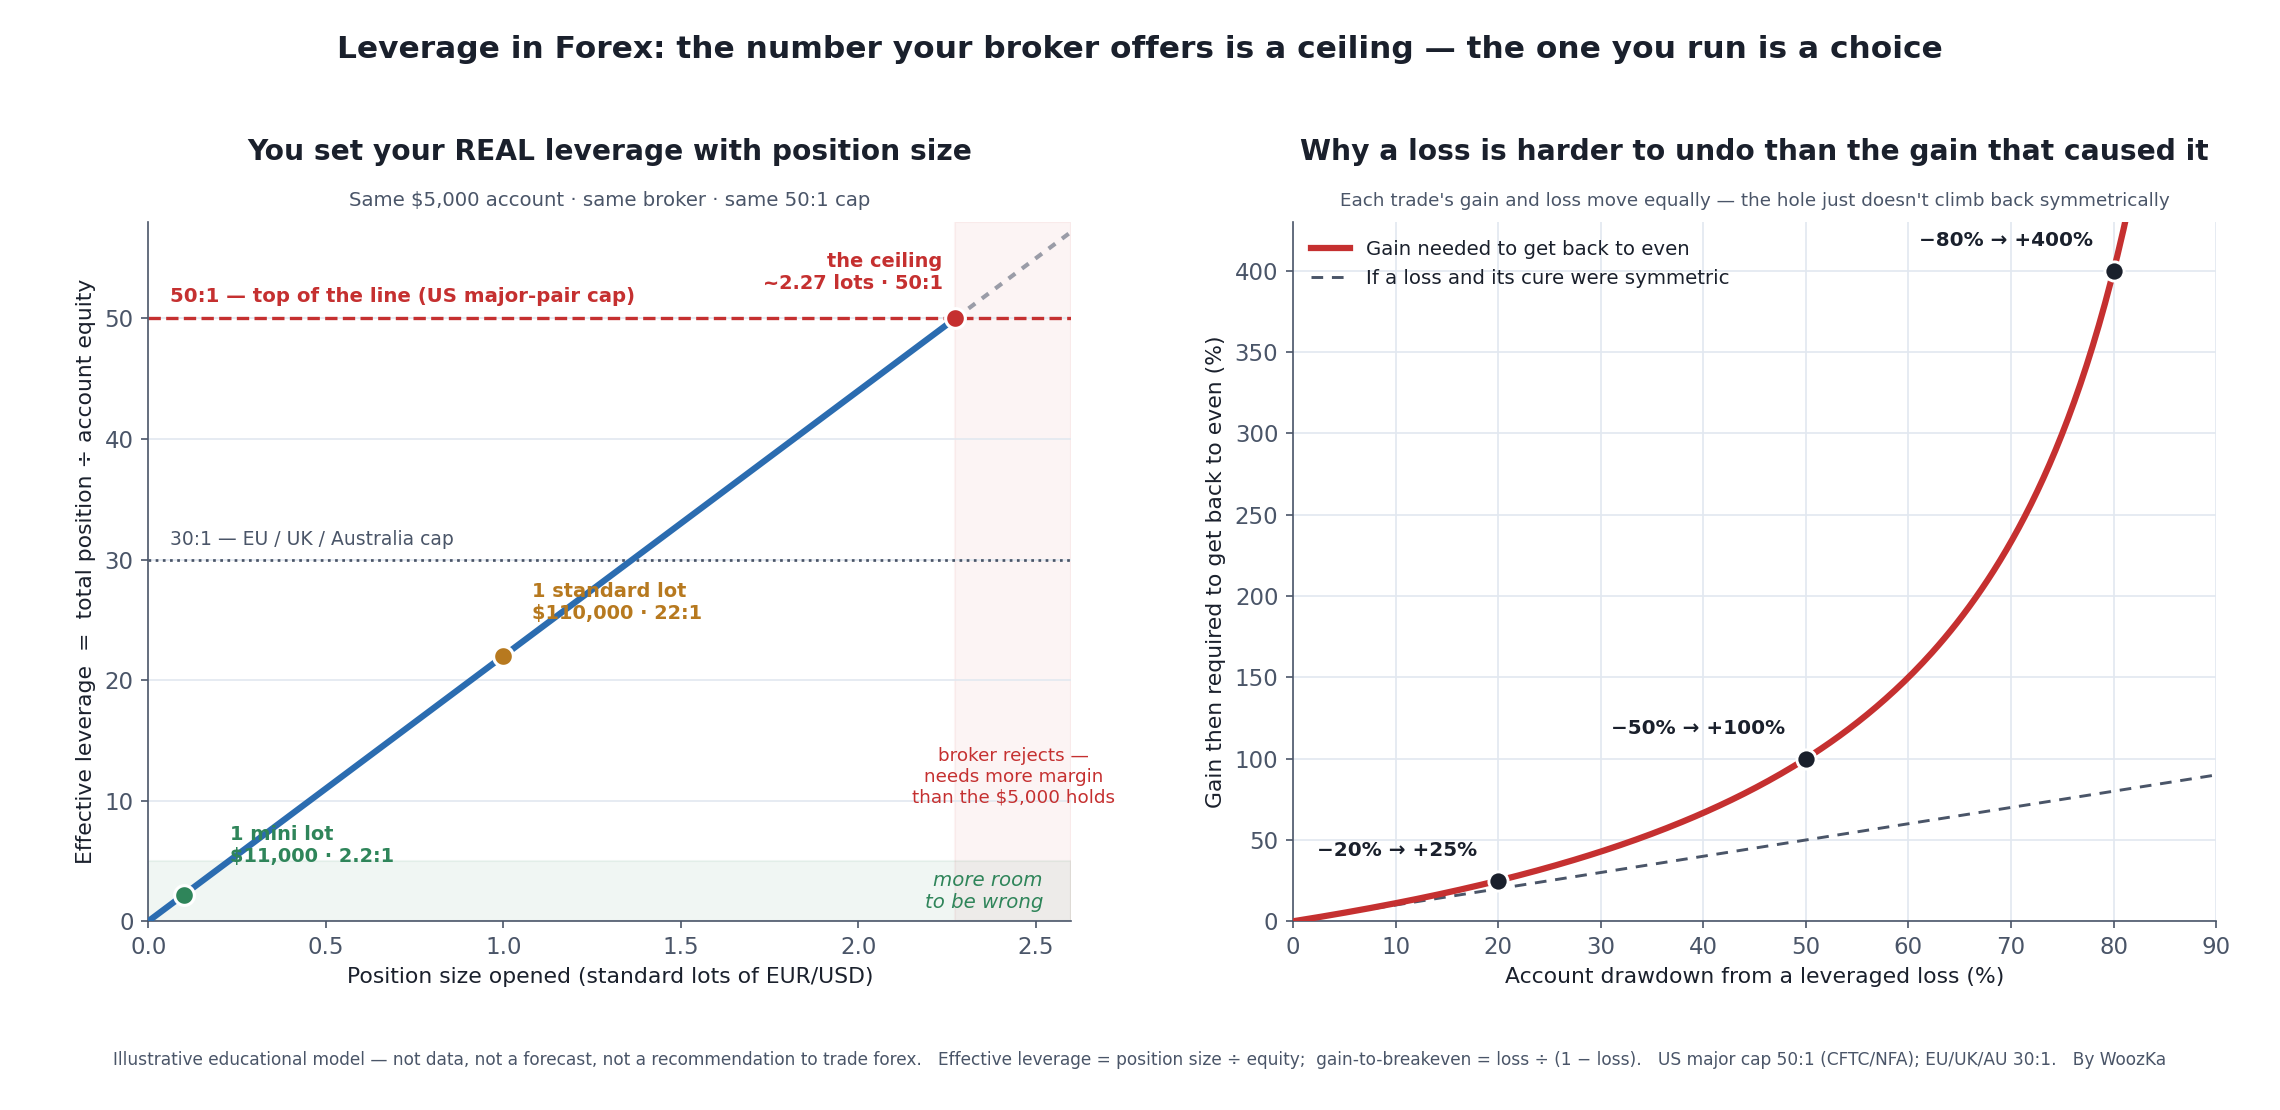 The whole article in one picture: the leverage your broker advertises is the top of the left-hand line — a ceiling. Where you actually sit on that line is set by your position size, not by the broker. And the right-hand panel is why sitting high on it is so dangerous: the deeper the hole, the more disproportionate the climb back out.
The forex pillar made one point louder than any other: leverage multiplies your losses exactly as much as it multiplies your gains, and in a fast market a leveraged loss can exceed everything you deposited and leave you owing the broker. If you haven’t read How Forex Trading Actually Works yet, start there — it walks through pips, lots, and the margin math this article assumes.
This article answers the question that the pillar’s warning leaves hanging: if leverage is that dangerous, how does anyone use it without blowing up? The answer is a distinction almost no beginner is taught, and it is the difference between traders who survive and traders who don’t. The leverage number your broker offers is a ceiling, not an instruction. The leverage you actually run — the one that decides your risk — is something you set every single time you choose a position size. Get that distinction and forex leverage stops being a mystery. Miss it, and the broker’s “up to 50:1” reads like a target instead of a hazard sign.
This is not an “easy income” or “side hustle” article — that framing is exactly the promotional pattern this blog exists to counter, and the regulator loss data below is the reason. It is a plain, arithmetic look at what leverage is, the two very different numbers people call “leverage,” and why the loss side of the equation is even worse than “cuts both ways” suggests.
Two Numbers People Both Call “Leverage”
When a trader says “I’m using 50:1 leverage,” they could mean either of two things — and only one of them is under their control.
Maximum available leverage is the ceiling set by your broker and capped by your regulator. In the U.S., that ceiling is 50:1 on major currency pairs and 20:1 on everything else, set by the CFTC and enforced through NFA Compliance Rule 2-43(b) [source: CFTC retail forex security-deposit rule, 17 CFR 5.9(a)(1) — 2% of notional value for major currency pairs, 5% for all others; NFA Compliance Rule 2-43(b)]. It is the same thing as a margin requirement, just written the other way around: 50:1 leverage is a 2% margin requirement, because 1 ÷ 0.02 = 50. A 20:1 cap is a 5% requirement; the EU’s 30:1 cap is a 3.33% requirement. Whenever you see a leverage ratio, you can convert it to the deposit percentage — and vice versa — with leverage = 1 ÷ margin %.
Effective (real) leverage is completely different. It is the ratio between the total size of the positions you actually hold and the equity actually in your account:
Effective leverage = total position size (notional) ÷ account equity
This is the number that determines your risk [source: standard definition of real vs. margin-based leverage; the arithmetic below is checkable]. The broker’s ceiling only tells you the most leverage you’re allowed to use. Your effective leverage tells you how much you’re actually using — and it can be anywhere from a fraction of 1:1 up to the ceiling, depending entirely on how big a position you open. Two traders with the same $5,000 account at the same broker under the same 50:1 cap can be running wildly different real risk. The cap is identical; the choice is not.
The Math That Actually Matters: Effective Leverage, Worked Three Ways
Take a $5,000 account at a U.S. broker offering 50:1 on majors, trading EUR/USD at 1.1000. From the pillar, recall that one standard lot is 100,000 units, so it controls 100,000 × 1.1000 = $110,000 of currency, and one pip is worth $10 on a standard lot.
Trade A — one mini lot. A mini lot is 10,000 units → $11,000 of currency controlled. – Effective leverage = $11,000 ÷ $5,000 = 2.2:1. – A routine 100-pip move is worth $100 — 2% of the account on that trade.
Trade B — one standard lot. 100,000 units → $110,000 controlled. – Effective leverage = $110,000 ÷ $5,000 = 22:1. – The margin tied up is $110,000 ÷ 50 = $2,200, which is 44% of the whole account committed to one trade. – A routine 100-pip move is now worth $1,000 — 20% of the account on that single trade.
Trade C — trying for three standard lots. $330,000 controlled would need $330,000 ÷ 50 = $6,600 of margin — more than the $5,000 in the account. The broker rejects the order. The 50:1 ceiling still binds; it just binds at about 2.27 standard lots ($250,000 notional), which is where the account’s entire equity is committed as margin.
Look at what happened. Same account, same broker, same 50:1 cap — and the effective leverage ranged from 2.2:1 to 22:1 purely because of the position size chosen. The broker’s number never changed. You chose your risk; the “50:1” didn’t choose it for you. That is the left panel of the chart above: a single line from near-zero leverage up to the ceiling, and your position size decides where on it you sit.
The practical takeaway is the opposite of how leverage is usually sold. High available leverage doesn’t force you to take more risk — a small account can run conservative 2:1 or 3:1 effective leverage all day using mini and micro lots. What high available leverage does is let an undisciplined trader put the whole account behind one idea. The number to watch is never the broker’s ceiling. It’s your own notional-to-equity ratio.
Why the Downside Is Worse Than “Cuts Both Ways”
“Leverage cuts both ways” is true for any single trade: a 1% favorable move and a 1% adverse move produce the same-sized gain and loss at the same leverage. But across a string of trades, the two directions are not symmetric, and this is the part the marketing never mentions.
The reason is arithmetic. A loss is taken from your current balance, but the recovery has to be earned on the smaller balance the loss left behind. Lose 20% and you need to make 25% on what’s left just to get back to even. Lose 50% and you need 100%. Lose 80% — entirely possible on a high-effective-leverage account after a bad run — and you need 400% simply to return to where you started. The formula is gain to break even = loss ÷ (1 − loss), and it curves upward viciously, which is the right panel of the chart.
| Drawdown from a leveraged loss | Gain then required to break even |
|---|---|
| −10% | +11% |
| −20% | +25% |
| −33% | +49% |
| −50% | +100% |
| −80% | +400% |
| −90% | +900% |
High effective leverage is dangerous precisely because it makes the deep end of this table easy to reach. Running 22:1 on the standard-lot trade above, a 4.5% move against you erases the whole account; running 2.2:1 on the mini lot, the same 4.5% move costs 10%. The first trader is staring at the “+400% to recover” row after one bad week; the second is looking at “+11%.” Neither is “safe” — forex carries real risk at any size — but only one of them can realistically climb back.
What the Regulators Decided For You (2026)
Regulators cap leverage because the loss data is stark: across EU brokers required to publish it, roughly 74% to 89% of retail CFD accounts lose money, and U.S. retail forex is similar [source: ESMA product-intervention measures on CFDs, 2018 analysis and mandated broker risk-warning disclosures — the exact figure is updated periodically and shown on each broker’s own current risk warning]. The caps are a floor of protection, not a recommendation of how much to use.
| Regulator (jurisdiction) | Max leverage, major FX pairs | Minor / non-major FX | Negative-balance protection for retail? |
|---|---|---|---|
| CFTC / NFA (United States) | 50:1 (2% margin) | 20:1 (5% margin) | Not mandated — you can be liable for a deficit |
| ESMA (European Union) | 30:1 | 20:1 | Mandatory (per account), plus a 50%-of-margin auto close-out rule |
| FCA (United Kingdom) | 30:1 | 20:1 | Mandatory |
| ASIC (Australia) | 30:1 | 20:1 | Mandatory |
Two things are worth noticing. First, the U.S. cap (50:1) is higher than the EU/UK/Australia cap (30:1) — a U.S. beginner is handed more rope, not less risk. Second, the EU, UK, and Australia require negative-balance protection — the guarantee that a gap can’t push you below zero into a debt — while U.S. regulators do not. As the pillar’s account of the January 2015 Swiss-franc shock showed, an unprotected account really can end a bad day owing the broker money. Before you deposit a cent, confirm in writing whether your specific broker offers negative-balance protection; the Margin Calls Explained article in this cluster covers that mechanism, and which brokers offer it, in depth.
The Asymmetry, Actually Measured
This article makes a specific claim above and then does not prove it: that “leverage cuts both ways” holds for a single trade, but that across a string of trades the two directions are not symmetric, and that this is the part the marketing never mentions. The recovery table supports something narrower — it describes one hole and the climb out of it. The string-of-trades asymmetry is a different and stronger statement, and it is measurable, so here it is measured.
The Round Trip That Goes Nowhere
Take the routine 100-pip move this article already uses, and let it happen twice: up 100 pips, then back down 100 pips. The price ends exactly where it began. A trader with no leverage at all is very nearly square. Everyone else is not, and what they lost was not lost to the market, because the market went nowhere. It was lost to the leverage.
| Leverage | Account swing | Per round trip | After 50 |
|---|---|---|---|
| 1:1 | 0.91% | 0.008% | 0.41% |
| 2.2:1 | 2.00% | 0.040% | 1.98% |
| 5:1 | 4.55% | 0.207% | 9.82% |
| 10:1 | 9.09% | 0.826% | 33.96% |
| 22:1 | 20.00% | 4.000% | 87.01% |
| 50:1 | 45.45% | 20.661% | 100.00% |
The second column is this article’s own arithmetic: at 2.2:1 a 100-pip move is 2% of the account and at 22:1 it is 20%, exactly as the two worked trades above report. The third column is what a round trip costs, and the fourth is fifty such round trips — a hundred trades in a market that finishes precisely where it started. The mini-lot trader is down 1.98%. The standard-lot trader is down 87.01%. Same pair, same moves, same broker, same fifty round trips. That is the asymmetry this article names, with a number on it at last.
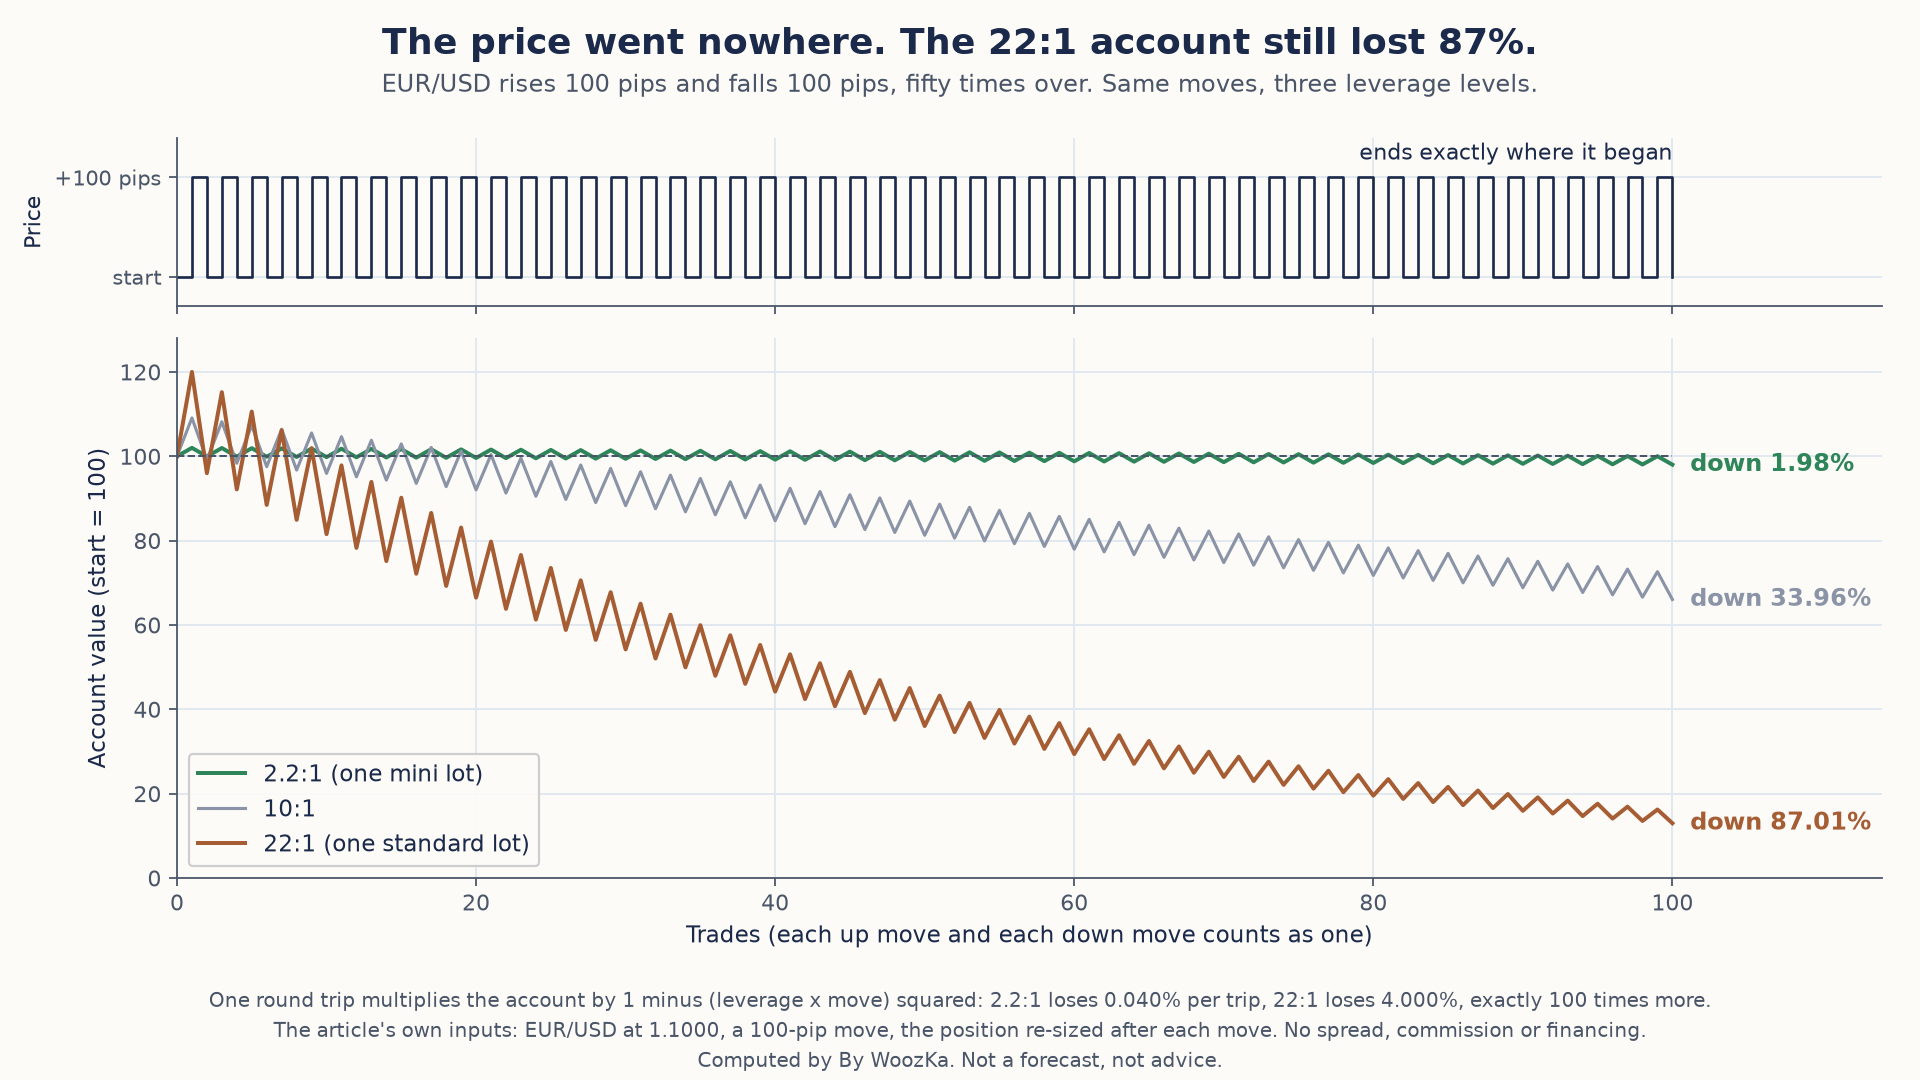 The market finishes exactly where it started, yet the leveraged accounts do not. The loss comes from leverage alone, and ten times the leverage costs one hundred times as much per round trip.
The mechanism is worth stating plainly, because it is the reason the loss side is heavier than “cuts both ways” implies. A gain and a loss of the same size do not cancel: rise 20% and fall 20% and you are left with 96% of what you had, because the fall is taken from the larger number. At leverage L on a move of size m, one round trip multiplies the account by 1 minus (L x m) squared — and that square is the whole story. Going from 2.2:1 to 22:1 is ten times the leverage and exactly one hundred times the bleed, 0.040% against 4.000% per round trip. Leverage does not scale this cost. It squares it.
The Same Square Law in the Size of the Move
The square applies to the move as well as to the leverage, which matters because volatility is not something you choose. Each cell is what one round trip costs at that leverage and that move size.
| Leverage | 50 pips | 100 pips | 200 pips |
|---|---|---|---|
| 2.2:1 | 0.010% | 0.040% | 0.160% |
| 5:1 | 0.052% | 0.207% | 0.826% |
| 10:1 | 0.207% | 0.826% | 3.306% |
| 22:1 | 1.000% | 4.000% | 16.000% |
Read along any row and doubling the move quadruples the cost, exactly, every time. Read down any column and the same square governs the leverage. The two compound: a trader at 22:1 in a 200-pip market pays 1,600 times what a trader at 2.2:1 in a 50-pip market pays for the identical round trip. This is why a quiet strategy can survive high leverage for a long stretch and then come apart when the market gets busy — nothing about the method changed, only the size of the daily move, and the cost of that move is squared.
What Each Cap Permits on a $5,000 Account
The caps above are stated as ratios. Converted into what they actually allow on this article’s own $5,000 account, they read more concretely — the first row being the U.S. major-pair cap, the second the EU, UK and Australian cap, the third the U.S. cap on minors and exotics.
| Cap | Margin | Max notional | Lots | Wipeout |
|---|---|---|---|---|
| 50:1 | 2.00% | $250,000 | 2.27 | 2.00% |
| 30:1 | 3.33% | $150,000 | 1.36 | 3.33% |
| 20:1 | 5.00% | $100,000 | 0.91 | 5.00% |
The first row reproduces the figure already given above — the 50:1 ceiling binds at $250,000 of notional, about 2.27 standard lots — and puts the other two caps on the same footing. Notice that the margin column and the wipeout column are the same number in every row. That is not a coincidence: at maximum leverage your entire equity is the margin, so the adverse move that consumes the margin is the margin percentage. It is the tidiest way to read a leverage cap. A 50:1 ceiling is a license to be two percent wrong.
Set against the EU, UK and Australian ceiling, the U.S. major-pair cap permits 1.67 times the notional and shortens the fatal move from 3.33% to 2.00% — which is the article’s “more rope, not less risk” with the rope measured. Neither number is a recommendation to trade anywhere near it. Run the first table again with 50:1 in view: at that ceiling a single 100-pip round trip costs 20.661% of the account, and fifty of them leave nothing at all. The ceiling is not a setting anyone should sit at, and that is why traders who last size from a risk rule and let the leverage be whatever it turns out to be.
Nothing above needs to be taken on faith; here is the setup. Every input is this article’s own: the $5,000 account, EUR/USD at 1.1000, the mini and standard lots, the routine 100-pip move, the 2.2:1 and 22:1 effective leverages, and the regulator caps as cited above. A round trip is one move up followed by an equal move down, so the price ends exactly where it started — that is what isolates the cost of leverage from the direction of the market, and it is why every figure here is a loss even though nothing was predicted. Effective leverage is held constant across the sequence, meaning the position is re-sized after each move; holding the lot size fixed instead makes the drag worse rather than better, because leverage rises as equity falls, so these figures are the conservative version. Nothing here models spread, commission, swap, slippage or overnight financing, and every one of those makes the real number worse — the drag above is what remains when the market itself is perfectly neutral. No win rate, edge or forecast is assumed anywhere, because none is needed: the result holds for a market that goes nowhere. The calculation behind these tables reports every figure above and confirms that this article’s own published numbers — the 2.2:1 and 22:1, the 2% and 20% account swings, the $2,200 margin and its 44% of equity, the $250,000 ceiling and 2.27 lots, the 4.5% wipeout move, and all six rows of the break-even table — re-derive exactly before it reports anything. They do.
How Disciplined Traders Actually Pick a Leverage Level
Traders who last don’t start from the broker’s ceiling and work down. They start from a risk-per-trade rule — the small slice of the account they’re willing to lose if a single trade hits its stop — and let that, plus the distance to the stop, determine the position size. Effective leverage then falls out as a byproduct of that sizing, and it usually lands in low single digits, far below whatever the broker allows.
That’s why you’ll hear experienced traders say they “never use the maximum.” It’s not superstition; it’s the recovery table above. Keeping effective leverage low keeps any single loss in the shallow, recoverable part of that curve. The full method — turning a risk-per-trade percentage and a stop distance into a lot size — is its own article: Position Sizing in Forex: The Math That Keeps You in the Game. The one idea to carry out of this article is that the sizing decision, not the broker’s headline number, is where your real leverage is set.
If you’ve never placed a leveraged trade, it’s worth pausing on how different the two numbers feel in practice. On paper, “50:1 available” and “running 3:1” sound like the same account. In the moment, opening a position that ties up 44% of your equity as margin — the standard-lot trade above — feels nothing like opening one that ties up 2%. The account statement moves several times faster, and the temptation to react to every swing grows with it. That gap between what the ceiling permits and what a level head would actually run is the whole game.
Common Misconceptions About Forex Leverage
- “Higher leverage means higher returns.” No. Higher available leverage only raises the ceiling. Your returns and your losses are both driven by effective leverage — your position size — which you set yourself, and it moves both directions equally.
- “Trading with low leverage means I need a huge account.” No. Mini lots (10,000 units) and micro lots (1,000 units) let even a small account run low effective leverage. You don’t need a big balance to be conservative; you need small positions.
- “The broker’s 50:1 is how much I’m risking.” No. That’s the ceiling. Your risk on any trade is set by your position size and your stop distance — the broker’s number is just the most it will let you commit.
- “More leverage lets me risk less per trade.” This one is backwards and costs people accounts. Available leverage doesn’t reduce risk; it only permits larger positions. Risk per trade is controlled by sizing and stops, not by how much leverage the broker offers.
- “Negative-balance protection means the worst case is losing my deposit.” Only if your broker actually provides it — mandatory in the EU/UK/Australia, not in the U.S. Confirm it; don’t assume it.
Where to Go Next
Leverage is the one mechanic that makes retail forex behave unlike buying a stock, so it’s worth getting fully straight before anything else:
- How Forex Trading Actually Works: A Beginner’s Guide to Currency Pairs — the pillar: pairs, pips, lots, margin, and the full “cuts both ways” worked example.
- Position Sizing in Forex: The Math That Keeps You in the Game — how to turn a risk-per-trade rule into a lot size, which is where your effective leverage is actually decided.
- Margin Calls Explained: How to Avoid Getting Wiped Out — margin close-out mechanics, negative-balance risk, and which brokers protect against a deficit.
- Best Forex Brokers for Beginners: Fees, Regulation, and Execution Compared — the date-stamped broker breakdown, including which offer negative-balance protection.
If you want currencies and markets explained plainly — risk-first, never hyped — that’s what the newsletter is for. Subscribe below.
Your size is your leverage: on the $5,000 account above, one standard lot of EUR/USD at 1.1000 is $110,000 of notional — 22:1 effective leverage — while one mini lot is 2.2:1. Work it from the stop instead and the number falls out on its own: risking 1% ($50) behind a 25-pip stop is 0.20 lots, or $2 per pip. The Forex Position Size & Pip Calculator sizes from the stop rather than the other way around.
Disclaimer: This article is educational content, not financial advice. I am not a licensed financial advisor, and nothing here is a recommendation to buy or sell any security or asset. Investing and trading involve risk, including the possible loss of the money you invest. Do your own research and consider consulting a licensed financial professional before making investment decisions. Read the full Disclaimer.
Historical and backtested results are hypothetical, carry inherent limitations, and do not guarantee future results. Figures were accurate to the best of my knowledge as of this article’s last-updated date and may have changed.
