Good Debt vs Bad Debt: A Framework for Every Financial Decision
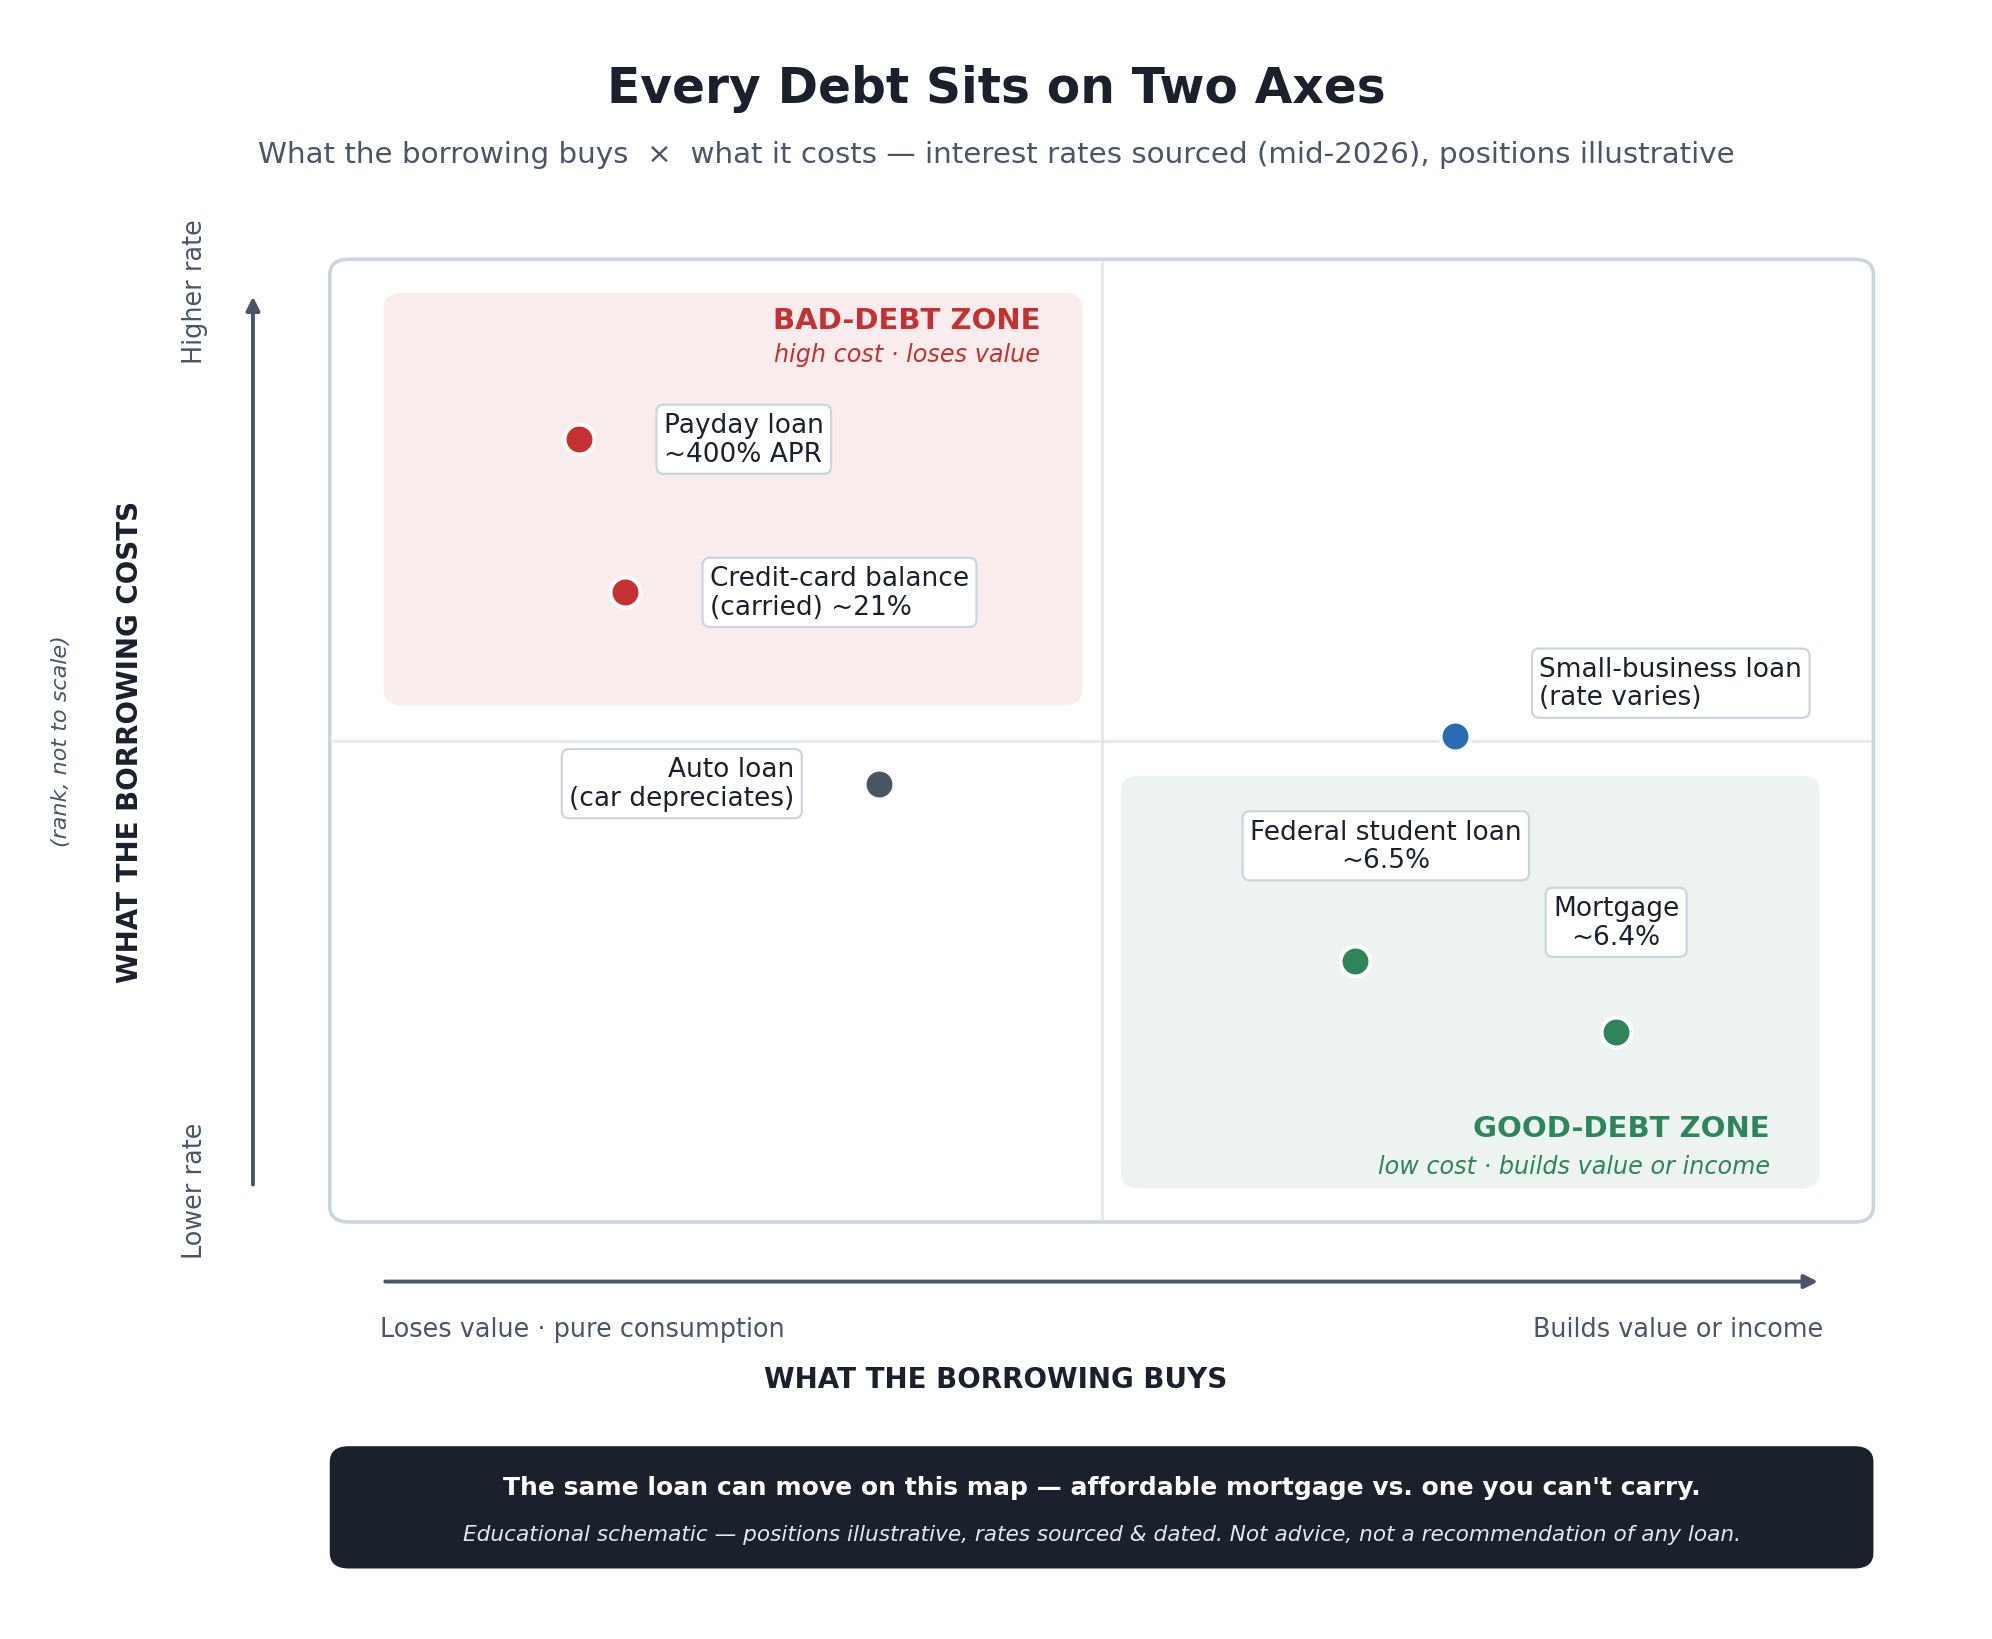
The whole framework in one picture: judge any debt by two things at once — what it buys (does it build value or just disappear?) and what it costs (a modest rate or a punishing one?). The interest rates are real and sourced; where each debt lands is illustrative, because the same loan can move depending on its terms and how you use it.
“All debt is bad” is one of the most expensive half-truths in personal finance. It’s the mirror image of the mistake covered in Assets vs Liabilities — where people assume expensive equals asset — and it’s just as costly, because it treats a mortgage that helps you build equity and a payday loan at nearly 400% the same way. They are not the same. The useful skill isn’t avoiding all borrowing; it’s being able to tell, before you sign, which kind of debt is in front of you.
This article gives you a framework for exactly that. It’s a foundational piece in the Money & Economics section here; if you want the bigger system that credit and debt drive — the expansions and contractions your household sits inside — start with the pillar, The Economic Machine Explained. Here, the job is narrower and more practical: how to look at a single loan and judge it honestly.
First, There’s No Official Definition
It’s worth being clear-eyed about what “good debt” and “bad debt” actually are: a widely-taught financial-literacy heuristic, not a legal or accounting category. Unlike an “asset” or a “liability” — which the Financial Accounting Standards Board defines precisely, as covered in the assets-versus-liabilities piece — no regulator publishes a definition of good versus bad debt. It’s the common framing used by banks, credit unions, and consumer-education sources to teach borrowing, and they broadly agree on the shape of it: good debt tends to fund something that can grow your income or net worth and usually carries a lower rate; bad debt tends to fund things that lose value and often carries a high one [source: Experian, “Good Debt vs. Bad Debt: What’s the Difference?”; Schwab MoneyWise, “Good Debt vs. Bad Debt”].
That distinction matters because it means the labels are a thinking tool, not a verdict stamped on a loan type forever. The same sources that teach the framework are quick to add the caveat that does most of the real work: it’s how a debt is used and managed that determines whether it helps or hurts you — even textbook “good debt” can turn bad, and the entirety of your situation decides the outcome [source: Capital One, “Good Debt vs. Bad Debt: What’s the Difference?”; Experian]. So rather than memorize two lists, it’s far more useful to run any loan through three questions.
Test 1: What Does the Borrowed Money Buy?
This is the heart of the framework. Ask what the borrowing actually acquires, and which direction that thing tends to move over time.
Borrowing that funds something expected to grow in value or raise your income is the classic “good debt” candidate:
- A mortgage funds a home you can live in and that may build equity as you pay down the loan — and historically, though never on a guarantee, may appreciate. It’s the textbook example of borrowing to acquire a durable, potentially appreciating asset.
- Student loans fund education, which can raise your earning power over a career. Education is the standard example of “investing in yourself” through debt — with a large asterisk we’ll get to.
- A small-business loan funds something meant to generate income that exceeds what the loan costs.
Borrowing that funds things which lose value the moment you own them, or that simply disappear into consumption, is the classic “bad debt” candidate:
- A carried credit-card balance on everyday spending — meals, gadgets, clothes — buys things that are consumed or depreciate, financed at a high rate.
- An auto loan funds a car, which starts depreciating immediately; the debt outlives much of the value.
- A payday loan typically funds an emergency gap, and buys nothing durable at all.
Notice the same logic as the assets-versus-liabilities lens: the label follows what the money does, not the object itself. A car financed to run a delivery business that earns more than the car costs behaves like good debt; the identical car financed purely for status behaves like bad debt. Debt to buy inventory that sells at a profit is different from debt to buy a depreciating toy, even at the same interest rate. What the borrowing buys is the first axis — but it’s only half the picture.
Test 2: What Does the Debt Cost?
The second axis is price: the interest rate. A low rate on something that builds value is a fundamentally different animal from a punishing rate on something that’s already losing value — and in mid-2026 the gap between “cheap” and “punishing” borrowing is enormous.
Here is the sourced spread, and it is stark:
- A 30-year fixed mortgage averaged 6.43% as of the Freddie Mac survey for the week of July 2, 2026 [source: Freddie Mac Primary Mortgage Market Survey, week of July 2, 2026].
- A federal undergraduate Direct Loan first disbursed for the 2026–27 school year carries a fixed 6.52%, up from 6.39% the prior year [source: U.S. Department of Education / Federal Student Aid, “Interest Rates for Federal Direct Loans, July 1, 2026–June 30, 2027”].
- The average credit-card interest rate across all accounts was 21.00% in the first quarter of 2026, per the Federal Reserve’s quarterly G.19 data [source: Federal Reserve, G.19 Consumer Credit release, Q1 2026].
- A typical two-week payday loan with a $15-per-$100 fee works out to an APR of almost 400%, because the fee is charged over such a short term [source: Consumer Financial Protection Bureau, “What is a payday loan?” and “What are the costs and fees for a payday loan?”].
Sit with that range for a second. Borrowing for a home or an education costs roughly six-and-a-half cents on the dollar per year; carrying a credit-card balance costs about twenty-one; a payday loan can cost something in the neighborhood of four hundred. The cost of the debt is not a footnote — it can flip a loan from defensible to destructive on its own. That’s exactly why the framework’s schematic uses two axes: a low rate can make otherwise-ordinary borrowing reasonable, and a high enough rate can make almost any borrowing a bad idea. (These figures are dated and will move — always check the current rate on your own loan rather than trusting a number from an article.)
There’s a genuine, if often overstated, wrinkle here worth naming honestly: some “good debt” comes with tax treatment that lowers its effective cost. Borrowers can deduct up to $2,500 of student-loan interest, and unusually, that deduction is available even if you don’t itemize — though it phases out at higher incomes and has its own rules [source: IRS, Topic No. 456, “Student loan interest deduction”]. Mortgage interest may also be deductible, but only if you itemize, which far fewer households do than commonly assumed. Treat tax benefits as a modest thumb on the scale to confirm for your own situation, not a reason to borrow.
Test 3: Can You Actually Carry It?
The third test is the one the “good/bad” labels quietly ignore, and it’s often the decisive one: can you afford the payments? A mortgage is the poster child for good debt — but a mortgage whose payment swallows your budget is a problem no matter how respectable the category sounds.
Lenders formalize this as your debt-to-income ratio (DTI): your total monthly debt payments divided by your gross monthly income. The Consumer Financial Protection Bureau publishes no single ceiling — it says only that “different loan products and lenders will have different DTI limits,” and works one example: $2,000 of monthly debt payments against $6,000 of gross monthly income is a DTI of 33% [source: Consumer Financial Protection Bureau, “What is a debt-to-income ratio?”]. The one official number that ever existed was regulatory rather than advisory, and it has been withdrawn: Regulation Z’s General Qualified Mortgage definition capped DTI at 43% until the CFPB removed that limit and replaced it with price-based thresholds [source: Consumer Financial Protection Bureau, “Qualified Mortgage Definition under the Truth in Lending Act (Regulation Z): General QM Loan Definition”]. Put concretely: on that same $6,000 of gross monthly income, $2,160 of total monthly debt payments across everything — mortgage, car, cards, student loans — works out to 36%. The point isn’t to hit a magic number; it’s that the same loan is good debt at one income and dangerous debt at another.
That affordability test is not hypothetical, and the data shows a “good debt” category under real strain. Student-loan balances stood at $1.66 trillion in the first quarter of 2026, and 10.3% of that balance was 90 or more days delinquent, up from 9.6% the quarter before [source: Federal Reserve Bank of New York, Household Debt and Credit Report, Q1 2026, released May 12, 2026]. Education is the archetypal “good debt,” yet more than one dollar in ten of it is seriously behind — and about 2.6 million borrowers who were more than 120 days past due had their loans transferred to the Department of Education’s Default Resolution Group in that same quarter. That’s the framework’s whole caveat, made numeric: a good category is not the same as a good outcome. (Total U.S. household debt reached about $18.8 trillion that same quarter, for scale — this is not a fringe problem [source: New York Fed, Q1 2026 Household Debt and Credit Report].)
Running the Three Tests Against Each Other
The three questions above are posed one at a time, and the article never crosses them. It is worth doing, because the crossing is where the framework stops being a vocabulary lesson and starts producing numbers. Everything below is arithmetic on figures already printed on this page — the four rates, the CFPB’s 36% guideline, the $6,000 worked example, the $15-per-$100 payday fee and the $2,500 deduction cap. Nothing new is assumed and nothing is forecast.
What the 36% Ceiling Actually Buys, by Rate
Test 3 produces a budget: $2,160 a month, on the article’s own $6,000 of gross monthly income. Test 2 produces four prices. Put the budget on one side and each price on the other, and the question becomes concrete — how much borrowing does that same monthly payment support? The last column is the one that needs no assumption about term at all: it is the balance whose interest alone would consume the whole payment, so no loan at that rate can ever exceed it, at any length.
| Borrowing at | Over 10 years | Over 30 years | Ever, at any term |
|---|---|---|---|
| 6.43% mortgage | $190,826 | $344,239 | $403,110 |
| 6.52% student | $190,058 | $341,025 | $397,546 |
| 21.00% card | $108,037 | $123,189 | $123,429 |
| 391.07% payday | $6,628 | $6,628 | $6,628 |
The same $2,160 supports 28.8 times as much borrowing at the mortgage rate as at the payday rate over an identical ten years. That is the article’s claim that price “is not a footnote” expressed as a multiple, and it holds the term and the payment fixed so that the rate is doing all of the work.
The sharper result is in the two right-hand columns. Extending a loan from ten years to thirty adds $153,413 of capacity at 6.43%, only $15,152 at 21.00%, and less than a cent at the payday rate. The extra twenty years is worth 10.1 times as much at the mortgage rate as at the card rate, and nothing whatsoever at the third. The reason is visible in the last column: the card is already at 99.8% of everything its payment could ever support by year thirty, and the payday loan is at 100.0% almost immediately, while the mortgage has only reached 85.4%. High rates do not merely cost more — they quietly disable the main lever borrowers reach for when a payment is uncomfortable. Stretching the term is a remedy that works precisely where it is least needed.
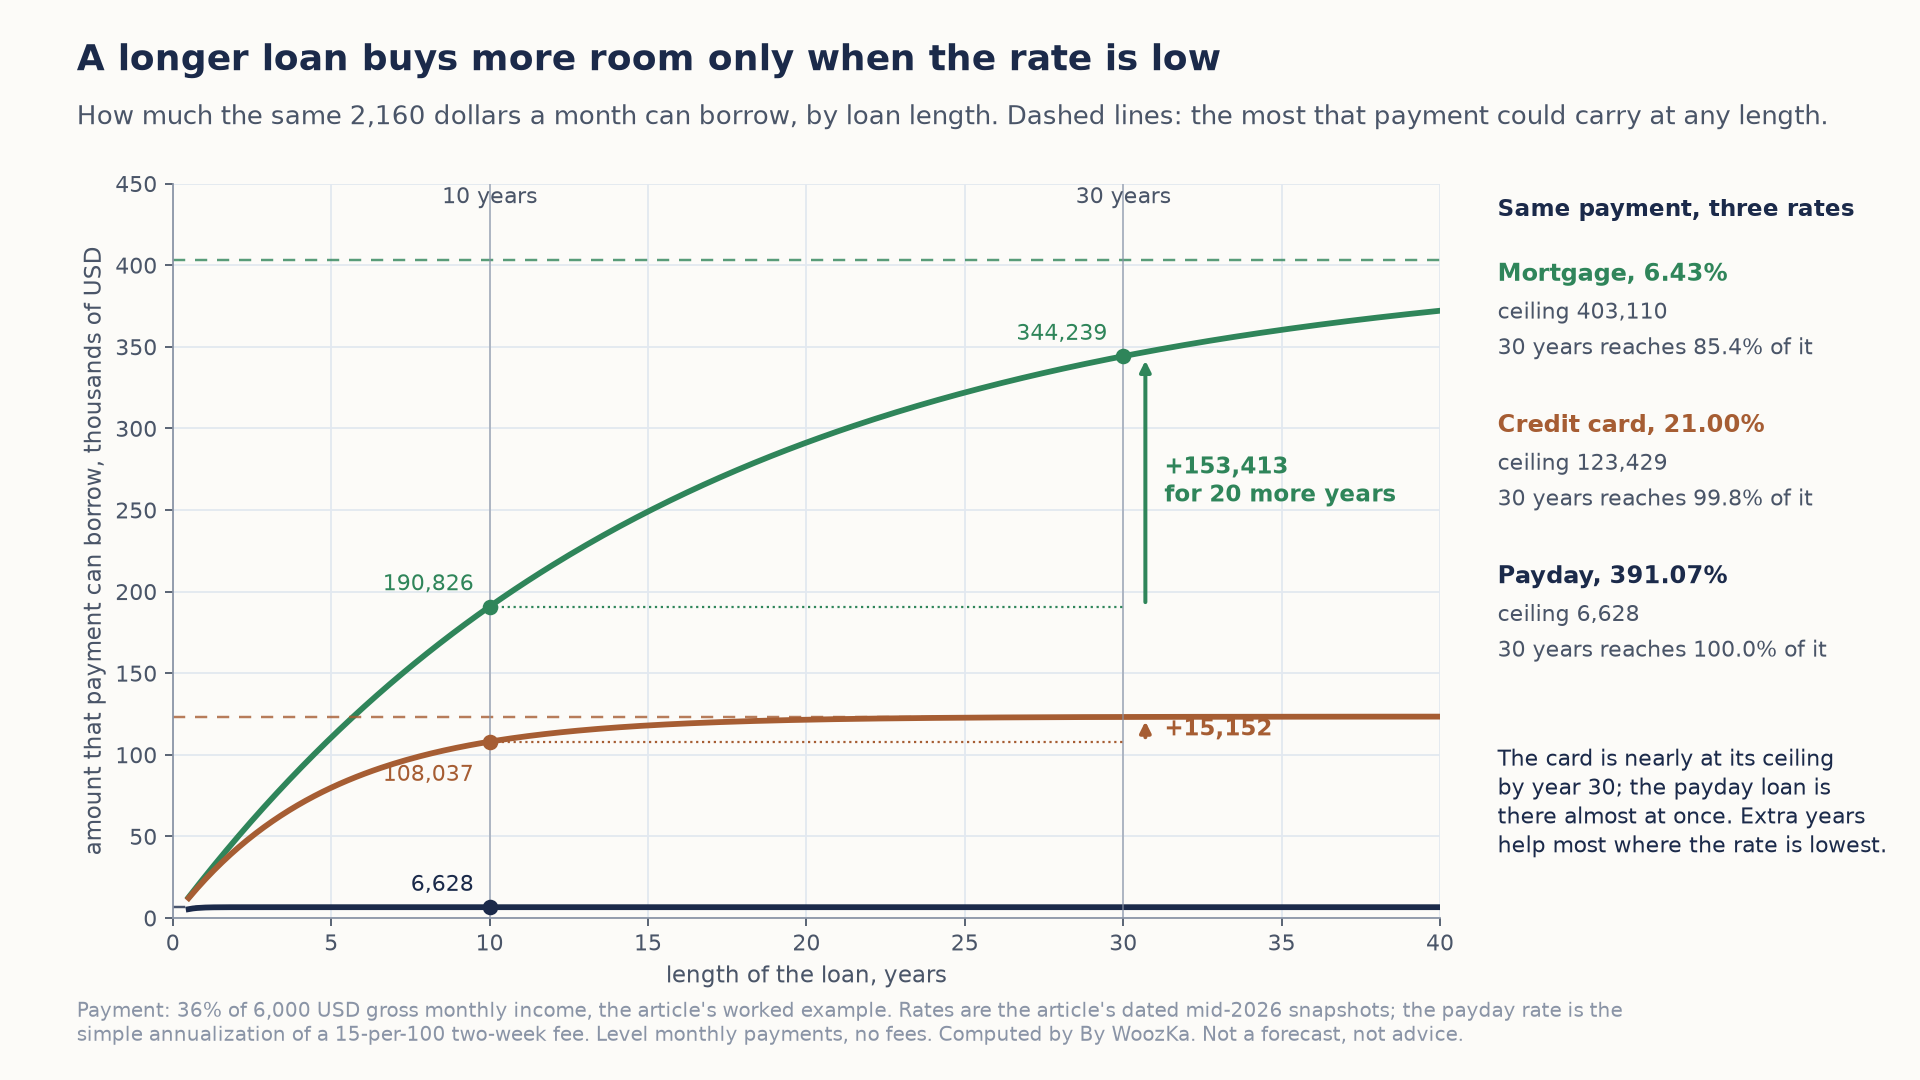
Stretching a loan is the usual fix for a payment that feels too big, but it only works where the rate is low. At the mortgage rate twenty extra years add 153,413 dollars of room; at the card rate they add 15,152; at the payday rate they add nothing.
The Payday APR Is Mostly a Statement About the Calendar
The article gives the reason for the payday number in passing — the fee is charged “over such a short term” — and leaves it there. It is worth seeing, because the fee itself is a fixed $15.00 in every row below. Only the calendar moves.
| Term of the loan | Simple APR | Times the 21.00% card |
|---|---|---|
| 7 days | 782.14% | 37.2× |
| 14 days | 391.07% | 18.6× |
| 21 days | 260.71% | 12.4× |
| 28 days | 195.54% | 9.3× |
| 30 days | 182.50% | 8.7× |
A borrower hands over the same fifteen dollars on every line, and the annualized rate ranges across more than four hundred percentage points. The relationship is exactly inverse: halve the term and the APR doubles, to as many decimals as anyone cares to carry. That is not a criticism of the APR — annualizing is what makes a two-week fee comparable to a mortgage at all — but it does mean the four-hundred-percent headline is measuring the shortness of the loan as much as the size of the fee.
The comparison the article invites but does not make runs the other way. To price like the 21.00% card, a two-week advance could charge $0.81 per $100. The actual fee is 18.62 times that. So the gap between the two “bad debt” examples is not rhetorical: on the same fourteen days, one of them costs roughly nineteen times what the other does.
The Deduction the Article Calls “Often Overstated”
The $2,500 student-loan interest deduction gets a hedge and no number. It can be given one. Below, year-one interest at the 6.52% federal rate, what portion of it the cap allows, and the rate the borrower is effectively paying once the deduction’s value is subtracted — shown at an illustrative 22% marginal rate, since the saving is the deduction multiplied by whatever bracket the borrower is actually in.
| Loan balance | Year-one interest | Deductible | Effective rate |
|---|---|---|---|
| $10,000 | $652.00 | $652.00 | 5.086% |
| $20,000 | $1,304.00 | $1,304.00 | 5.086% |
| $38,344 | $2,500.00 | $2,500.00 | 5.086% |
| $60,000 | $3,912.00 | $2,500.00 | 5.603% |
| $100,000 | $6,520.00 | $2,500.00 | 5.970% |
Two things fall out. Below a balance of $38,343.56 — $2,500 divided by 6.52% — the cap does not bind, and the rate cut is exactly the interest rate multiplied by the marginal rate: 1.4344 points at 22%, identically, at every balance in that range. It does not matter whether the loan is $5,000 or $38,000. Above that balance the deduction’s dollar value is frozen at $550 while the interest keeps growing, so the benefit dilutes: 1.434 points of relief on $10,000 against 0.550 points on $100,000, a factor of 2.61. At a 12% marginal rate the same two figures are 0.782 and 0.300 points.
Which is the article’s hedge, arrived at independently: the relief is largest, per dollar borrowed, on the small loans that were never the problem, and thinnest on the large balances that are. A borrower reasoning that the deduction makes a bigger loan cheaper has it backwards.
Method and limits. The inputs are the numbers already on this page and nothing else: 6.43%, 6.52%, 21.00%, the $15-per-$100 two-week fee, the CFPB’s 36% guideline applied to $6,000 of gross monthly income, and the $2,500 deduction cap. The first table holds the payment and the term identical across all four rates on purpose — that is what isolates price from every other difference between these loans, and it is not a claim that anyone borrows at 391% for a decade; the “ever” column carries the same point without any term assumption at all. The payday APR is the simple annualization the CFPB itself describes, not a compounded figure, and it recomputes from the article’s own fee to 391.07%, which is the “almost 400%” the page already prints. Marginal tax rates of 12%, 22% and 24% are illustrative brackets used to show the shape of the deduction, not a calculation of anyone’s taxes; the income phase-out the article mentions is real and is not modeled here. Every figure was computed and checked in code, which also recomputes the article’s own arithmetic — the $2,160 ceiling and the payday APR both reproduce exactly. None of the twelve calculators this site ships performs loan amortization, so no tool link is offered here rather than a forced one. The rates are the article’s dated snapshots and will move; check the terms on the actual loan.
Why “Good Debt” Still Goes Bad
Once you’re judging debt on all three axes at once, the tidy two-column picture dissolves — and that’s the point. Consider how each “good debt” turns bad:
- A mortgage becomes bad debt if you borrow more house than you can carry, or if prices fall and you end up underwater — owing more than the home is worth. Homes don’t always rise; a great many mortgages went bad in 2008 for exactly this reason.
- Student debt becomes bad debt when the degree doesn’t raise income enough to service it — the reality behind that 10.3% delinquency figure. The loan was “good” in category and bad in outcome.
- A business loan becomes bad debt the moment the business it funded stops covering it.
And the reverse is true, too, which is why the framework should make you humble rather than judgmental. A high-cost “bad debt” can be the least-bad option in a genuine emergency, when the alternative is worse. The framework’s job is to make you reach for the low-cost, value-building end of the map on purpose and treat the high-cost, value-destroying end as a last resort — not to hand you a moral scorecard for other people’s choices.
The Framework You Can Actually Use
Strip it to a checklist you can run at the moment any borrowing is on the table:
- What does it buy? Something that can build value or income (lean toward good), or something that loses value or simply disappears (lean toward bad)?
- What does it cost? A modest rate you can see clearly, or a high one — remembering that a carried card balance near 21% and a payday loan near 400% are in a different universe from a mortgage or student loan near 6.5%?
- Can you carry it? Do the payments fit inside a sane share of your income — the CFPB’s 36%-ish guideline is a reasonable starting reference — even if something goes wrong?
Good debt tends to answer builds value · low cost · comfortably affordable. Bad debt tends to answer loses value · high cost · a strain. Most real borrowing lands somewhere in between, and the framework’s value is that it tells you which direction a given loan leans and why — not that it sorts the world into two bins.
The Limits: What This Framework Doesn’t Decide
Like every clean framework, this one is a lens, not a law, and using it well means knowing its edges.
First, the labels describe tendencies, not destinies. As the whole middle of this article argued, category doesn’t equal outcome. Use the three tests to think, not to pass judgment on a loan — or on yourself — with a single word.
Second, the numbers here are dated and general. Interest rates move, tax rules change, and the “right” DTI depends on your job security, savings, and life. Every figure in this piece is a sourced snapshot with a date attached, not a current quote for your situation — confirm the real terms on the real loan in front of you.
Third — and this is the boundary that matters most on a site about money — none of this is financial advice. Deciding whether you should take a specific mortgage, student loan, or any other debt depends on details this framework can’t see, and it’s a decision for your own research and, where it counts, a licensed professional. What you’ve got here is a way to categorize and question a borrowing decision, not a signal to make one.
Get comfortable with just these three questions and a surprising amount of financial decision-making gets clearer — not because debt becomes simple, but because you stop treating all of it the same. If you haven’t yet, pair this with its sibling piece, Assets vs Liabilities, and then step back to the section pillar, The Economic Machine Explained, to see how all this borrowing drives the wider economy. And for the weekly plain-English take on these ideas, the newsletter is below.
Disclaimer: This article is educational content, not financial advice. I am not a licensed financial advisor, and nothing here is a recommendation to buy or sell any security or asset. Investing and trading involve risk, including the possible loss of the money you invest. Do your own research and consider consulting a licensed financial professional before making investment decisions. Read the full Disclaimer.
Historical and backtested results are hypothetical, carry inherent limitations, and do not guarantee future results. Figures were accurate to the best of my knowledge as of this article’s last-updated date and may have changed.
