Expense Ratios Explained: Why 0.1% vs 1% Matters More Than You Think
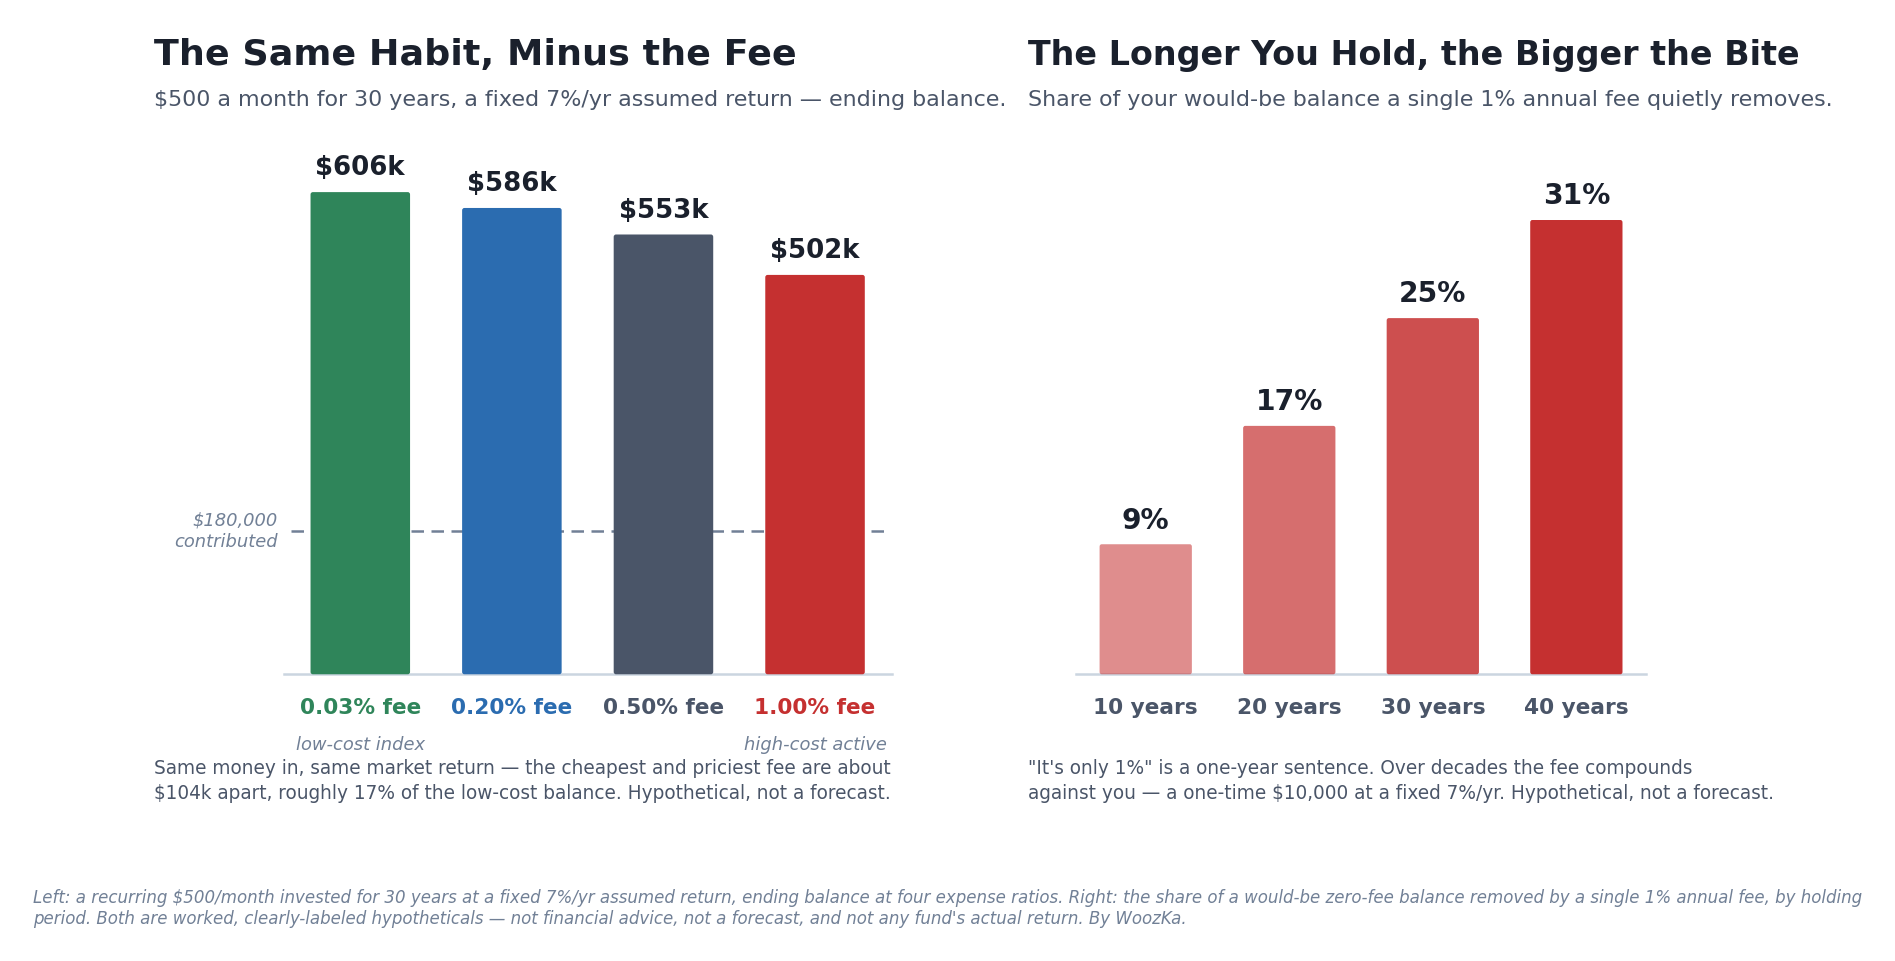
Left: the fee is charged on your whole balance every year, so a small percentage becomes a large number of dollars over decades. Right: the same 1% takes a bigger bite the longer you’re invested. Both are worked, clearly-labeled hypotheticals — fixed 7% assumption, not real fund returns, not a forecast, and not a recommendation of any fund.
If you’ve built something like a three-fund portfolio, or you’re just DCAing into one broad index fund the way The Autopilot Plan describes, sooner or later you hit the question that decides more of your long-run result than almost anything else you’ll pick: what does this fund cost me, and is that number good or bad? The answer lives in one line of the fund’s paperwork — the expense ratio — and it’s the rare investing variable that is both entirely knowable in advance and almost entirely within your control.
The trap is that the number looks tiny. “One percent” sounds like a rounding error next to the swings of the market. This article is about why it isn’t — why the difference between a 0.1% fund and a 1% fund is not ten cents versus a dollar, but, over an investing lifetime, a six-figure gap. We’ll cover what an expense ratio actually is, what counts as cheap in 2026, the compounding math shown honestly, and the one situation where paying more might be defensible.
One framing note up front: this is fund-cost education, not a recommendation. Any funds named below appear only as widely-used examples of a category, never as endorsements, and specific fee figures should always be confirmed on the provider’s own current page — expense ratios do change.
What an Expense Ratio Actually Is
An expense ratio is the percentage of a fund’s assets that the fund charges every year to cover its operating costs — and you never get a bill for it, because it’s taken straight out of the fund before you ever see your return.
More precisely: the expense ratio is the annual percentage of a fund’s average net assets used to pay its operating expenses, which can include the management fee, distribution or service fees (the so-called 12b-1 fees), and other administrative costs [source: U.S. SEC / Investor.gov, “Mutual Fund and ETF Fees and Expenses” and the Expense Ratio glossary entry, 2026]. A 0.20% expense ratio means the fund keeps $2 per year for every $1,000 you have invested in it.
The part that catches people off guard is how it’s collected. You are never invoiced. The expense is deducted from the fund’s assets and embedded in the fund’s daily net asset value (its per-share price) — so although the ratio is quoted as an annual figure, it’s effectively skimmed off a little at a time, every day, before the return reaches you [source: SEC / Investor.gov, mutual fund and ETF fees bulletin, 2026]. Your account statement won’t show a “fee” line. The fund simply grows slightly less than the market it tracks, forever, and the gap is the fee doing its quiet work. That invisibility is exactly why the number is so easy to ignore — and why ignoring it is expensive.
Where do you find it? Every fund is required to disclose its expense ratio in the fee table near the front of its prospectus, and every reputable provider lists it prominently on the fund’s own web page [source: SEC / Investor.gov, “How to Read a Mutual Fund Prospectus — Fee Table,” 2026]. The concept is identical for index mutual funds and ETFs; it’s one line, and it’s the first number worth looking at before you buy anything.
What Counts as a “Good” Expense Ratio in 2026
For a plain, broad-market index fund, “good” today means very low — roughly a tenth of a percent or less — because fund costs have been falling for years and the cheapest options are now extraordinarily cheap.
Here’s the current landscape, in industry averages. In 2024, the average index equity mutual fund charged about 0.05%, while the average actively managed equity mutual fund charged about 0.64% [source: Investment Company Institute, 2025 Investment Company Fact Book / ICI expense-ratio releases, figures for 2024]. Broad-market index ETFs frequently charge even less — on the order of 0.03% to 0.10% [source: fund expense-ratio ranges, provider fund profiles, 2026 — confirm current, as providers revise fees and the ranges shift with them]. And this is a trend, not a snapshot: average equity-fund expense ratios have declined for well over a decade (ICI reported the fourteenth straight annual decline for equity funds through 2023) and fell roughly 60% between 1996 and 2023 [source: Investment Company Institute, “Mutual Fund Expense Ratios Have Declined Substantially over the Past 27 Years,” 2024]. Investors have voted with their money: at year-end 2024, the lowest-cost quartile of funds held about 81% of index equity fund assets [source: ICI, 2025 Fact Book takeaways].
So a rough, practical rule of thumb for a plain vanilla stock or bond index fund: under about 0.10% is cheap, anything approaching 0.50%–1.00% is expensive, and a full 1%+ on a fund that just tracks a mainstream index is very hard to justify when near-identical exposure exists for a fraction of the price. But — and this is the honest caveat — “good” is relative to what the fund actually does. A specialized, actively managed, or hard-to-access strategy legitimately costs more to run than an S&P 500 tracker, so a higher fee there isn’t automatically a rip-off. The real question is never just “is this fee low?” but “am I getting something for this fee that I couldn’t get more cheaply?” We’ll come back to whether the answer is usually yes.
Why 0.1% vs 1% Is Not a Rounding Error
The reason a small annual percentage turns into a large lifetime number is compounding: the fee is charged on your entire balance every single year — including all the growth your money would otherwise have kept earning — so you lose the fee and the future growth on the fee, over and over.
Let’s make it concrete with a worked, deliberately simple hypothetical. These are fixed-assumption illustrations, not forecasts, and not any real fund’s return — the point is the arithmetic, not a prediction.
A one-time investment. Put $10,000 into the market once, assume a 7% gross annual return, and leave it alone. Here’s the ending balance at four expense ratios, across different holding periods:
| Expense ratio | 10 years | 20 years | 30 years | 40 years |
|---|---|---|---|---|
| 0.03% | $19,616 | $38,480 | $75,485 | $148,074 |
| 0.20% | $19,307 | $37,276 | $71,968 | $138,947 |
| 0.50% | $18,771 | $35,236 | $66,144 | $124,161 |
| 1.00% | $17,908 | $32,071 | $57,435 | $102,857 |
At 30 years, the 0.03% fund ends around $75,485 and the 1.00% fund around $57,435 — a gap of roughly $18,050, or about 24% of the low-cost balance, handed to fees for two funds we assumed earned the same return before costs [source: author’s calculation, verified programmatically; fixed 7% gross, compounded net of the stated expense ratio; illustrative, not a forecast]. Notice something in that table: the gap widens the longer you hold. The right panel of the chart above shows it directly — a single 1% fee quietly removes about 9% of your would-be balance over 10 years, but about 31% over 40 years. “It’s only 1%” is a one-year sentence; compounding is a lifetime one.
A realistic saving habit. Most people don’t invest once and stop — they contribute steadily, which is the whole idea behind dollar-cost averaging. So take the more lifelike case: $500 a month for 30 years, same fixed 7% gross assumption. At a 0.03% expense ratio the balance ends around $606,000; at 1.00% it ends around $502,000 — a difference of roughly $104,000 on the same $180,000 of contributions and the same market return [source: author’s calculation, verified programmatically; monthly compounding, net of the stated expense ratio; illustrative, not a forecast]. That six-figure gap isn’t the market being unkind. It’s the fee, compounding against you the exact way returns are supposed to compound for you.
Why does the effect balloon like this? Because a fund that keeps an extra 0.97% of your assets each year isn’t just taking 0.97% once — it’s taking it on a balance that would otherwise have grown, and then taking it again next year on the smaller base, forever. The money skimmed in year one never gets to compound for you across the remaining decades. Cost compounds. That single fact is why the fee line deserves more attention than almost any other decision a beginner makes.
How Much of the Gap Was Ever Billed as a Fee
The gaps above hold two losses this article has so far named only in words: the fee itself, and the growth that money would have gone on to earn. In the article’s model each fund bills its fee every period on its own balance, so the difference between the two funds’ bills is the part of the gap that was ever charged, and the rest is growth on money already taken.
| Holding | Total gap | Extra fees billed | Growth never earned |
|---|---|---|---|
| $10,000, 10 years | $1,708 | $1,277 | $431 (25%) |
| $10,000, 20 years | $6,409 | $3,556 | $2,853 (45%) |
| $10,000, 30 years | $18,050 | $7,624 | $10,426 (58%) |
| $10,000, 40 years | $45,217 | $14,882 | $30,335 (67%) |
| $500 a month, 30 years | $104,129 | $51,874 | $52,255 (50%) |
On $10,000 over 30 years, only $7,624 of the $18,050 gap was ever charged as a fee; the other $10,426 is growth that was never earned. Growth overtakes fees in year 24, and by year 40 it is two dollars of every three. The monthly saver sits almost exactly on the line at 30 years, $381 apart, and growth pulls ahead only in month 359 of 360, because money that arrives month by month, and the fees charged on it, has fewer years left to grow. Adding up the fees alone understates what a 1.00% fund costs, and by more the longer it is held.
Method and limits, so this can be checked rather than taken on trust. Every input is one this article already publishes: the two expense ratios, the fixed 7% gross return, $10,000 compounded yearly, and $500 a month compounded monthly with each deposit at the month’s end. The fee is taken as the article’s table takes it, subtracted from the return, which works out the same as growing at 7% and billing the fee rate on each period’s opening balance. That is the model behind this site’s Compound Growth Calculator, and the article’s own balances were rebuilt from it first, the lump sums to the dollar and the monthly plan to the thousand it prints. Each gap equals its extra fees, every one grown at the full 7% to the end, which was confirmed in code for every row. The 7% is an assumption, not a forecast; taxes, loads and trading costs are left out. Nothing above recommends a fund, a fee level, or an amount to invest.
Is a Higher Fee Ever Worth It?
Sometimes, in principle — but the long-run evidence says that for mainstream exposure, higher fees have usually bought worse outcomes, not better ones, which is why cost is the one lever worth pulling hard.
Start with the uncomfortable data for expensive active management. S&P Dow Jones Indices runs a long-standing scorecard (SPIVA) comparing active fund managers to their benchmark indexes. Over the 20 years through its most recent report, roughly 92% of active U.S. equity funds trailed their benchmark, and the underperformance rate tends to rise the longer the window you measure [source: S&P Dow Jones Indices, SPIVA U.S. Scorecard, year-end 2025 — confirm current; S&P issues a new scorecard each year]. This does not mean an index approach wins every year — in any given year plenty of active funds beat the index — it means that sustaining an edge across decades, net of fees, has been rare. A high fee is a guaranteed, upfront subtraction from your return; the outperformance that’s supposed to justify it is neither guaranteed nor, historically, common.
Now the constructive half, and the reason this whole article exists. A landmark Morningstar study by Russel Kinnel tested a range of fund attributes to see which best predicted future returns, and found the expense ratio was the most reliable predictor of the lot — more useful than past performance or star ratings [source: Morningstar, Russel Kinnel, “Predictive Power of Fees,” 2016]. The magnitude is striking: among U.S. equity funds, the cheapest quintile had roughly a 62% “success” rate (surviving and outperforming) versus about 20% for the priciest quintile — a low-cost fund succeeded around three times as often [source: Morningstar / Russel Kinnel, “Predictive Power of Fees,” 2016; figures reported via Morningstar and ThinkAdvisor coverage]. The same pattern held for international-equity, balanced, and bond funds. Cost is one of the very few things about a fund’s future that you can see clearly in advance, and it points the right way.
So when is a higher fee defensible? When it buys genuine access to something you can’t get cheaply — a legitimately specialized strategy, an asset class with real research and trading costs, a fund whose approach you’ve examined and specifically want. What’s rarely defensible is paying 1% for plain, mainstream stock exposure that’s available for 0.03% down the street. The honest summary is not “the index always wins” — it’s that low cost is the part you control, and the evidence says controlling it reliably helps. Everything else about a fund is a forecast; the fee is a fact.
What a Higher Fee Has to Buy, in Numbers
The section above asks whether a higher fee is ever worth it and answers in words. It has an arithmetic answer, and it is available from figures this article already publishes. Two of them are worth putting side by side, because the article reports the gentler version of each.
The Hurdle Is Bigger Than the Fee Gap
A fee is charged on the balance, not subtracted from the return, so a fund charging 1.00% must out-earn a fund charging 0.03% by more than the 0.97-point gap between them just to finish level. The exact requirement is (1 + return) × fee gap ÷ (1 − the higher fee).
| Fee charged | Gap vs 0.03% | Must out-earn it by | More than the gap |
|---|---|---|---|
| 0.20% | 0.17 pts | 0.1823 pts | +7.21% |
| 0.50% | 0.47 pts | 0.5054 pts | +7.54% |
| 1.00% | 0.97 pts | 1.0484 pts | +8.08% |
So the honest form of the question is not “can this manager beat the index?” but “can this manager beat it by 1.0484 points a year, gross, every year, for as long as I hold it?” Set beside the article’s own SPIVA figure — roughly 92% of active US equity funds trailing their benchmark over twenty years — that is the number the fee is asking you to bet on.
One property is worth noticing because it runs opposite to the way fee comparisons usually behave. A comparison of two funds’ ending wealth is a ratio in which the market’s return cancels out. This break-even does not: it rises with the market, because the fee is levied on a bigger balance. At 2% gross the hurdle is 0.9994 points; at 7% it is 1.0484; at 12% it is 1.0974. A strong market makes an expensive fund harder to justify, not easier.
The Same Two Numbers, Read Three Ways
The article reports the Morningstar success rates as “a low-cost fund succeeded around three times as often.” That is correct — 62 ÷ 20 is 3.10 — and it is the mildest of three true readings of the identical pair.
| How it is stated | Cheapest quintile | Priciest quintile | Cheap vs pricey |
|---|---|---|---|
| Success rate, as reported | 62% | 20% | 3.10× |
| Failure rate | 38% | 80% | 0.475× |
| Odds of success | 1.632 | 0.250 | 6.53× |
Stated as failure, the cheap quintile went wrong less than half as often. Stated as odds — the form a statistician would reach for — the advantage is 6.53×, more than double the headline. Nothing in the data changed; only the denominator did. It is worth knowing that a single pair of percentages can support a three-fold or a six-fold claim honestly, because the same latitude is available to anyone quoting figures at you.
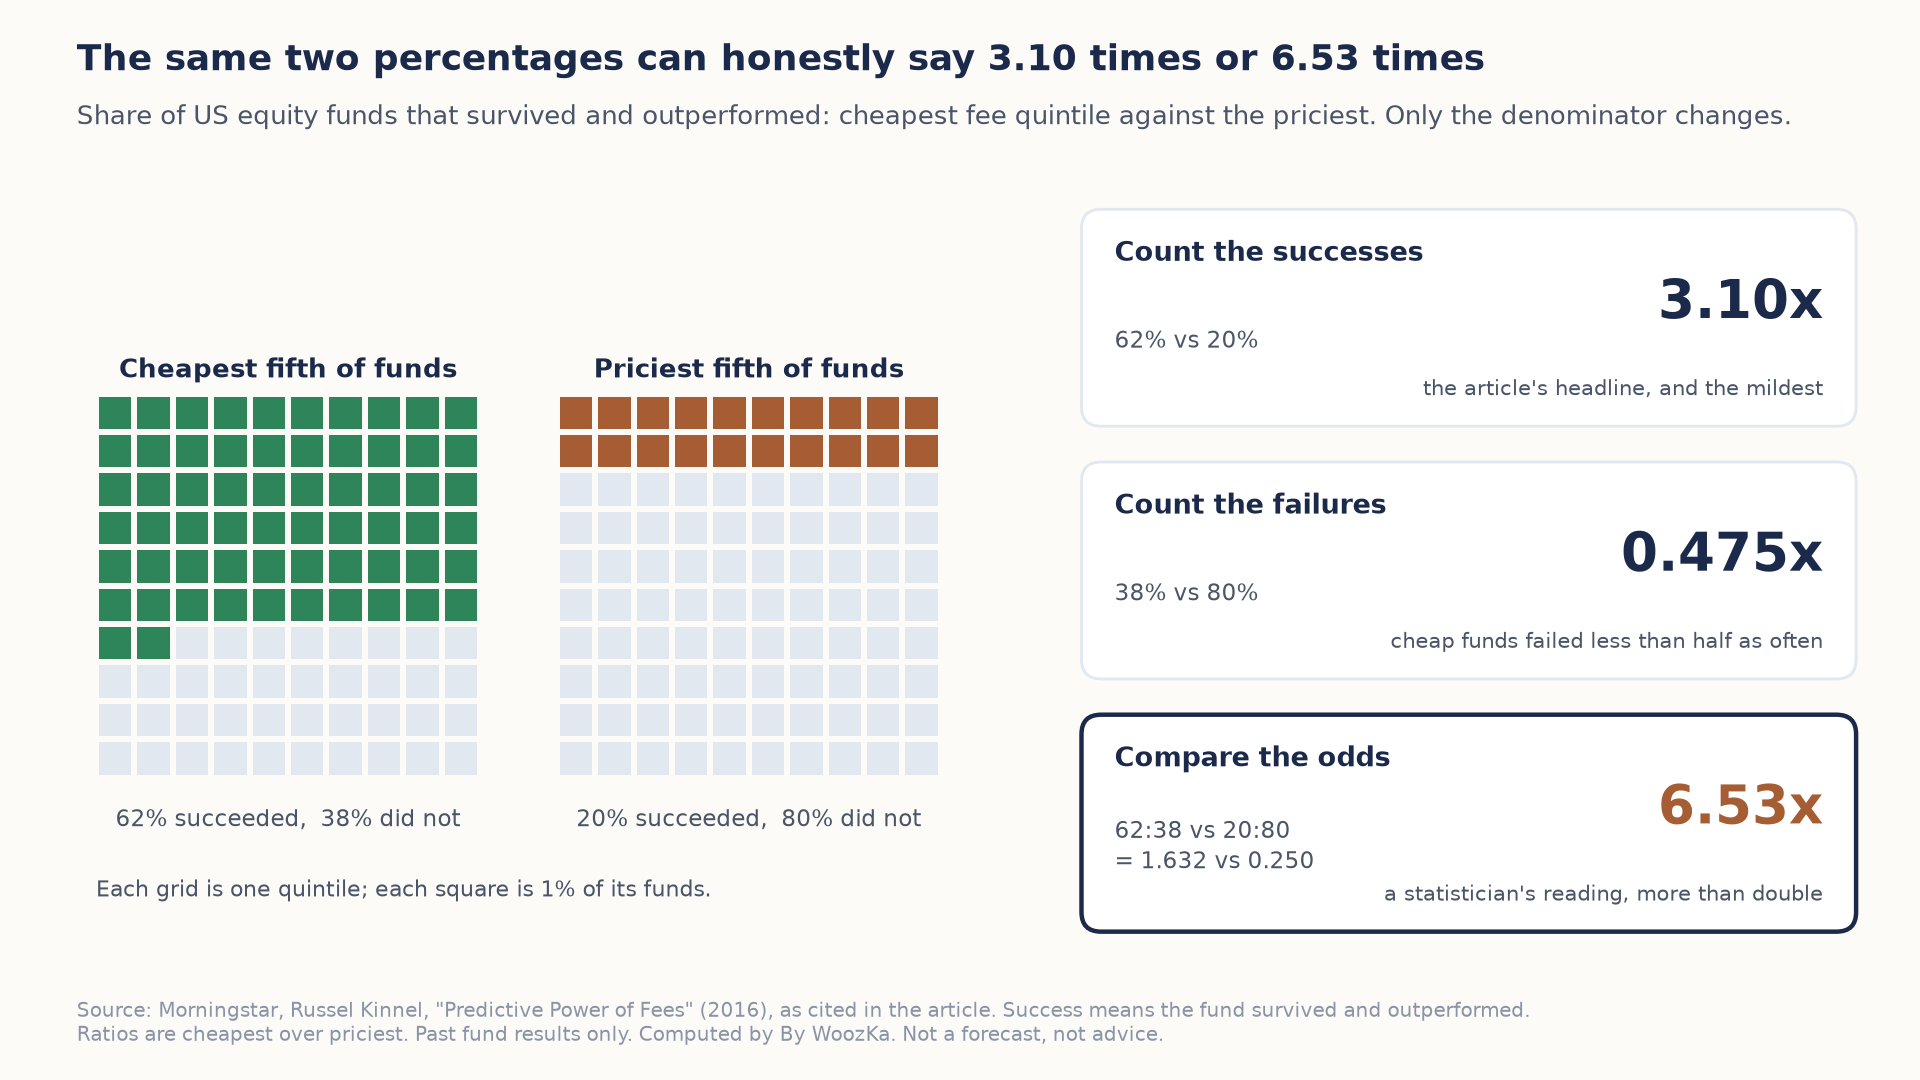
Nothing in the data changes between these three cards, only the denominator. The same 62% and 20% can support a three-fold or a six-fold claim honestly, which is worth remembering whenever someone quotes a ratio at you.
A Note on the Table Above, and the Convention It Uses
The compounding table earlier in this article treats a fee as a subtraction from the return: 7% gross at a 1.00% fee compounds at 6.00%. All sixteen of its cells reproduce exactly that way, to the dollar. The alternative convention charges the fee on the balance each year, compounding at (1 + 7%) × (1 − 1.00%). Both are in common use and the article labels its figures a hypothetical, but the two do not diverge evenly.
| Fee charged | As published, 40 years | Fee charged on balance | Shortcut is worth |
|---|---|---|---|
| 0.03% | $148,074 | $147,958 | $116 |
| 0.20% | $138,947 | $138,221 | $727 |
| 0.50% | $124,161 | $122,539 | $1,622 |
| 1.00% | $102,857 | $100,175 | $2,682 |
The shortcut is worth $116 on the cheapest fund and $2,682 on the priciest — a factor of 23.1. It flatters the expensive fund most, which means the article’s central claim is if anything understated by its own illustration rather than overstated.
Check the break-even arithmetic rather than trusting it; here is what it rests on. Every input above is a figure this article already publishes — the four expense ratios, the $10,000 stake, the fixed 7% assumption, the sixteen tabulated ending values, the Morningstar 62% and 20%, and the SPIVA 92%. Each figure was confirmed in code before publication; the article’s own sixteen cells were reproduced to the dollar through the code behind this site’s compound growth calculator before anything was added to them. Three limits are real. The 7% is the article’s assumption and not a forecast. The break-even is a gross figure and deliberately ignores taxes, loads and trading costs, which the next section lists separately — including them raises the hurdle further. And the Morningstar and SPIVA figures measure different populations over different windows, so they are set beside each other as context, never multiplied together. No forecast, no fund recommendation and no allocation appears anywhere above.
The Costs the Expense Ratio Doesn’t Show
The expense ratio is the biggest and most visible cost, but it isn’t the only one — and knowing the others keeps you from thinking a 0.00% headline means “free.”
A few to keep on your radar, briefly. Trading costs: when you buy or sell an ETF you also pay the bid-ask spread (the small gap between the buy and sell price), which is usually tiny for large, popular funds and wider for thin, niche ones. Sales loads and 12b-1 fees: some funds tack on a front-end or back-end sales charge, or an ongoing marketing fee — these are separate from (and on top of) the plain operating expense ratio, and they’re worth avoiding when a no-load equivalent exists [source: SEC / Investor.gov, mutual fund fees bulletin, 2026]. Tax drag: in a taxable account, a fund that trades a lot can pass through taxable capital-gains distributions, quietly reducing your after-tax return in a way the expense ratio never captures — one reason broad, low-turnover index funds tend to be tax-efficient as well as cheap. None of these should send you down a rabbit hole; the expense ratio still deserves most of your attention. But “check the fee” really means “check all the costs,” and the fund’s own fee table lists the loads and 12b-1 charges right alongside the expense ratio.
How to Check and Compare a Fund’s Cost
Checking a fund’s real cost takes about two minutes, and doing it before you buy is one of the highest-value habits in all of investing.
Go to the fund’s own page (or its prospectus fee table) and read the expense ratio directly from the source, not from a third-party summary that may be out of date — then confirm it’s current, because these numbers change [source: SEC / Investor.gov, prospectus fee-table guidance, 2026]. Compare within the same category: a total-bond-market fund and a total-stock-market fund do different jobs, so comparing their fees head-to-head is meaningless; compare a stock index fund to another stock index fund. Watch for the extras from the previous section — a low expense ratio sitting next to a 5% front-end load is not actually cheap. And weigh the fee against what the fund does: paying 0.04% instead of 0.03% to get exactly the exposure you want is not worth losing sleep over, but paying 1% instead of 0.05% for effectively the same index is the difference the whole chart above is about. If you’re weighing two nearly-identical broad funds — the classic case is VTI vs VOO — cost is often the sensible tiebreaker precisely because so little else separates them.
Consider what “checking the fee” looks like in practice: the person who spends two minutes confirming a broad index fund charges 0.05% instead of blindly rolling money into a default option charging 1% hasn’t done anything clever — they’ve just refused to pay a toll that compounds for the rest of their investing life. Over thirty years, that unglamorous two-minute habit is worth more than most of the stock-picking anyone will ever do.
The Bottom Line
An expense ratio is the small, silent, annual percentage a fund skims from your money — invisible on your statement, unavoidable while you hold the fund, and, because it’s charged on your whole balance every year, far more consequential over a lifetime than its tiny-looking number suggests. For a plain broad-market index fund, cheap today means roughly a tenth of a percent or less, and the gap between that and a 1% fund is not loose change: on the same money and the same market return, it compounds into a difference measured in the tens or hundreds of thousands of dollars over a career. Higher fees can occasionally be worth it, but the long-run evidence is blunt — most expensive funds have trailed their cheap benchmarks, and cost is the single most reliable thing you can see in advance. You can’t control what the market returns. You can control what you pay to participate. Check the fee, keep it low, and let compounding work for you instead of the fund.
Disclaimer: This article is educational content, not financial advice. I am not a licensed financial advisor, and nothing here is a recommendation to buy or sell any security or asset. Investing and trading involve risk, including the possible loss of the money you invest. Do your own research and consider consulting a licensed financial professional before making investment decisions. Read the full Disclaimer. Historical and backtested results are hypothetical, carry inherent limitations, and do not guarantee future results. Figures were accurate to the best of my knowledge as of this article’s last-updated date and may have changed.
Once you’re comfortable reading a fund’s cost, the natural next questions in this cluster are what to actually build with those low-cost funds — covered in How to Build a 3-Fund Portfolio — and how income fits in, in Dividend Investing 101. For the weekly market read this blog uses and a free low-cost-fund checklist, subscribe to the newsletter below.
