Drawdown Explained: The Metric That Matters More Than Win Rate
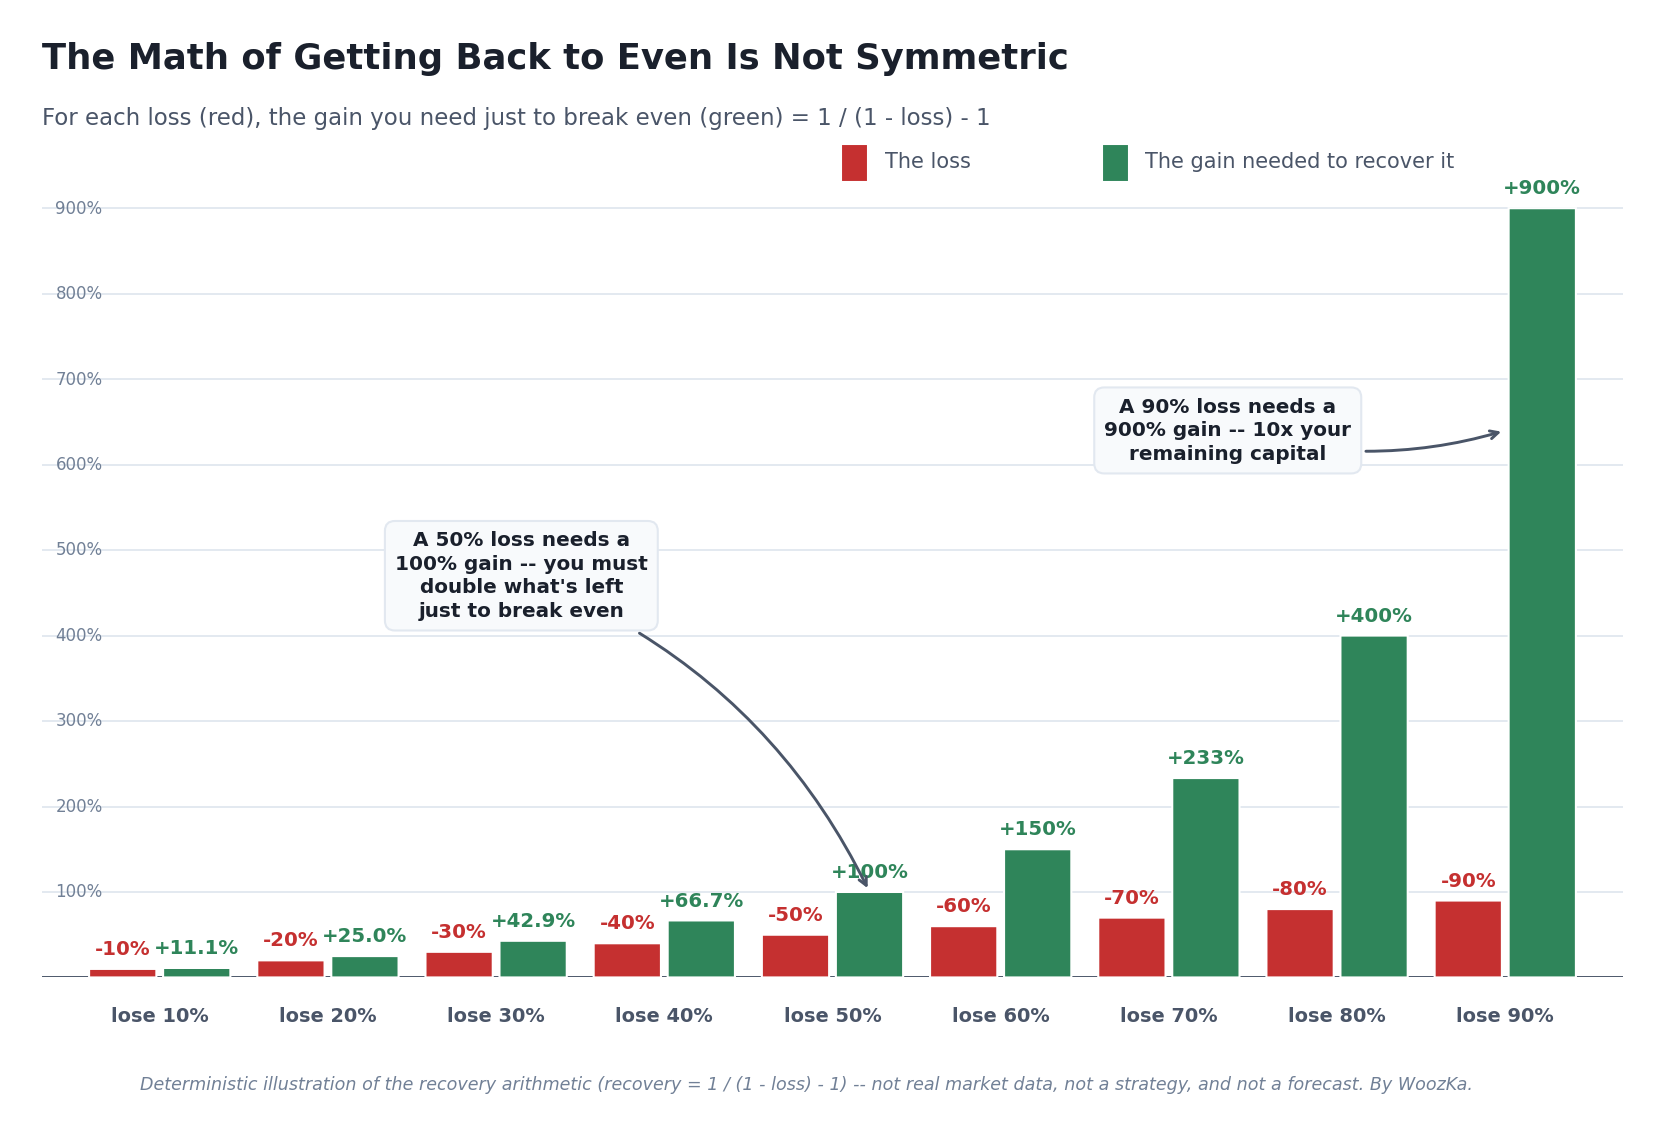 The single most important picture in risk management. A loss and its recovery are not mirror images. Lose 10% and a +11.1% gain restores you; lose 50% and you now need to double your money just to get back to where you started; lose 90% and you need a tenfold return. The deeper the hole, the more brutally the arithmetic works against you — which is why professionals obsess over the depth of the hole, not the count of good days.
Most trading content leads with the win rate — “this strategy wins 85% of its trades” — because it is the number that sells. It is also close to useless on its own. A strategy can win the vast majority of its trades and still ruin you, and a strategy can be wrong most of the time and be one of the most durable ever studied. The number that actually tells you whether you can survive a strategy long enough to collect its edge is drawdown: how far it takes your account down from its high-water mark, how long it keeps you there, and — the part almost everyone underestimates — how violently the math of climbing back out works against you.
This is a trading-systems article, so the silo’s non-negotiable rule governs every line: past backtest performance does not predict future results. A drawdown figure is a historical description of the worst decline a strategy already put through — never a promise about the worst it will put you through next. If you take one idea from this piece, take this: the drawdown in a backtest is the floor of your imagination, not the ceiling. The real worst case is almost always worse than anything the past has shown you.
Drawdown, Measured From the High-Water Mark
A drawdown is the decline in an account (or a strategy’s equity curve) from a peak to a subsequent trough, measured as a percentage of that peak. The moment your account makes a new high, that becomes the “high-water mark.” Every dollar of decline from there puts you “underwater,” and you stay underwater until the account climbs back above the old high-water mark. A drawdown has two dimensions that matter independently: its depth (how far down) and its duration (how long until you recover). Beginners fixate on depth and ignore duration, which is exactly backwards for most people’s psychology — more on that below.
The reason drawdown deserves more attention than almost any other single number is that it is the metric that decides whether you are still in the game to collect your edge at all. Expectancy tells you whether a strategy makes money on average over many trades; drawdown tells you whether you will be around, funded and emotionally intact, to reach that average. A positive-expectancy system that hands you a 70% decline along the way is a system almost no real human keeps trading — they capitulate at the bottom, which converts a temporary drawdown into a permanent loss. The edge was real. The trader just didn’t survive it.
The Recovery Asymmetry: Why Deep Losses Are Not Just “Bigger” Losses
Here is the piece of arithmetic that should be tattooed on every trader’s monitor, and it is the whole reason the chart above looks the way it does. Losses and the gains needed to recover them are not symmetric. When you lose money, you are left with a smaller base — and every future percentage gain is calculated on that smaller base. So the gain you need just to get back to even is always larger than the loss that put you there, and the gap explodes as the loss deepens.
The formula is deterministic. If a drawdown takes away a fraction d of your capital, the return you need to recover is:
Recovery required = 1 / (1 − d) − 1
Work it out and the numbers are sobering (this table is exact arithmetic, an illustration of the math itself — not any strategy’s returns):
| Drawdown (peak-to-trough loss) | Gain needed just to break even |
|---|---|
| −10% | +11.1% |
| −20% | +25.0% |
| −30% | +42.9% |
| −40% | +66.7% |
| −50% | +100% |
| −60% | +150% |
| −70% | +233% |
| −80% | +400% |
| −90% | +900% |
Trace the shape of it. A shallow 10% drawdown is a nuisance — an +11.1% gain erases it. A 20% drawdown already asks for +25%. But somewhere past the middle of the table the curve turns vicious: a 50% loss requires a 100% gain — you must double the money you have left just to return to where you started. A 90% loss requires a 900% gain; you have to make ten times your remaining capital to undo it. This is why halving is not “twice as bad” as a 25% loss — it is far worse, because the recovery math compounds against you the deeper you go.
The practical lesson is the one professional risk managers repeat endlessly: avoiding the deep drawdown is worth more than chasing the extra return, because the arithmetic of recovery is so lopsided. A strategy that never lets you fall more than 20% has a fundamentally easier job staying alive than one that occasionally drops 60%, even if the second one shows a higher headline return in a backtest. The first strategy needs a +25% bounce to heal; the second needs +150%, in a market that may not offer it for years. Depth is not a linear cost. It is a trap that gets exponentially harder to climb out of.
Three Ways to Measure It: Depth, Average, and Time Underwater
“Drawdown” is usually thrown around as a single number, but a system produces at least three distinct drawdown facts, and they answer different questions.
Maximum drawdown is the single largest peak-to-trough decline in the whole record — the worst it ever got. It is the headline figure, the one most systems are judged on, and it answers “how bad was the worst moment?” It is essential, but it is also just one realization of the worst case (see the next section on why that matters enormously).
Average drawdown is the typical decline the strategy puts you through, averaging across all its underwater episodes. It answers “what does a bad-but-normal stretch feel like?” A system with a scary max drawdown but a small average drawdown spends most of its life in mild dips and had one exceptional bad run; a system with a high average drawdown is grinding you down constantly. Two strategies can share the same max drawdown and feel completely different to live with because their averages differ.
Drawdown duration — the time underwater — is how long the account stays below its previous high-water mark before it recovers, and it is the dimension that quietly breaks most traders. A 25% drawdown that recovers in two months is annoying; a 25% drawdown that grinds on for three years is a test of faith that very few people pass without abandoning the strategy somewhere in the middle. Being underwater for years — watching an account that made a high in, say, early one year not reclaim it until years later — is psychologically corrosive in a way a sharp, fast dip is not. This is the reason duration deserves equal billing with depth: the drawdown that makes you quit is often not the deepest one, but the longest one. You can white-knuckle through a violent 30% drop that snaps back in weeks; it is the slow, endless, sideways bleed that erodes the conviction you need to stay in your seat.
Your Backtest’s “Max Drawdown” Is a Best Case, Not a Worst Case
This is the most important caveat in the whole article, and it is the one the brief for this cluster insists on: the maximum drawdown in any backtest is a single historical realization, and the true future worst case is almost certainly worse. A backtest reports the deepest hole the strategy fell into over the specific history you tested — a sample of one path through one set of market conditions that happened to occur. The market has many more configurations available to it than the slice you measured, and it is under no obligation to keep its future declines inside the envelope of its past ones. New regimes, higher volatility, correlations that break at the worst moment, a shock with no precedent in your sample — any of these can produce a drawdown deeper than anything in the record.
So the honest way to read a backtest’s max drawdown is as a floor on your expectations, not a ceiling. If a strategy’s worst historical drawdown was 30%, the correct planning assumption is not “my worst case is 30%” — it is “my worst case is at least 30%, and I should be sized and mentally prepared for meaningfully more.” Practitioners often plan around some multiple of the backtested max drawdown for exactly this reason. Treating the backtest number as the guaranteed limit of your pain is one of the most common — and most expensive — mistakes in systematic trading, and it is a direct cousin of the overfitting trap: a max drawdown, like a Sharpe ratio or an equity curve, is a statistic estimated on the past, and the past is a small, lucky sample of everything the future can do.
Turning Drawdown Into a Quality Score: Calmar, MAR, and the Ulcer Index
Raw return is a vanity metric because it says nothing about the pain endured to get it. A strategy that returned 20% a year with a 15% max drawdown is a very different animal from one that returned 20% a year with a 60% max drawdown — the second one asked you to survive a near-halving for the same reward. The family of risk-adjusted metrics built on drawdown exists to make that difference visible by putting return over drawdown, so that pain is charged against reward.
The best known is the Calmar ratio: annualized return divided by maximum drawdown. It was created by Terry W. Young and published in 1991 in the trade journal Futures; the name is an acronym of his firm and newsletter, CALifornia Managed Accounts Reports, and it was originally built to evaluate managed-futures (CTA) programs over a trailing 36-month window [source: Terry W. Young, “Calmar Ratio: A Smoother Tool,” Futures, October 1991; definition per Wikipedia, “Calmar ratio”]. A Calmar of 1.0 means the strategy earned, per year, about as much as its worst drawdown; higher is better, because it means more return per unit of worst-case pain. Its close relative, the MAR ratio (from the Managed Accounts Reports newsletter), is the same idea — compound annual return since inception divided by the maximum drawdown over the full record — and is used to compare long-horizon track records on the same return-per-drawdown basis.
For traders who care as much about the shape of the drawdown as its single worst point, the Ulcer Index captures both depth and duration in one figure. Devised by Peter Martin in 1987 (and published with Byron McCann in their 1989 book The Investor’s Guide to Fidelity Funds), it is the square root of the mean of the squared percentage drawdowns over the period — which means deeper and longer drawdowns are penalized progressively more, and it ignores upside volatility entirely [source: Peter Martin & Byron McCann, The Investor’s Guide to Fidelity Funds, 1989; definition per Wikipedia, “Ulcer index”]. Its name is deliberate: it is meant to measure how much of an ulcer a strategy would give you to hold. The Ulcer Performance Index (or Martin ratio) then divides excess return by the Ulcer Index, the way the Sharpe ratio divides by standard deviation.
None of these is a magic single number — each is a historical, backtested statistic with the same caveats as the max drawdown it is built on, and a high Calmar over a lucky sample is exactly as misleading as a high return over a lucky sample. But as a family they enforce the right instinct: judge a strategy on what it returned relative to the drawdown it put you through, not on return alone. A slightly lower-returning strategy with a far shallower drawdown is often the better one to actually trade, because it is the one you can hold through its bad years — and holding through the bad years is the entire job. (The other headline risk-adjusted number, the Sharpe ratio, divides return by total volatility instead of drawdown; it is worth understanding alongside these, along with its own well-documented blind spots.)
The Two Strategies Above, Priced
The section opening this one contrasts a strategy returning 20% a year with a 15% maximum drawdown against one returning 20% a year with a 60% one, and calls them “a very different animal.” That difference has a size, and the article already publishes everything needed to find it — the two strategies in one section, the recovery table in another. Joining them is where the number is.
| The article’s two strategies | Calmar | Gain to get back | Years spent climbing out |
|---|---|---|---|
| 20% a year, 15% max drawdown | 1.333 | +17.6% | 0.891 |
| 20% a year, 60% max drawdown | 0.333 | +150.0% | 5.026 |
On Calmar the two are exactly 4.00× apart, which is arithmetically unavoidable: the return is identical, so the ratio is doing nothing but dividing by the drawdown, and 60 ÷ 15 is 4. But converted into time at the article’s own 20% a year, the deep-drawdown strategy spends 5.026 years getting back to its high-water mark against 0.891 — 5.64× as long. The lived gap is wider than the ratio reports, because recovery compounds while the ratio is linear. A reader comparing two funds on Calmar alone is reading an understatement of the difference in how long the bad stretch actually lasts.
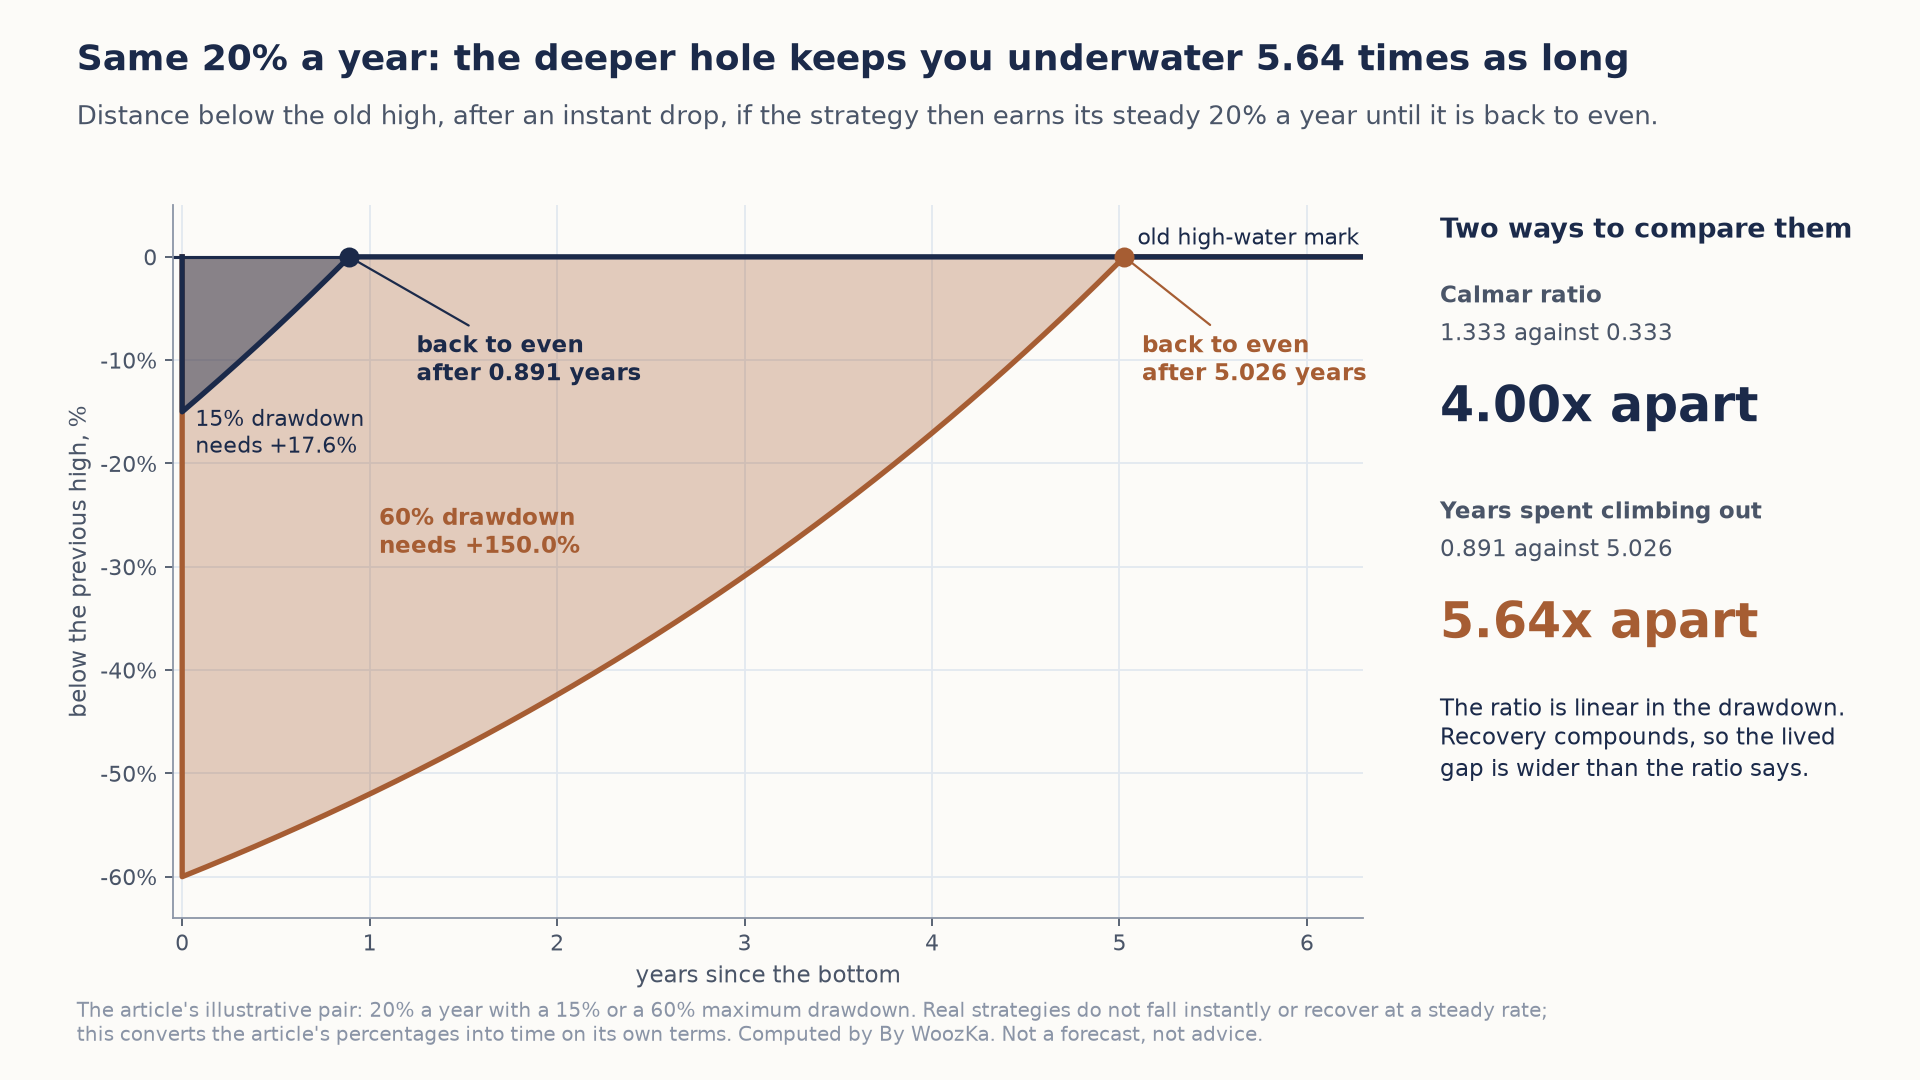 Both strategies earn the same 20% a year. The one with the 60% drawdown spends about five years below its old high against less than one, a 5.64-times gap, which is wider than the 4-times difference its Calmar ratio reports.
The Same Record Can Score Twice
The article defines Calmar on a trailing 36-month window and MAR on the full record since inception. It does not draw the consequence, and the consequence is sharp: a track record with a 60% drawdown four years ago and nothing worse than 15% since scores differently under the two definitions, at the same moment, on the same data.
| Definition, as the article states it | Worst drawdown inside its window | Resulting score |
|---|---|---|
| Calmar, trailing 36 months | 15% | 1.333 |
| MAR, full record since inception | 60% | 0.333 |
One strategy, two published definitions, 4.00× apart. Nothing about the trading changed — the worst period simply aged out of the shorter window. That has a practical edge worth carrying: a Calmar ratio that improves over time may mean the strategy got better, or only that its worst drawdown got old enough to fall outside the measurement window. The two are indistinguishable from the ratio alone, and telling them apart requires looking at when the worst drawdown happened, not just how deep it was.
What “Sized for Meaningfully More” Costs
The earlier section on backtested drawdowns argues that a backtested maximum is a floor rather than a ceiling, and that the planning assumption should be some multiple of it. That advice can be priced on the article’s own recovery rows, taking its 30% example as the backtested figure.
| Planning assumption | Drawdown planned for | Gain required to recover | Against planning for the backtest |
|---|---|---|---|
| Take the backtest at face value | 30% | +42.9% | 1.00× |
| Plan for 1.5× | 45% | +81.8% | 1.91× |
| Plan for 2× | 60% | +150.0% | 3.50× |
Doubling the assumed drawdown does not double the hole. Going from 30% to 60% moves the recovery requirement from +42.9% to +150.0% — a factor of 3.50 — and even the modest 1.5× assumption costs 1.91× the recovery rather than 1.5×. The penalty for under-planning grows faster than the drawdown itself does, which is the arithmetic reason the article’s caution is worth taking literally rather than as a general warning to be careful.
Reading these recovery figures: what they use, and where they stop. Every input above is a figure this article already publishes — the 20%-a-year pair with its 15% and 60% drawdowns, the nine rows of the recovery table, the 30% backtest example, and the Calmar and MAR definitions with their differing windows. Every figure here passed a check in code before publication; all nine of the article’s own recovery rows were reproduced exactly from drawdown ÷ (1 − drawdown) before anything was built on them. Three limits are real. The 20% return and the two drawdowns are the article’s illustrative pair, not any real strategy. Years-to-recover assumes that stated return compounds steadily, which no strategy does — it converts a percentage into a duration on the article’s own terms rather than predicting one. And the 36-month scenario is a worked illustration of the two definitions, not a claim about any manager’s record. No forecast, no strategy recommendation and no position size appears anywhere above.
Why This Beats the Win Rate — Expectancy and the Hidden Drawdown
Now to the promise in the title. The reason drawdown matters more than win rate is that win rate is silent about the two things that actually decide whether a strategy is any good: how big your losses are relative to your wins, and how deep a hole they can dig together. A high win rate is often a warning sign in disguise. Strategies that win 80–90% of the time usually do so by taking many small, frequent wins while occasionally holding a loser far too long — which is precisely the profile that produces a sudden, catastrophic drawdown out of a long, comfortable winning streak. The win rate looks gorgeous right up until the drawdown that was hiding inside it arrives.
The number that unmasks this is expectancy — the average result per trade, which folds win rate together with the size of wins and losses:
Expectancy = (Win % × Average Win) − (Loss % × Average Loss)
An 80%-win strategy whose rare losers are six times its typical small winner has an expectancy of (0.80 × 1) − (0.20 × 6) = −0.40 per unit risked — it wins four trades out of five and still bleeds you dry, and it does it through a drawdown that the win rate gave you no warning about. Meanwhile a trend strategy that wins only 35% of the time but whose winners run four times its losers has an expectancy of (0.35 × 4) − (0.65 × 1) = +0.75, despite being wrong nearly two-thirds of the time [source: standard expectancy definition; the paired examples are illustrative arithmetic, not any specific strategy’s results — the win-rate-vs-expectancy relationship is developed further in the position-sizing article cross-linked below]. Win rate told you the opposite of the truth in both cases. Expectancy and drawdown told you the truth.
And the two are linked: expectancy tells you whether an edge exists; drawdown tells you whether you can survive the losing streaks on the way to collecting it. Even a strongly positive-expectancy system delivers its returns in a lumpy, path-dependent order, and some of those paths are long strings of losers that produce a deep drawdown before the edge reasserts itself. How much you bet per trade — position sizing — is what determines whether that inevitable losing streak is a survivable dip or an account-ending crater. That is why the professional’s scorecard is never “how often does it win?” It is “what does it return, relative to the worst drawdown it will put me through, and can I actually hold it through that drawdown without quitting?”
What “Survivable Drawdown” Means for You
All of this converges on a single, personal question that no backtest can answer for you: what is the deepest, longest drawdown you can hold through without abandoning the plan? Because a strategy you quit in the middle of its drawdown is strictly worse than a milder strategy you can actually keep — you will have paid the full cost of the decline and collected none of the recovery. The right-sized strategy is not the one with the highest backtested return; it is the one whose worst realistic drawdown — remembering that the real worst case exceeds the backtested one — sits comfortably inside what you can stomach with the amount of money you have committed.
That is a temperament question as much as a math one. Some people can sit through a violent 40% drop that recovers in a few months but come apart during a shallow, three-year grind sideways; others are the reverse. The trader who knows, honestly, which kind of pain would make them capitulate — and then sizes the strategy so its likely drawdown stays under that threshold — is the one who is still trading in five years. The one who picks the highest-returning backtest and discovers their true drawdown tolerance in the middle of a real one usually isn’t.
I can put a name to where that threshold found me: Apex. I cleared the first evaluation in a way I wouldn’t defend now — closer to gambling than to a process — and cleared a later one properly, on rules I’d actually written down beforehand. The part that kept repeating wasn’t in the evaluation, though. It was in the funded stage, where I’d break a rule I had set myself, let a loss run past the point I’d promised to stop, and fail there. Every one of those cycles ended the same way, with the subscription and the activation fee staying where they were. A funded account polices drawdown in a way a personal account never does, and that is exactly what makes it a fair test of whether the drawdown rule you wrote down is one you can actually keep for a full session.
Until you have lived through a real drawdown, it is worth sitting with the common version of the experience. On paper, a 30% drawdown is a line on a chart. In real life it is opening the account every morning for months and watching it be worth less than it was, telling yourself the edge is still there while a quiet voice asks whether this time is different, and facing the exact temptation the strategy was built to resist — to override the plan, cut the size, or walk away — at the precise moment doing so would lock in the loss. The people who make it through are rarely the ones with the most conviction that their system is special. They are the ones who sized small enough that the drawdown, however unpleasant, never threatened their ability to keep going. Survivability is bought in advance, with position size, not summoned in the moment with willpower.
The Rest of the Judgment Toolkit
Drawdown is one metric in a toolkit for judging whether a system is actually worth trading. The rest of the Trading Systems cluster fills in the others:
- How to Backtest a Trading Strategy the Right Way — the pillar. How to measure a strategy’s historical drawdown (and every other statistic) without fooling yourself.
- Mean Reversion vs Trend Following: Which Strategy Style Fits You? — the two families of edge produce very different drawdown signatures; choosing a style is partly choosing which kind of drawdown you’ll live with.
- Position Sizing Rules for Systematic Traders — the single biggest lever on how deep your drawdowns get. Expectancy says an edge exists; sizing decides whether its losing streaks are survivable.
- Sharpe Ratio Explained — the other headline risk-adjusted metric, dividing return by total volatility instead of drawdown, with its own blind spots.
- What Makes a Trading System Robust? A Checklist — where drawdown, Sharpe, out-of-sample results, and style-fit all come together into one judgment.
- What Is Overfitting in Backtesting (And How to Avoid It) and Why Most Trading Systems Fail Out-of-Sample — why a backtested max drawdown, like every backtested statistic, is a lucky lower bound rather than a promise.
If you want the plain-English, rigor-first read on building and judging trading systems — the honest version, where every number comes with what it can’t tell you attached — that is what the newsletter is for. Subscribe below to get the system-builder’s checklist.
What risk per trade does to the odds: hold the edge constant at a 40% win rate and 2:1 reward-to-risk, and the probability of ever reaching a 30% drawdown is 0.29% at 1% risk per trade, 5.37% at 2%, and 14.23% at 3%. Same edge, same market — tripling the risk per trade multiplies the odds of that drawdown roughly fiftyfold. The Risk of Ruin Simulator runs the calculation for your own win rate, payoff and risk setting.
Disclaimer: This article is educational content, not financial advice. I am not a licensed financial advisor, and nothing here is a recommendation to buy or sell any security or asset. Investing and trading involve risk, including the possible loss of the money you invest. Do your own research and consider consulting a licensed financial professional before making investment decisions. Read the full Disclaimer.
Historical and backtested results are hypothetical, carry inherent limitations, and do not guarantee future results. Figures were accurate to the best of my knowledge as of this article’s last-updated date and may have changed.
