Position Sizing in Forex: The Math That Keeps You in the Game
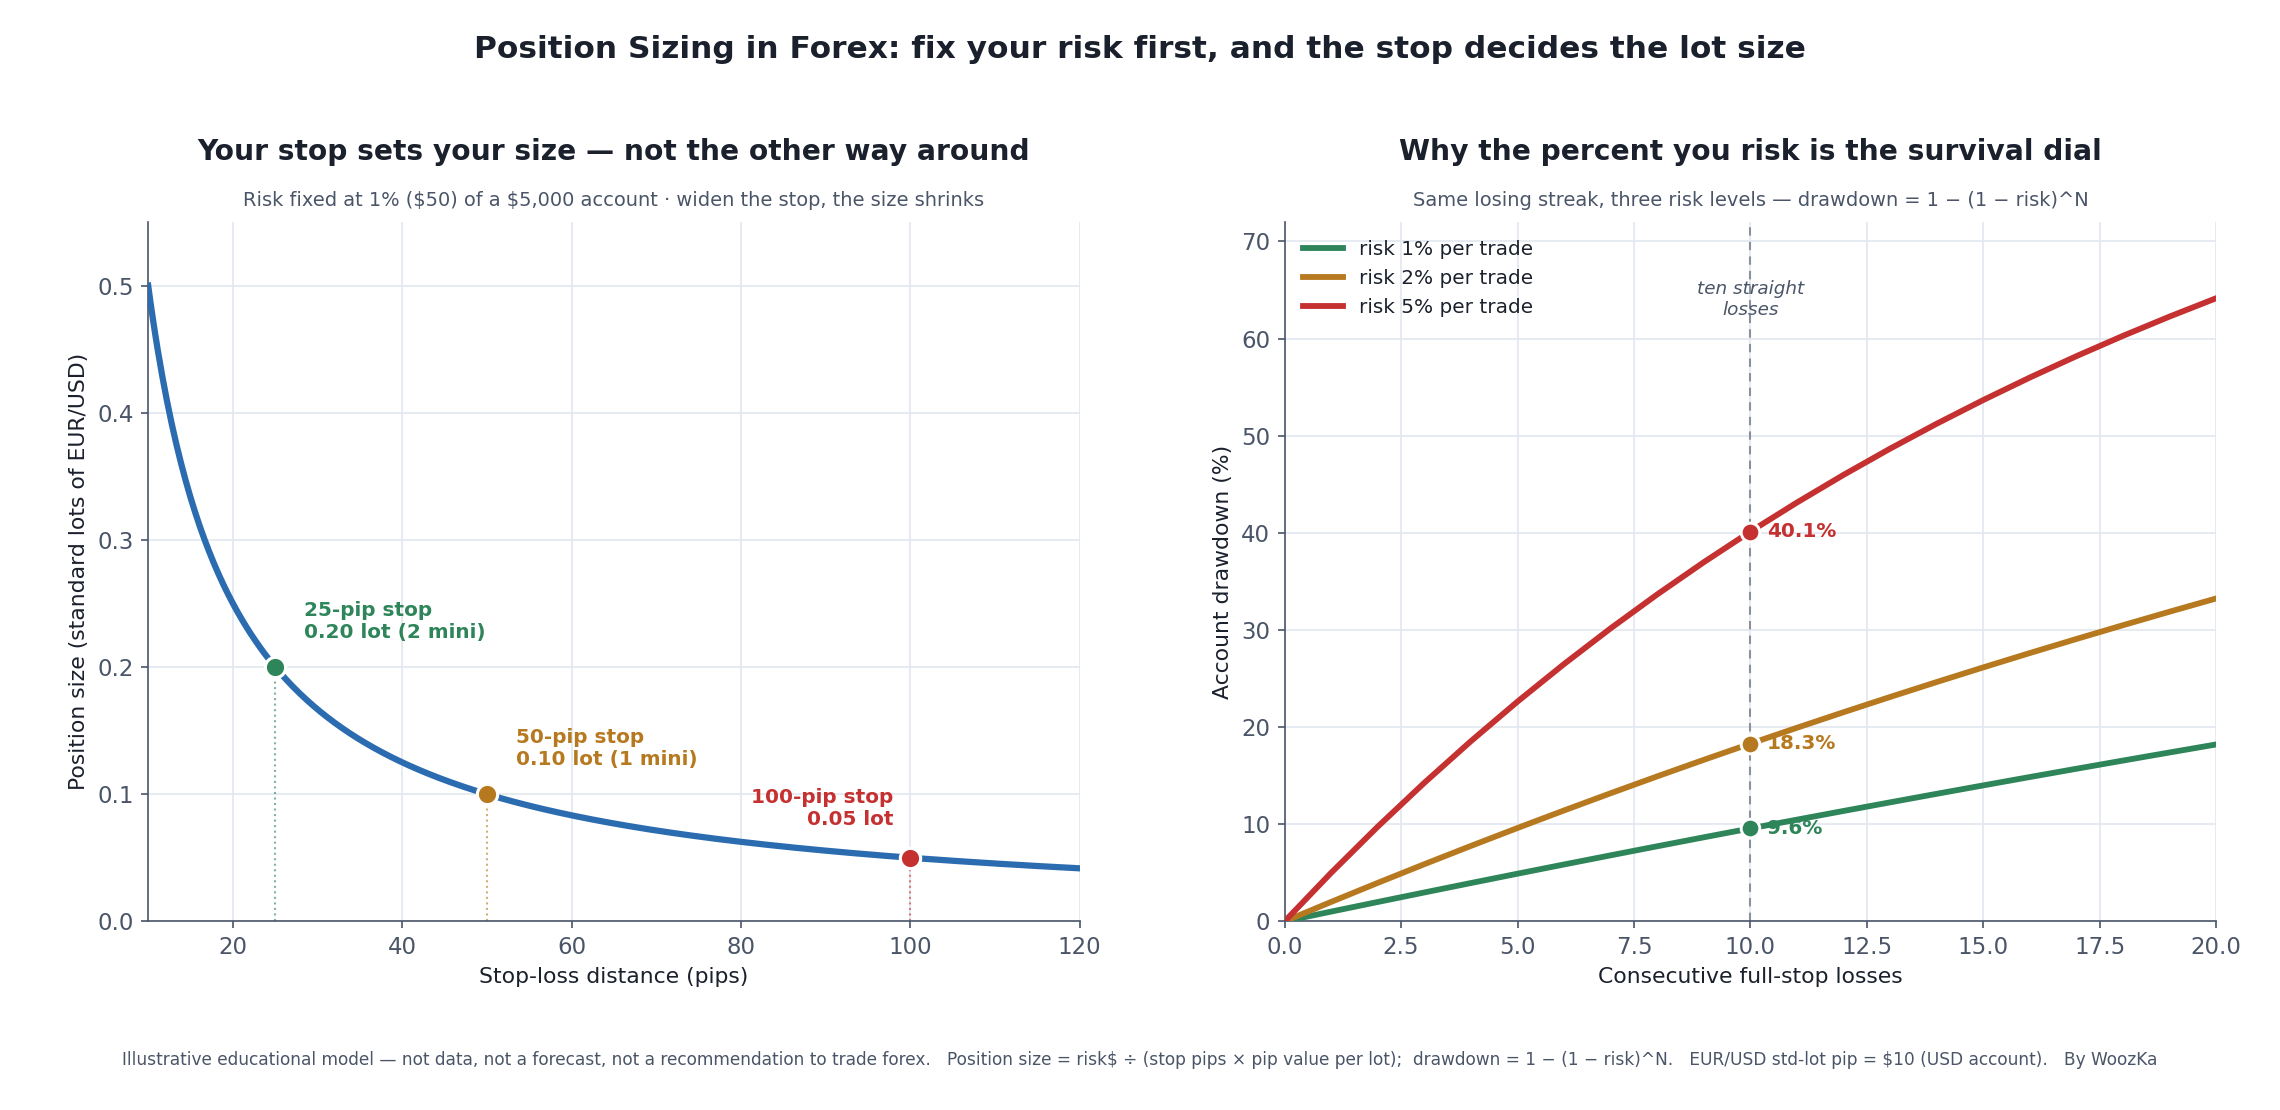 Two ideas in one picture. Left: once you fix how much you’ll risk, a wider stop forces a smaller position — size is the output, not the input. Right: the percentage you choose to risk per trade is the dial that decides how deep a normal losing streak can take you.
The leverage article in this series ended on a promise: disciplined traders don’t pick a position size by staring at the broker’s “up to 50:1” and guessing. They start from a risk-per-trade rule — the small, fixed slice of the account they’re willing to lose if a single trade hits its stop — and let that number, together with the distance to the stop, calculate the position size for them. Effective leverage then falls out as a byproduct, usually in low single digits. This article is that calculation, worked step by step.
It matters because position sizing is the quietest and most decisive part of trading. You can be right about direction more often than not and still blow up an account if a few of your wrong trades are far too large. Position sizing is what turns a losing streak — which every method produces — into a survivable dip instead of a fatal hole. That’s the whole reason for the title: sizing is the math that keeps you in the game long enough for an edge, if you have one, to matter.
This is not an “easy income” or “double your account” article — that framing is exactly the promotional pattern this blog exists to counter, and the regulator loss data in the pillar is the reason. It is a plain, arithmetic look at one formula, three worked examples, the mistakes that break it, and why the percentage you plug in matters more than any indicator you’ll ever learn.
The One Formula
Every position-sizing calculation in forex reduces to a single equation. You decide two things up front — how much money you’ll risk, and where your stop-loss sits — and the formula returns the third:
Position size (lots) = Risk in your account currency ÷ (Stop-loss distance in pips × pip value per lot)
The numerator is the dollar amount you’re willing to lose on the trade: your account equity × your risk-per-trade percentage. The denominator is what one lot would actually lose if price traveled from your entry to your stop: the number of pips to the stop, multiplied by what a pip is worth per lot on that pair [source: standard forex position-sizing formula, e.g., CMC Markets Lot Sizes guide; Babypips Position Sizing lesson — the arithmetic below is checkable].
Notice the order of operations. You do not decide “I’ll trade one standard lot” and then find a stop to fit it. You decide what you’ll risk, you decide where the trade is wrong (the stop), and the lot size is whatever makes those two numbers agree. Size is an output, never an input. Nearly every sizing disaster comes from doing it backwards.
Three quantities feed the formula, so we need each of them straight first.
The Three Inputs
1. Risk per trade — a fixed, small percentage of the account. The widely taught ceiling is the 2% rule, popularized by Dr. Alexander Elder in Come Into My Trading Room (2002): never let the risk on any single position exceed 2% of your account. Elder is explicit that 2% is a maximum, not a target — “Good traders tend to stay well below the 2% limit” — and most professionals size closer to 1% or less [source: Alexander Elder, Come Into My Trading Room, 2002; SteadyOptions summary of the 2% rule]. Van Tharp’s Trade Your Way to Financial Freedom formalizes the same idea as the “percent-risk model,” one of several sizing systems he documents [source: Van K. Tharp, Trade Your Way to Financial Freedom; The Definitive Guide to Position Sizing]. Beginners are usually best served by the low end — 0.5% to 1% — because the whole point of the rule is to survive the stretch where you’re still learning. Throughout this article we’ll use 1%.
2. Stop-loss distance — in pips, set by the chart, not by convenience. Your stop belongs at the price where your trade idea is wrong — beyond a structural level, a swing high/low, or a volatility band — not at whatever distance happens to allow the position size you wanted. The number that feeds the formula is the pip distance from your entry to that stop. (The pillar covers what a pip is; the short version is that for most pairs a pip is the fourth decimal, 0.0001, and for yen pairs it’s the second decimal, 0.01 [source: pillar; standard pip conventions].)
3. Pip value per lot — and it is not always $10. On a standard lot (100,000 units) of a pair quoted in U.S. dollars, such as EUR/USD, one pip is worth $10; a mini lot (10,000 units) is $1 per pip, and a micro lot (1,000 units) is $0.10 per pip [source: standard lot/pip-value conventions; Babypips Pip Value Calculator]. That clean $10 only holds when the pair’s quote currency (the second one) matches your account currency. When it doesn’t, you have to convert: pip value in your account currency = pip value in the quote currency ÷ the exchange rate between your account currency and that quote currency [source: Babypips / earnforex pip-value formula]. USD/JPY is the classic trap — we’ll work it below and watch the “$10” assumption break.
Worked Example 1: The Base Case
Take the same $5,000 account from the leverage article, trading EUR/USD, risking 1% per trade, with a stop 25 pips away.
- Risk in dollars = $5,000 × 1% = $50. That’s the most this trade can lose if it hits the stop.
- Pip value (EUR/USD, USD account) = $10 per standard lot.
- What one standard lot would lose at the stop = 25 pips × $10 = $250.
- Position size = $50 ÷ $250 = 0.20 standard lots — that is, 2 mini lots.
Check it the other way: 2 mini lots × 25 pips × $1 per pip = $50. Exactly 1% of the account, as designed. And notice the effective leverage this produces: 2 mini lots is 20,000 units, about $22,000 of currency at 1.1000, on $5,000 of equity — 4.4:1 effective leverage, a fraction of the broker’s 50:1 ceiling. You didn’t aim for a leverage number; a sober one fell out of sizing from risk. That is the entire handoff from the leverage article made concrete.
Worked Example 2: Widen the Stop, Shrink the Size
Now suppose the chart demands a 50-pip stop instead — same account, same 1%, same pair.
- Risk in dollars = still $50 (the rule didn’t change).
- What one standard lot would lose at the stop = 50 pips × $10 = $500.
- Position size = $50 ÷ $500 = 0.10 standard lots — 1 mini lot.
The stop doubled, so the position halved. The dollar risk stayed pinned at $50 the whole time. This is the inverse relationship the left panel of the chart draws: hold risk constant and position size falls as the stop widens. It’s also why “I always trade one mini lot” is not a risk rule — a fixed lot size means a 25-pip trade and a 100-pip trade risk wildly different amounts of money. The constant should be the dollars at risk, and the lot size should move to keep it constant.
Worked Example 3: When the Pip Isn’t Worth $10
Here’s the one that catches people. Same $5,000 account (in USD), risking 1% = $50, but trading USD/JPY at 150.00 with a 30-pip stop.
For a yen pair, a pip is 0.01, so one standard lot moves 100,000 × 0.01 = ¥1,000 per pip. Converting to dollars at 150.00: ¥1,000 ÷ 150 ≈ $6.67 per pip per standard lot — not $10 [source: pip-value conversion formula; yen-pair pip = 0.01].
- What one standard lot would lose at the stop = 30 pips × $6.67 ≈ $200.
- Position size = $50 ÷ $200 ≈ 0.25 standard lots — about 2.5 mini lots.
Had you assumed the reflexive “$10 a pip,” you’d have computed 30 × $10 = $300 per lot and sized down to ~0.167 lots — carrying a third less position than your own risk rule actually allows, or, if you’d erred the other way on a different pair, more risk than you intended. The formula is only as honest as the pip value you feed it, and the pip value depends on the pair and your account currency. When in doubt, use your broker’s position-size calculator, which converts automatically — but understand why it’s doing the division, so a wrong input doesn’t sail past you.
The Input That Matters Most: The Percentage
Everything above sizes a single trade correctly. The right-hand panel of the chart is about the thing that actually ruins accounts: a string of losing trades, which every method on earth produces sooner or later. Here the risk percentage you chose stops being a detail and becomes the whole story.
Percent-risk sizing has a built-in safety feature: because you risk a percentage of the current balance, your position size automatically shrinks after losses and grows after gains. Lose a few and the next trade is smaller in dollar terms — the method leans against a downward spiral instead of feeding it. But the size of the percentage decides how steep even that self-correcting decline is. Run the arithmetic of ten straight losers:
| Risk per trade | Drawdown after 10 consecutive losses | Drawdown after 20 |
|---|---|---|
| 1% | about 9.6% | about 18.2% |
| 2% | about 18.3% | about 33.2% |
| 5% | about 40.1% | about 64.2% |
[Arithmetic: drawdown = 1 − (1 − risk%)ᴺ for N consecutive full-stop losses.]
Ten losses in a row is not a freak event; it is an ordinary feature of a strategy that wins, say, half its trades. At 1%, that streak costs you under 10% and you trade on. At 5%, the same streak carves out 40% of the account — and recall from the leverage article that a 40% hole needs a 67% gain just to get back to even. The trader risking 1% is bruised; the trader risking 5% is fighting for survival, from an identical run of bad luck. Same edge, same losing streak, wildly different fate — decided entirely by one number chosen before any trade was placed.
This is why the percentage, not the entry signal, is the survival dial. It’s also the bridge to the deeper treatment of this idea: Risk of Ruin: The Math Every Leveraged Trader Should Know works out the probability that a given risk-per-trade level, win rate, and payoff eventually empty the account. Position sizing is simply how you keep that probability low enough to stay in the game.
What “Keeps You in the Game” Actually Costs
Three claims above are made and never priced. This article says a ten-loss streak is “not a freak event” without saying how often one arrives; it publishes drawdowns for 1%, 2% and 5% but carries only one of those six cells through to the climb back out; and it says effective leverage “usually” lands in low single digits on the strength of a single worked example. All three are arithmetic, so here they are. Every position-size figure below comes from the same Forex Position Size & Pip Calculator this article already links.
How Ordinary Is Ten in a Row?
Take this article’s own premise — a method that wins about half its trades — and ask how likely that streak really is. The answer turns entirely on something the sentence leaves out: how many trades you take. Each row is the exact probability of hitting at least one such streak somewhere in that many trades.
| Trades | Run of 10+ | Run of 20+ |
|---|---|---|
| 100 | 4.4% | 0.004% |
| 250 | 11.2% | 0.011% |
| 500 | 21.5% | 0.023% |
| 1,000 | 38.5% | 0.047% |
| 2,500 | 70.6% | 0.118% |
| 5,000 | 91.4% | 0.237% |
So the claim is true, and it is a claim about a career rather than about a month. Over a hundred trades a ten-loss run is a 4.4% event, which most people would call rare; the odds pass even money at trade 1,421 and reach 91.4% by five thousand. A trader taking two positions a week may go years without seeing one. Someone trading intraday will meet several. That is the honest shape of “not a freak event” — it is close to inevitable if you trade long enough, and quite unlikely in any particular stretch, and both halves matter when you are deciding what to survive.
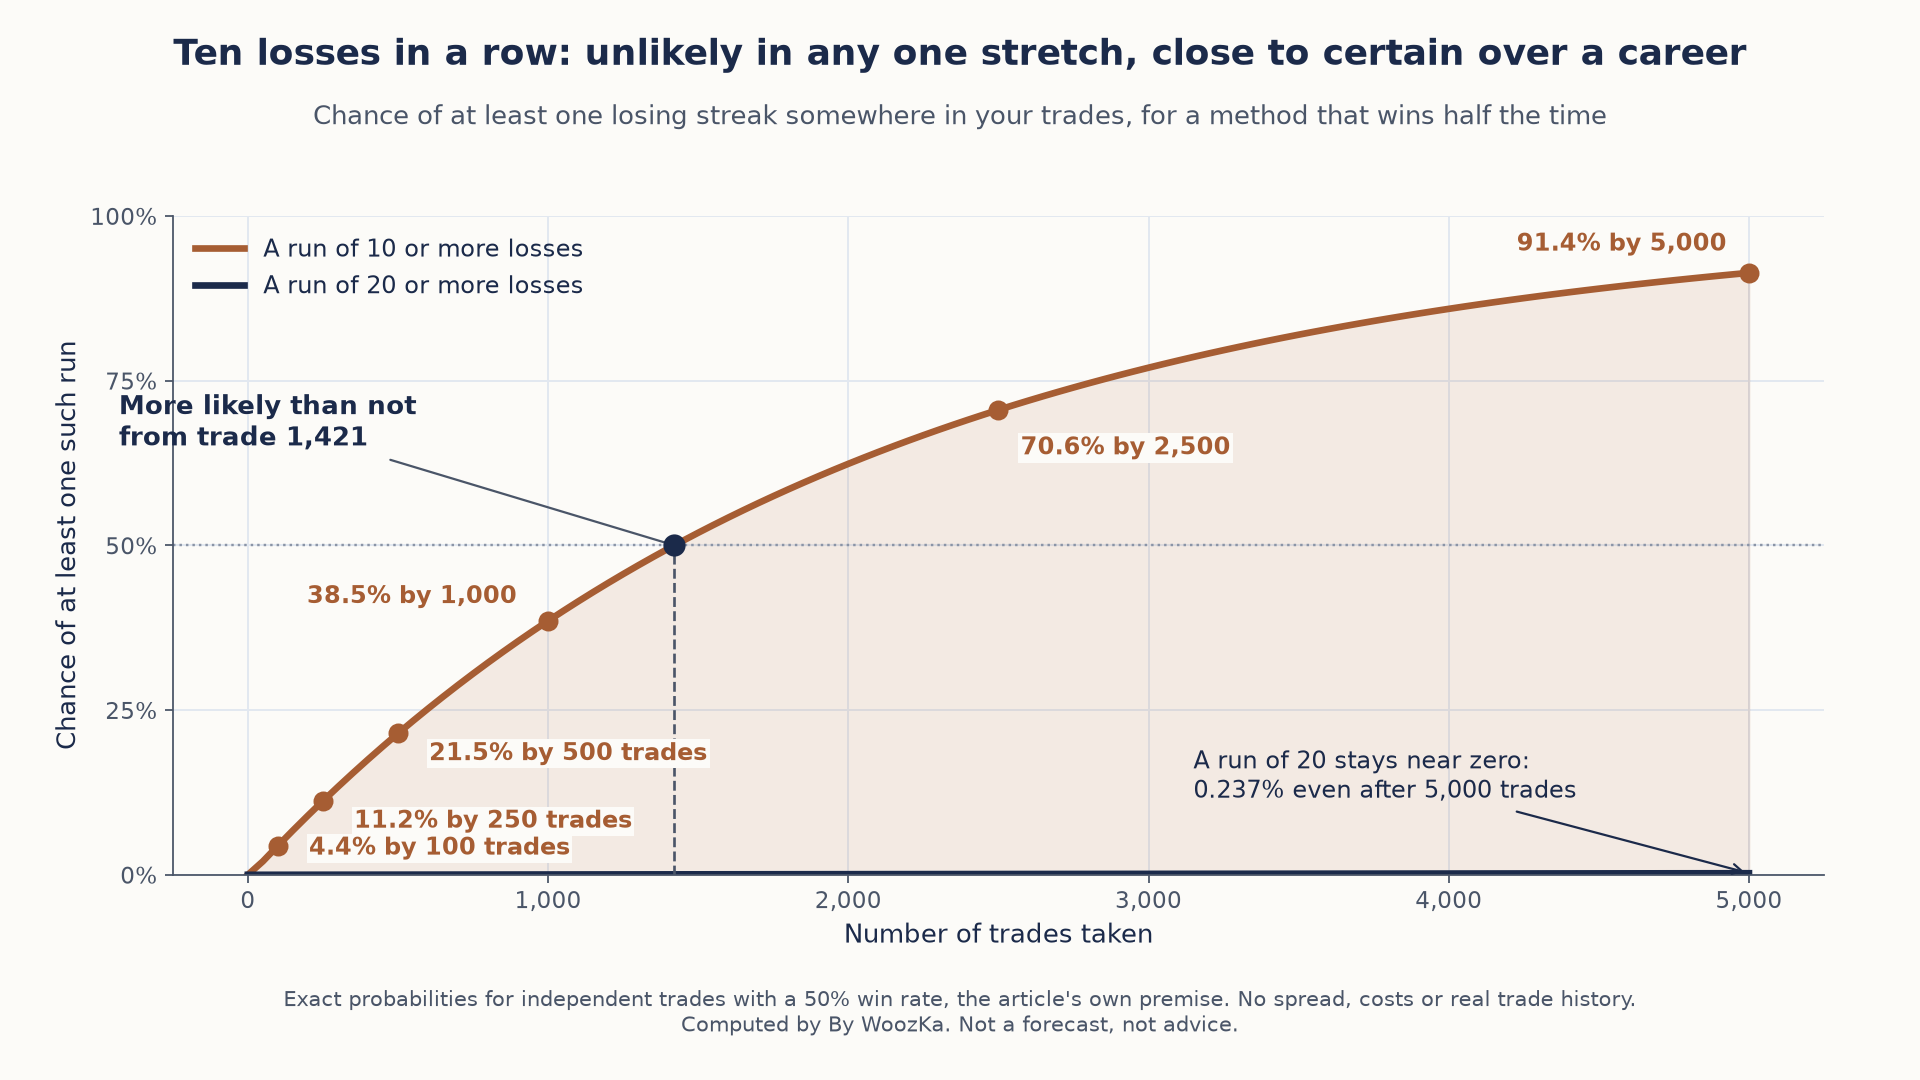 A ten-loss streak is a small risk in any single stretch of trading and close to a certainty over thousands of trades, while a twenty-loss streak stays rare throughout. Plan around the ten.
The second column is the one that changes how the table above it should be read. This article puts ten losses and twenty losses side by side as though they were two points on the same scale. At a 50% win rate they are not remotely comparable: over a thousand trades a run of twenty is roughly 820 times rarer than a run of ten. The twenty-loss column is a stress test, not a forecast, and the ten-loss column is the one to plan around.
The Climb Back Out
This article gives the drawdown for each risk level and then, separately, the rule that a 40% hole needs a 67% gain to undo. Only one of the six cells ever gets that treatment. Here are all of them, with the number of winning trades the recovery takes if a win gains what a loss costs — a payoff ratio this article never specifies, so it is assumed here and stated rather than hidden.
| Risk | Losses | Drawdown | Gain to even | Wins needed |
|---|---|---|---|---|
| 1% | 10 | 9.6% | 10.6% | 10.10 |
| 1% | 20 | 18.2% | 22.3% | 20.20 |
| 2% | 10 | 18.3% | 22.4% | 10.20 |
| 2% | 20 | 33.2% | 49.8% | 20.40 |
| 5% | 10 | 40.1% | 67.0% | 10.51 |
| 5% | 20 | 64.2% | 179.0% | 21.03 |
Two things come off this table, and the second cuts against a lazy reading of the first. The first is the one already implied above: after the same ten losses the hole at 5% is 4.20 times the hole at 1%, and the gain needed to erase it runs from 10.6% to 67.0%. The second is that measured in trades rather than percentages, the climb is very nearly the same length — 10.10 winning trades at 1%, 10.51 at 5%. Both accounts compound at their own rate, so the 67% is not evidence that the 5% trader faces a longer road. What that trader actually faces is a much smaller account while walking it: down 40.1%, about three-fifths of the money is left to absorb whatever comes next, and gaps, slippage and correlated positions — three failures this article flags elsewhere — all bite harder the less capital remains. The drawdown percentage is the right thing to fear. The recovery percentage is not the reason.
Is Effective Leverage “Usually” Low?
The opening promises that a sober leverage number falls out of sizing as a byproduct, and one case is shown: a 25-pip stop on the $5,000 account producing 4.4:1. Run the same account and the same 1% rule across a range of stop distances and the word “usually” acquires a threshold.
| Stop | Lots | Notional | Leverage |
|---|---|---|---|
| 5 pips | 1.00 | $110,000 | 22.0:1 |
| 10 pips | 0.50 | $55,000 | 11.0:1 |
| 11 pips | 0.45 | $50,000 | 10.0:1 |
| 25 pips | 0.20 | $22,000 | 4.4:1 |
| 50 pips | 0.10 | $11,000 | 2.2:1 |
| 100 pips | 0.05 | $5,500 | 1.1:1 |
Effective leverage is not loosely connected to the stop; it is exactly inversely proportional to it. Every row of that table is 110 divided by the stop in pips, which is why 25 pips gives 4.4:1 and 50 pips gives exactly half of that. Written out, effective leverage equals your risk percentage times the rate, divided by the stop distance times the pip size — and the striking part is what is absent from that expression. Account equity cancels. A $1,000 account and a $250,000 account running the same 1% rule behind the same 25-pip stop carry identical effective leverage of 4.4:1. Sizing from risk really does control leverage, exactly as this article claims, but the dial is the stop distance, not the size of the account.
The promise holds only down to about 11 pips, though, and that is the practical warning the single worked example hides. Below that the byproduct stops being sober: a 10-pip stop, entirely ordinary for anyone trading intraday, runs 11.0:1, and a 5-pip stop runs 22.0:1 — within sight of the 50:1 ceiling this article spends its opening telling you not to stare at. A tight stop is not automatically a small position. It is the one input that can quietly hand back the leverage that sizing from risk was supposed to take away.
How these lot sizes were produced, and what that assumes. Every lot size and notional above comes from forexPositionSize and forexPipValuePerLot, the two functions behind the Forex Position Size & Pip Calculator this article links, so each row can be reproduced in your browser; the account, the 1% rule, the pair and the 1.1000 rate are all this article’s own. Two modeling choices are made explicit. First, a loss is treated as a full stop-out costing exactly the risk percentage and trades are treated as independent — that is this article’s own drawdown model, the assumption that makes its formula the right one, and it is an idealization, since real trades are neither perfectly independent nor perfectly full-stop. Second, “wins needed” assumes a win gains the same percentage a loss costs; a worse payoff makes recovery strictly harder, so those figures are a floor. Streak probabilities are computed exactly, by working across the run length rather than by approximation, which is why the hundred-trade row is right and not merely close. Nothing here models spread, commission, swap or slippage, and no win rate other than the 50% this article names is assumed anywhere. The calculation behind these tables reports every figure above and confirms that this article’s own published numbers — the $50 risk, the 0.20, 0.10 and 0.25 lot sizes, the $22,000 notional, the 4.4:1, the $6.67 yen pip value, the “a third less” comparison and all six drawdown cells — re-derive exactly before it reports anything. They do.
Common Position-Sizing Mistakes
- Sizing first, stopping second. Choosing “one standard lot” and then placing the stop wherever leaves room is the backwards order that breaks the whole method. Decide risk and stop first; let the lot size be the output.
- A fixed lot size for every trade. One mini lot on a 20-pip trade and one mini lot on a 120-pip trade are not the same risk — they differ sixfold. Constant dollars at risk, not constant lots, is the rule.
- Assuming every pip is worth $10. True only when the quote currency is your account currency and you’re trading a standard lot. Yen pairs, cross pairs, and non-USD accounts all change the number, as Example 3 showed.
- Forgetting spread, slippage, and gaps. Your real loss can exceed the pip distance you drew: the spread widens your effective stop, fast markets can slip past it, and a weekend gap can jump it entirely. Size with a little margin, and never treat the stop as a guarantee of the exact loss — Margin Calls Explained covers what happens when a gap blows through it.
- Moving the stop to justify a bigger position. Widening a stop after entry so a losing trade has “room” quietly converts a 1% trade into a much larger one. If the size is too small to feel worthwhile at a proper stop, the honest fix is a smaller account expectation, not a looser stop.
- Ignoring total open risk. Six trades each risking 1% can add up to 6% at risk at once if they’re correlated (several USD pairs moving together). Elder’s companion “6% rule” caps total monthly risk for exactly this reason [source: Elder, Come Into My Trading Room, 6% rule]; the point is that per-trade sizing and portfolio-level risk are two different limits, and you need both.
Putting It Together
Position sizing is not a strategy and it won’t tell you what to trade. What it does is convert a risk decision you can actually control — a small, fixed percentage — into an exact number of lots, on any pair, at any stop distance, in three arithmetic steps: fix the dollars you’ll risk, measure the stop in pips, divide by what a pip is worth per lot. Do that consistently and your effective leverage stays low by construction, a normal losing streak stays shallow, and you’re still solvent when a good setup finally appears.
If you’ve never sized a trade this way, the discipline feels strange at first: the formula frequently tells you to trade smaller than you want to, and it never rewards the urge to press harder after a loss. That discomfort is the method working. The size that feels “worth it” emotionally is almost always larger than the size the math allows — and closing that gap, trade after trade, is most of what separates accounts that compound slowly from accounts that disappear.
Where to Go Next
Sizing is the operational half of the risk lesson the leverage article started; together they’re the core of surviving leveraged markets:
- Leverage in Forex: Why It Cuts Both Ways — the difference between the broker’s ceiling and the effective leverage you actually run, and why a leveraged loss is harder to undo than the gain that caused it. Read it first if you haven’t.
- How Forex Trading Actually Works: A Beginner’s Guide to Currency Pairs — the pillar: pairs, pips, lots, margin, and the real loss statistics.
- Margin Calls Explained: How to Avoid Getting Wiped Out — what happens when a stop is gapped through, plus negative-balance risk and which brokers protect against a deficit.
- Risk of Ruin: The Math Every Leveraged Trader Should Know — how win rate, payoff, and risk-per-trade combine into the probability of eventually going bust.
If you want markets explained plainly — risk-first, never hyped — that’s what the newsletter is for. Subscribe below.
Where the pair changes the answer: on the $5,000 account risking 1% ($50) behind a 50-pip stop used above, EUR/USD is $10 per pip per standard lot, so the size is 0.10 lots. Switch to USD/JPY at 150.00 and a pip is worth $6.67 per lot instead — the same $50 of risk and the same 50-pip stop now allow 0.15 lots. The Forex Position Size & Pip Calculator carries the pip values for all 29 instruments it lists, so the conversion is not done by hand.
Disclaimer: This article is educational content, not financial advice. I am not a licensed financial advisor, and nothing here is a recommendation to buy or sell any security or asset. Investing and trading involve risk, including the possible loss of the money you invest. Do your own research and consider consulting a licensed financial professional before making investment decisions. Read the full Disclaimer.
Historical and backtested results are hypothetical, carry inherent limitations, and do not guarantee future results. Figures were accurate to the best of my knowledge as of this article’s last-updated date and may have changed.
